HAL Id: hal-00295708
https://hal.archives-ouvertes.fr/hal-00295708
Submitted on 4 Aug 2005
HAL is a multi-disciplinary open access
archive for the deposit and dissemination of
sci-entific research documents, whether they are
pub-lished or not. The documents may come from
teaching and research institutions in France or
abroad, or from public or private research centers.
L’archive ouverte pluridisciplinaire HAL, est
destinée au dépôt et à la diffusion de documents
scientifiques de niveau recherche, publiés ou non,
émanant des établissements d’enseignement et de
recherche français ou étrangers, des laboratoires
publics ou privés.
over southern Africa
S. J. Abel, E. J. Highwood, J. M. Haywood, M. A. Stringer
To cite this version:
S. J. Abel, E. J. Highwood, J. M. Haywood, M. A. Stringer. The direct radiative effect of biomass
burning aerosols over southern Africa. Atmospheric Chemistry and Physics, European Geosciences
Union, 2005, 5 (7), pp.1999-2018. �hal-00295708�
www.atmos-chem-phys.org/acp/5/1999/ SRef-ID: 1680-7324/acp/2005-5-1999 European Geosciences Union
Chemistry
and Physics
The direct radiative effect of biomass burning aerosols over
southern Africa
S. J. Abel1,2, E. J. Highwood1, J. M. Haywood2, and M. A. Stringer1
1Department of Meteorology, University of Reading, UK
2Met Office, Exeter, UK
Received: 8 November 2004 – Published in Atmos. Chem. Phys. Discuss.: 7 March 2005 Revised: 1 July 2005 – Accepted: 4 July 2005 – Published: 4 August 2005
Abstract. A multi-column radiative transfer code is used to
assess the direct radiative effect of biomass burning aerosols over the southern African region during September. The hor-izontal distribution of biomass smoke is estimated from two sources; i) General Circulation Model (GCM) simulations combined with measurements from the Aerosol Robotic Net-work (AERONET) of Sun photometers; ii) data from the Moderate resolution Imaging Spectrometer (MODIS) satel-lite. Aircraft and satellite measurements are used to con-strain the cloud fields, aerosol optical properties, vertical structure, and land surface albedo included in the model. The net regional direct effect of the biomass smoke is −3.1
to −3.6 Wm−2 at the top of atmosphere, and −14.4 to
−17.0 Wm−2at the surface for the MODIS and GCM
distri-butions of aerosol. The direct radiative effect is shown to be highly sensitive to the prescribed vertical profiles and aerosol optical properties. The diurnal cycle of clouds and the spec-tral dependency of surface albedo are also shown to play an important role.
1 Introduction
Atmospheric aerosols provide one of the largest uncertain-ties in our understanding of how human beings are continu-ally altering the Earth’s climate. Aerosols act to modify the radiative balance of the climate system by scattering and ab-sorbing radiation (the direct effect), and by altering the life-time and radiative properties of clouds (the indirect effect). Both effects are believed to lead to a reduction in the global annual mean surface temperature, thereby suppressing the warming that is attributed to anthropogenic greenhouse gases (e.g. Boucher and Haywood, 2001; IPCC, 2001).
Correspondence to: S. J. Abel (steven.abel@metoffice.gov.uk)
Biomass burning has been recognized as a significant con-tributor to the burden of aerosols in continental tropical re-gions (Crutzen and Andreae, 1990), and the corresponding radiative impacts are often much more dramatic than that from greenhouse gases on local and regional scales (e.g. Ross et al., 1998; Ichoku et al., 2003; Keil and Haywood, 2003). However, quantifying the impact of biomass burning aerosols on both regional and global climate is problematic, due to the complexity in the aerosols chemical, physical, and optical properties, their spatial and temporal variability in the atmosphere, and the difficulty in characterizing their interac-tion with clouds. This is highlighted by the factor of three uncertainty and the very low level of scientific understanding assigned by IPCC (2001) for the global annual mean direct radiative forcing from biomass burning aerosols.
Detailed in situ measurements and satellite based retrievals have the potential to address some of these uncertainties, en-abling the representation of the radiative effects of aerosols in climate models to be improved. This study incorporates satellite and in situ based measurements of biomass burning aerosols into a multi-column radiative transfer code, to assess their direct radiative effect over the southern African region during September when anthropogenic burning activities are widespread. Sensitivity studies are then performed with the aim of highlighting the important parameters that need to be targeted by future observations and well represented in cli-mate models in order to reduce the current uncertainties in the direct radiative effect of biomass burning aerosols.
2 Experimental setup
2.1 Radiative transfer model
A multi-column version of the Edwards-Slingo radiative transfer code (Edwards and Slingo, 1996) is used to exam-ine the short-wave direct radiative effect of southern African
Table 1. Summary of the number of AERONET stations, months, and days in the climatology during the observation period June 1995– September 2003 for each month of the year. Also shown is the factor by which the total aerosol optical depth in the GCM of Tegen et al. (1997) needs to be increased to obtain a reasonable agreement with AERONET measurements.
Jan. Feb. March Apr. May June July Aug. Sept. Oct. Nov. Dec.
Stations 7 8 7 6 8 13 11 18 20 13 10 9 Months 16 18 17 14 17 23 22 34 36 27 25 19 Days 281 258 260 287 373 445 435 685 706 461 367 299 Factor 2.7 3.1 2.5 2.2 1.3 0.9 1.1 1.8 2.5 3.4 1.8 2.2 -2 Ascension Island Swakopmund Etosha Pan Bethlehem Inhaca Skukuza Skukuza Aeroport Joberg Witts University Sua Pan Maun Tower Sesheke Senanga Mongu Kaoma Kaloma Zambezi Solwezi Ndola Mfuwe Mwinilumga Kasama -20 -10 0 10 20 30 40 50 Longitude [degrees East]
-10 -18 -26 -34 La titude [degr ees N or th] 10 - 12 7 - 9 4 - 6 1 - 3 Number of months of the year that have observations
Fig. 1. AERONET stations in southern Africa that are used to build up a climatology of monthly mean aerosol optical depth. The num-ber of months of the year that data are available is also shown for each station.
biomass burning aerosols. Calculations are performed using the two-stream delta-Eddington approximation at a spectral resolution of 220 bands, encompassing the wavelength range 0.2 to 10 µm, with the majority of bands situated in the vis-ible and near infra-red part of the spectrum. The horizontal
resolution of the model was set at 4×5◦, and the vertical
res-olution at 33 levels. The long-wave effect of the biomass burning aerosol is neglected and is likely to be small due to the strong wavelength dependence of the aerosol extinction coefficient (Haywood et al., 2003a).
3-D fields of any radiatively active gaseous absorbers, aerosols, and clouds, and a 2-D surface pressure and Lam-bertian surface albedo field can be prescribed in the model. In this study, the vertical profiles of temperature, pressure, and gaseous absorbers were held constant at every grid box. The tropical climatology of McClatchey et al. (1972) was
used for temperature, O3, and H2O(g). Other greenhouse
gases included in the model were N2O, CH4, CO2, and O2.
The mixing ratio data for these gases were taken from Cofer et al. (1996) and IPCC (2001) and were assumed to be well
mixed throughout the atmosphere. Although elevated levels
of gaseous absorbers such as CH4will exist in the biomass
plume, the impact on the short-wave is negligible. The dis-tributions of biomass burning aerosol, cloud, and surface albedo included in the model are discussed in subsequent sections.
2.2 Horizontal distribution of aerosol
Two independent sources are used to simulate the horizon-tal distribution of biomass burning aerosols over southern Africa; i) General circulation model (GCM) calculations that utilize transport models of various aerosol species (Tegen et al., 1997); ii) the Moderate resolution Imaging Spec-trometer (MODIS) satellite retrieval of aerosol optical depth (Kaufman et al., 1997; Tanr´e et al., 1997; Ichoku et al., 2003).
2.2.1 Model estimate of aerosol optical depth
The GCM model data of Tegen et al. (1997) consists of a global distribution of the monthly mean aerosol optical depth
at a wavelength of 0.55 µm (τλ=0.55 µm), for several aerosol
species based on transport models of soil dust (Tegen and Fung, 1995), sea salt (Tegen et al., 1997), sulfate (Chin et al., 1996), and organic carbon (OC) and black carbon (BC) (Li-ousse et al., 1996) aerosols. The data is output at a horizontal
resolution of 4×5◦. The carbonaceous component (OC+BC)
characterizes aerosols emitted from natural sources (e.g. di-rect emission of OC from plants), fossil fuel burning, do-mestic fires (e.g. wood/charcoal/dung), agricultural fires (e.g. wheat/corn/rice), and savanna and forest burning. For this study, the contribution by biomass burning aerosols to the carbonaceous component over southern Africa during the dry season are assumed to dominate over emissions from natural and fossil fuel sources, allowing the spatial distribution of the biomass smoke to be determined.
A climatology of ground based observations from the Aerosol Robotic Network (AERONET) of Sun and sky scan-ning spectral radiometers (Holben et al., 1998) over south-ern Africa is compiled to assess the accuracy of the GCM calculations. The cloud screened, calibrated, and manually inspected Level 2.0 AERONET data (Smirnov et al., 2000) covering the time period of June 1995–September 2003 is
J F M A M J J A S O N D 0.0 Month of year 0.1 0.2 0.3 0.4 A e rosol optic al depth ( λ =0.55 µ m) J F M A M J J A S O N D 0.0 Month of year 0.1 0.2 0.3 0.4 0.5 A e rosol optic al depth ( λ =0.55 µ m) J F M A M J J A S O N D 0.0 Month of year 0.2 0.4 0.6 A e rosol optic al depth ( λ =0.55 µ m) J F M A M J J A S O N D 0.0 Month of year 0.4 0.3 0.2 0.1 A e rosol optic al depth ( λ =0.55 µ m) J F M A M J J A S O N D 0.0 Month of year 0.1 0.2 0.3 0.4 0.5 A e rosol optic al depth ( λ =0.55 µ m) J F M A M J J A S O N D 0.6 0.5 0.4 0.3 0.2 0.1 0.0 Month of year A e rosol optic al depth ( λ =0.55 µ m) AERONET data (1995-2002) GCM data
GCM data with correction MODIS data (2000-2003)
AERONET data (2000-2002) GCM data
GCM data with correction MODIS data (2000-2003)
AERONET data (1998-2002) GCM data
GCM data with correction MODIS data (2000-2003) AERONET data (2000-2001)
GCM data
GCM data with correction MODIS data (2000-2003) AERONET data (1998-2003) GCM data
GCM data with correction MODIS data (2000-2003)
AERONET data (2000-2001) GCM data
GCM data with correction MODIS data (2000-2003)
ASCENSION ISLAND BETHLEHEM
INHACA ETOSHA PAN
SKUKUZA MONGU
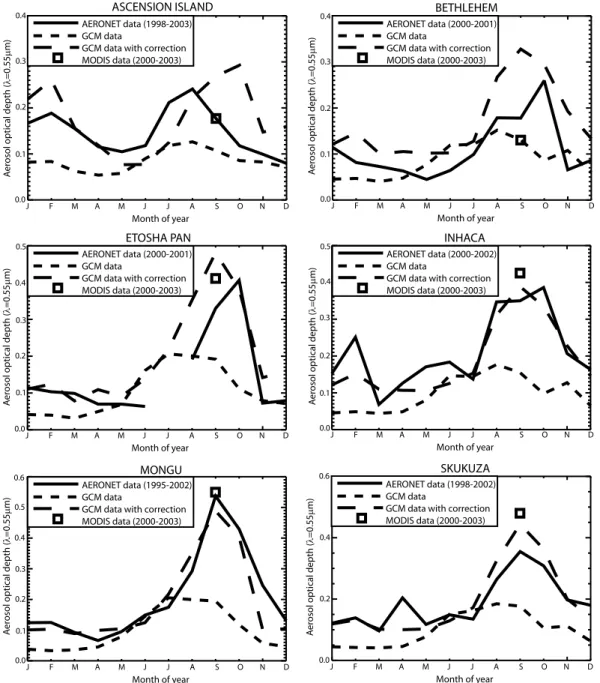
Fig. 2. Comparison of the monthly mean column integrated aerosol optical depth at 0.55 µm from the GCM of Tegen et al. (1997) with values measured at 6 AERONET sites. The years where the AERONET data was obtained is indicated on the individual plots. Also shown is the monthly mean value with a correction factor applied to the GCM data derived from a linear fit to the AERONET measurements (see Table 1), and the mean MODIS aerosol optical depth (1×1◦) for September (2000–2003 average) co-incident with the AERONET site.
used. A daily averaged τλ is initially compiled at each
AERONET site, and then the monthly mean computed. Only days where at least three individual measurements are avail-able are included in the climatology. This process resulted in a total of 4857 daily and 268 monthly averaged values cov-ering the 22 AERONET stations that had data available in the observation period considered, the location of which are indicated in Fig. 1. Table 1 summarizes the observational statistics for each month. It is clear that August and Septem-ber contain the greatest numSeptem-ber of observations. This is a result of some temporary stations only taking measurements
during the intensive Southern African Regional Science Ini-tiative (SAFARI 2000) field campaign. The spatial distribu-tion of observadistribu-tions is poorest for April, with only 6 stadistribu-tions included in the climatology.
To allow for a direct comparison with the GCM re-sults, a third order polynomial fit is used to interpolate the AERONET data to a wavelength of 0.55 µm from the re-ported wavelengths of 0.34, 0.38, 0.44, 0.50, 0.67, 0.87, and 1.02 µm. For all months and stations, the coefficient of
de-termination (R2) for the fit exceeded 0.95. Figure 2 shows
from the six AERONET stations that have data for at least 11 months of the year, with the GCM data in the grid box co-incident with each station. The AERONET data at Ascen-sion Island, some 2500 km off the coast of southern Africa, has a peak in August, indicating that significant amounts of biomass burning aerosol are transported large distances over the southern Atlantic Ocean during the dry season, as was measured onboard the Met Office C-130 aircraft during SAFARI 2000 (Haywood et al., 2003a). The other stations on the southern African continent show large increases in
τλ=0.55 µmfrom the background values for the period of
Au-gust to October when biomass burning is prevalent. It is clear
that the GCM results severely under predict the τλ=0.55 µmat
all stations, especially in the dry season. The model also ap-pears to initiate the biomass burning season in May to June, whereas the observations suggest it occurs closer to July. Satellite derived burned area maps also suggest that July is more appropriate for the areas where the continental based AERONET stations used in this study are located, although areas to the north and west of the AERONET sites are subject to burning from May onwards (Barbosa et al., 1999).
In order to quantify the underestimation in the model op-tical depth, a correction factor specific to each month is
de-rived from a linear fit of the GCM τλ=0.55 µmto that measured
at the AERONET stations using all of the data in the clima-tology. Table 1 lists the correction factors for each month. The model appears to predict the column integrated optical depth to within ±10% in the months of June and July, al-though this may be due to the early initiation of the biomass burning cycle. During the burning season the model under
predicts the τλ=0.55 µm by a factor of 1.8 to 3.4, with the
largest error in September and October. Figure 2 also in-cludes the GCM data multiplied by the derived correction factors and the MODIS satellite data for September. The im-provement in the model data with respect to the AERONET and satellite observations in both the magnitude and the
sea-sonal cycle of τλ=0.55 µmis evident, suggesting that the
cor-rection factors are realistic.
However, to model the radiative impact of the biomass smoke alone, the fraction of aerosol in the column that is attributed to the background aerosol needs to be removed. Following the methodology of Remer et al. (2002a), it is assumed that the GCM of Tegen et al. (1997) models the background aerosol components (sea salt + soil dust + sul-fate) well in the dry season, and that the underestimation in the column integrated optical depth is entirely due to the model producing low amounts of biomass burning aerosol. To compensate for the underestimation of the biomass
burn-ing aerosol τλ=0.55 µmin September (peak of burning season)
the smoke component in the GCM data is boosted by a factor of 4.4 to reach agreement with the AERONET climatology. This translates to a mean and standard deviation column tion of biomass smoke of 84±12%. The derived column frac-tion is in agreement with the C-130 aircraft measurements over the south Atlantic (Osborne et al., 2004). However,
the assumption that the background aerosol is modeled well in the GCM is highly uncertain, especially when the GCM
also underestimates the τλ=0.55 µmin months where biomass
burning is uncommon (e.g. by a factor of 3.1 in February). Until global aerosol models can adequately reproduce ob-served distributions of aerosol, estimating the column con-tribution of aerosol by type is problematic.
2.2.2 MODIS satellite estimate of aerosol optical depth
The monthly mean column integrated aerosol optical depth for September (2000–2003 average) retrieved with the MODIS instrument onboard the Terra satellite and reported in the MOD08 Level-3 global atmospheric product at a wave-length of 0.55 µm, is also used to estimate the spatial distri-bution of the biomass burning aerosol. The monthly aerosol product results from an average of the daily Level-2 MOD04 10×10 km resolution aerosol product aggregated to a spatial
resolution of 1×1◦(King et al., 2003). A brief overview of
the retrieval algorithm is now given.
The underlying assumption in the MODIS aerosol retrieval is that the up-welling reflectance measured at the top of the atmosphere (TOA) is given by the sum of the surface and at-mospheric components in the solar wavelength range. The atmospheric component of reflectance contains information about molecular scattering, clouds, and aerosols. For the aerosol retrieval, cloud pixels are screened out using the MODIS cloud mask (Platnick et al., 2003) and aerosol prop-erties are determined only in clear skies. To remove the sur-face contribution, different procedures are then applied when retrieving aerosol properties over land and ocean as a result of the more complex characteristics of the land surface re-flectance. Over ocean the surface contribution to the TOA reflectance is relatively small and is parameterized in the operational retrieval algorithm (Ichoku et al., 2003). Over land the surface reflectance is estimated using the 2.13 µm channel which is largely transparent to anthropogenic aerosol (large coarse mode particles are likely to degrade the accu-racy). This is then used to estimate the surface reflectance in other channels. However, the empirical relation used to estimate the surface reflectance at other wavelengths is only applicable to dark dense vegetation or dark soils (Kaufman et al., 1997) and aerosol retrievals over bright surfaces such as deserts are not made.
Once the surface characteristics are determined the re-trieval then uses look-up tables based on detailed radiative
transfer calculations that include variable τλ, solar zenith
an-gle (SZA), satellite viewing anan-gles, and various aerosol mod-els to obtain agreement between the measured and modeled reflectances. Nine aerosol models are used in the ocean algo-rithm (4 fine modes, 5 coarse modes) and are not restricted to geographical location (Tanr´e et al., 1997), whereas the op-erational land algorithm contains only 3 aerosol models (2 fine modes, 1 coarse mode), of which an a-priori assump-tion of any fine mode contribuassump-tion is determined solely on
0 0.1 0.2 0.3 0.4 0.5 0.6 0.7
a)
b)
c)
d)
-20 -10 0 10 20 30 40 50 -20 -10 0 10 20 30 40 50 -20 -10 0 10 20 30 40 50 -20 -10 0 10 20 30 40 50 2 -6 -14 -30 -22 2 -6 -14 -30 -22 2 -6 -14 -30 -22 2 -6 -14 -30 -22 Longitude Longitude Longitude Longitude La titude La titude La titude La titudeFig. 3. Monthly mean aerosol optical depth for September at a wavelength of 0.55 µm for (a) OC+BC component in the GCM; (b) OC+BC component in GCM increased by a factor of 4.4 as derived from comparison with AERONET measurements; (c) MODIS total column (2000–2003 average); (d) MODIS data aggregated to the GCM resolution and ×0.84 to estimate the biomass burning aerosol fraction. The MODIS data is linearly interpolated to missing data regions over arid land areas where the surface reflectance exceeds the threshold value required for the aerosol retrieval.
geographical location and season (Kaufman et al., 1997). During the biomass burning season over southern Africa, the aerosol model used assumes a fine fraction single scattering
albedo (ω0λ=0.67 µm) of 0.90. This is in reasonable
agree-ment with the C-130 aircraft measureagree-ments taken in the aged regional haze during SAFARI 2000 (Haywood et al., 2003a), but significantly higher than the measurements taken near source regions (Abel et al., 2003; Haywood et al., 2003a).
The lower ω0near source regions is likely to lead to an
under-estimation in the MODIS retrieved optical depth in southern Africa (Ichoku et al., 2003). However, the prelaunch esti-mates for the retrieval accuracy of 1τ =±0.05±0.05τ at a wavelength of 0.55 µm over ocean (Tanr´e et al., 1997) and
1τλ=±0.05±0.20τλover land (Kaufman et al., 1997) have
been shown to be reasonable (Chu et al., 2002; Remer et al., 2002b).
In constructing the 4 year average MODIS τλ=0.55 µm
dis-tribution for this study, the data was linearly interpolated to “data-missing” regions over land where the surface re-flectance is too high for the retrieval algorithm. The data was then aggregated to the same resolution as the GCM and multiplied by the biomass smoke column fraction of 84%
de-rived in Sect. 2.2.1. As discussed previously, estimating the contribution of biomass smoke is highly problematic and the errors associated with the value of 84% need to be treated as an additional uncertainty in the presented model calculations.
2.2.3 Comparison of the model and MODIS aerosol optical
depth
Figure 3 shows the spatial distribution of the monthly mean
τλ=0.55 µm for September from the a) uncorrected OC+BC
component in the GCM results of Tegen et al. (1997); b) the OC+BC component boosted by the correction factor of 4.4 derived from the comparison with the AERONET cli-matology; c) the MODIS total column integrated value; d) the MODIS data multiplied by 84% to estimate the biomass burning aerosol component and aggregated to the GCM res-olution. The transition between the ocean and land retrievals of aerosol in the monthly mean MODIS data is reasonably consistent even though significant differences exist between the retrieval algorithms over land and ocean.
The under estimation of the aerosol optical depth in the uncorrected GCM data is evident, with values over southern Africa being significantly lower than in the MODIS satellite
Table 2. Optical properties for fresh and aged biomass burning aerosols at selected wavelengths (µm). Aerosol age ω0 g ke(m2g−1) λ=0.45 λ=0.55 λ=0.70 λ=0.45 λ=0.55 λ=0.70 λ=0.45 λ=0.55 λ=0.70 Fresh 0.86 0.84 0.81 0.62 0.56 0.49 3.27 2.22 1.41 Regional haze 0.91 0.89 0.87 0.66 0.60 0.52 4.82 3.37 2.12 1 5 10 15 20 25 30 35 40 45 50 Number of fires (0.5 x 0.5 degrees)
Longitude [degrees East]
La titude [degr ees N or th] -20 -10 0 10 20 30 40 50 -2 -10 -18 -26 -34
Fig. 4. Fire pixels for September (1998–2002 average) retrieved from the VIRS instrument onboard the TRMM satellite. The data has been corrected for multiple satellite overpasses and missing ob-servations (Giglio et al., 2003). The black squares show the grid boxes used in the modeling work in this study where the most fre-quent burning occurs (total fire counts ≥500).
retrieval. This may be the result of an underestimation in the source strength of the biomass burning aerosol, a result that is a common feature in many global aerosol models (Kinne et al., 2003). Furthermore, the emission inventories used in the model are from the early 1980s. Emission strengths may certainly have increased in the years where the satellite data is taken (2000–2003). Deficiencies in how the model transports the aerosol may also contribute to the low optical depths, although such assessments are beyond the scope of this article. Correcting the GCM data with the factor derived from the AERONET climatology brings the spatial pattern into much better agreement with the MODIS distribution. However, whereas there is a single peak off the western coast of southern Africa in the model data, the MODIS data has a secondary peak inland. Over oceanic regions the corrected GCM distribution tends to produce higher values of aerosol optical depth than the remotely sensed data, especially off the eastern coast of Africa. The higher values are likely to
result from the unrealistic humidity dependence in the OC component of the aerosol in the model data. In
calculat-ing the τλ=0.55 µmfrom the model generated columnar mass,
Tegen et al. (1997) use a specific extinction coefficient of OC aerosol that is a factor of 1.7 higher over oceanic regions than over land to account for hygroscopic growth of the aerosol. Recent in-situ measurements from SAFARI 2000 show that biomass burning aerosol is only moderately affected by rel-ative humidity (Magi and Hobbs, 2003), suggesting that the
large increase in τλ=0.55 µmin the model data over oceans is
unrealistic. The sensitivity of the direct radiative effect of the biomass burning aerosol over southern Africa to the two spatial distributions of smoke (Figs. 3b and d) is examined in Sect. 3.1.
2.3 Aerosol optical properties
Mie theory is used to model the wavelength dependent opti-cal properties of the biomass burning aerosol in both source regions that are heavily influenced by fresh smoke, and in the aged regional haze. This is achieved by fitting a series of three log-normals to the aerosol size distribution measured onboard the Met Office C-130 aircraft during the SAFARI 2000 field campaign in a fresh smoke plume (flight a790) and in aged smoke off the coast of Namibia (flight a791) (Haywood et al., 2003a). Suitable refractive indices were
chosen to simulate the single scattering albedo (ω0λ=0.55 µm)
calculated from direct measurements of the aerosol scattering and absorption (Abel et al., 2003; Haywood et al., 2003a). A complex refractive index of 1.54–0.024i and 1.54–0.018i at a wavelength of 0.55 µm is used for the fresh and aged
smoke respectively. A particle density of 1.35 gcm−3is
as-sumed for both the fresh and aged aerosol (Haywood et al., 2003a). Including the optical properties of biomass burn-ing aerosol modeled in this manner into a radiative trans-fer code has been shown to give excellent agreement with independent measurements of the sky radiance (Haywood
et al., 2003b). Table 2 summarizes the modeled ω0,
asym-metry parameter (g), and the specific extinction coefficient
(ke) at selected wavelengths. The wavelength dependence in
ω0of the fresh and aged aerosol is very similar to that
de-rived from AERONET almucantar measurements in regions subject to intense burning and more aged smoke in southern Africa (Eck et al., 2003). The effect of hygroscopic growth
is neglected as the effect on the optical properties is mini-mal (Magi and Hobbs, 2003) at the low relative humidities measured in the biomass burning aerosol plume, and so the measured quasi-dry aerosol optical properties are used.
To identify the most active regions of burning over south-ern Africa, the multi-year active fire data set derived from the Visible and Infrared Scanner (VIRS) instrument on the Trop-ical Rainfall Measuring Mission (TRMM) satellite is used. The strong emission of mid infra-red radiation from fires is exploited to detect a fire from the VIRS instrument, and a de-tailed description of the retrieval algorithm and performance is given in Giglio et al. (2003). Figure 4 shows the mean fire counts for southern Africa in September (1998–2002 aver-age). It is clear that the majority of fire activity in
Septem-ber occurs in a band between latitudes of −2 and −18◦N,
although the east coast of southern Africa undergoes signifi-cant burning at more southerly latitudes. Figure 4 also shows the grid boxes where the total fire count exceeds 500, indi-cating the areas where biomass burning is most prevalent and the optical properties of fresh biomass burning aerosol are likely to dominate over the aged regional haze and should be included in the multi-column radiative transfer model. This is supported by aircraft observations downwind of a biomass fire in southern Africa that show a rapid evolution in the opti-cal properties of the aerosol in the first few hours subsequent to emission (Abel et al., 2003). By the time the aerosol is advected away from the burning region, the optical proper-ties measured in the aged regional haze will be more
suit-able. Further, AERONET measurements of ω0 from
SA-FARI 2000 show values of 0.84 to 0.85 in the areas where local biomass burning is common, with higher values in ar-eas away from the source regions (Eck et al., 2003). It should be noted that the threshold of 500 fires in a grid box to de-fine the areas with greatest fire activity and thus where fresh aerosol properties are used is somewhat arbitrary, especially since the fire count data is likely to underestimate the total number of fires (Giglio et al., 2003). However, the sensi-tivity of the direct radiative effect over southern Africa to variations in the threshold value is investigated in Sect. 3.2.
2.4 Horizontal distribution of cloud
Monthly mean data from the MODIS Terra satellite is em-ployed to include cloud into the multi-column radiative
trans-fer model using the 1×1◦ MOD08 Level-3 global
atmo-spheric product (King et al., 2003; Platnick et al., 2003). Fig-ure 5 shows the horizontal distribution and histograms of the
water cloud optical depth (τcloud) and droplet effective radius
(reff) for September (2000–2003 mean). Also shown are the
water and ice cloud fractions over the southern African re-gion.
The spatial distribution of the water cloud τcloud(Fig. 5a)
shows values ranging from approximately 6–13 off the coast
of Namibia and Angola in September, where values of τcloud
ranging from 1–12 were inferred from the C-130 aircraft
measurements of cloud liquid water path and reff
(Hay-wood et al., 2004). Higher τcloud occurs when cloud forms
over land, although the histogram reveals a peak value of 8 (mean=9, σ =3) over the whole of the southern African
re-gion. The histogram of water cloud reff (Fig. 5b) peaks
at 13 µm (mean=14 µm, σ =3 µm). This value is somewhat higher than that measured on the C-130 aircraft during SA-FARI 2000, with Keil and Haywood (2003) reporting a cloud
top reff of 7.4±3.6 µm, 7.4±3.1 µm, and 7.8±1.1 µm for
three flights off the coast Namibia and Angola. This apparent discrepancy highlights the difficulty in comparing monthly averaged fields from satellite data with point measurements made in situ at a single instant in time. The water cloud frac-tion (Fig. 5c) histogram peaks at 38% (mean=41%, σ =21%), although much larger values in excess of 60–70% can be seen off the coast of Namibia and Angola where a semi-permanent stratocumulus cloud sheet is present. Furthermore, it is clear from the spatial distribution plot that the majority of the land mass in southern Africa is persistently cloud free dur-ing September, with the exception bedur-ing near some coastal areas. The ice cloud fraction (Fig. 5d) shows a very differ-ent distribution to the water cloud. The histogram peaks at 0% (mean=8%, σ =10%). It is clear from the spatial distri-bution that ice cloud is uncommon over the majority of the southern African region in September. For the purpose of this study ice clouds are not included in the multi-column radia-tive transfer model. The presence of high ice clouds would act to reduce the magnitude of the direct radiative effect of any underlying biomass burning aerosol.
The effect of the diurnal variation of cloud amount and op-tical properties in the southern African region in September is also investigated. The majority of this work uses a four year mean cloud field derived from the Terra satellite, the orbit of which passes from North to South across the equa-tor in the morning. The cloud field included in the model is therefore biased towards clouds present during the morn-ing. The recent addition of the MODIS Aqua satellite with an orbit that overpasses the equator from South to North in the afternoon will dramatically increase the ability to moni-tor the daily variability of the atmosphere. Figure 6 shows the percentage change from the Terra (morning overpass)
to Aqua (afternoon overpass) data of τcloud, reff, and
wa-ter cloud fraction for September (2002–2003 average). A positive value represents an increase during the day whilst a negative value represents a decrease. It is clear that the
τcloud and cloud fraction tends to decrease over oceanic
re-gions during the day. This decrease is consistent with visual observations of the stratocumulus cloud sheet off the coast of Namibia and Angola from the C-130 aircraft during SA-FARI 2000. It is also in agreement with ship based obser-vations of marine stratiform clouds (Rozendaal et al., 1995) and is likely a result of the increase in solar heating during the day tending to “burn-off” the low-level cloud (e.g. Johnson
et al., 2004). Over land regions increases in the τcloud and
-20 -10 0 10 20 30 40 50 2 -6 -14 -30 -22 Longitude La titude 0 2 4 6 8 10 12 14 16 18 20
a) Water cloud optical depth
-20 -10 0 10 20 30 40 50 2 -6 -14 -30 -22 Longitude La titude -20 -10 0 10 20 30 40 50 2 -6 -14 -30 -22 La titude Longitude 0 10 20 30 40 50 60 70 80 90 100 -20 -10 0 10 20 30 40 50 2 -6 -14 -30 -22 Longitude La titude 0 5 10 15 20 25 12 10 8 6 4 2 0 5 10 15 20 25 10 8 6 4 2 0 12 10 8 6 4 2 0 0 20 40 60 80 100 0 20 40 60 80 100 60 40 20 0
b) Water cloud effective radius [µm]
c) Water cloud fraction [%]
d) Ice cloud fraction [%]
Fr e quenc y [%] Fr e quenc y [%] Fr e quenc y [%] Fr e quenc y [%] 0 2 4 6 8 10 12 14 16 18 20 0 10 20 30 40 50 60 70 80 90 100
Fig. 5. MODIS Terra cloud products over southern Africa at 1×1◦resolution for September (2000–2003 average). The spatial distribution and histograms are shown for (a) water cloud optical depth; (b) water cloud droplet effective radius [µm]; (c) water cloud fraction [%]; (d) ice cloud fraction [%]. The cloud optical depth and effective particle radius are averaged over data points where the water cloud fraction is greater than 0%.
Water cloud optical depth Water cloud effective radius Water cloud fraction
-70 -60 -50 -40 -30 -20 -10 0 10 20 30 40 50 60 70
Percentage change from TERRA (am) to AQUA (pm)
Fig. 6. The diurnal cycle of water cloud properties from the MODIS Terra (morning) and Aqua (afternoon) measurements in September (2002–2003 average). Positive values indicate an increase from morning to afternoon and negative values a decrease.
the result of an increase in convective activity. Differences
between the Terra and Aqua measurements of reff are fairly
small over both land and oceanic regions. To test the im-pact of the cloud diurnal cycle on the direct radiative effect of the biomass smoke, model runs are also performed using the two year mean cloud field derived from the Aqua satellite in Sect. 3.3.
2.5 Vertical distribution of aerosol and cloud
The typical vertical profiles of biomass burning aerosol and cloud measured on the C-130 aircraft during SAFARI 2000 were included in the radiative transfer model. The measure-ments show that the aerosol tended to be well mixed in the continental boundary layer over land (altitudes <4.5 km) due to strong dry convection (Haywood et al., 2003a,b), whereas over oceanic regions the aerosol existed in an elevated pol-luted layer (approximately 1.5–5.5 km above sea level) above a shallow marine boundary layer (MBL) (Keil and Haywood, 2003; Haywood et al., 2004). Similar vertical structures of biomass burning aerosol over land and oceanic regions have been measured with other instrument platforms in the south-ern African region (Anderson et al., 1996; Kaufman et al., 2003; Magi et al., 2003; Schmid et al., 2003). The aircraft measurements show that over oceanic regions the low-level cloud tends to form at the top of the MBL below the elevated biomass plume (Haywood et al., 2004). Over land the cloud was observed to form at the top of the continental boundary layer. Aerosol particles and cloud droplets are assumed to be externally mixed when they exist in the same model layer and changes in the aerosol optical properties with adsorption of water or any aerosol indirect effect on the cloud properties is neglected. In Sect. 3.4 the impact of changing the vertical profile on the direct radiative effect of the biomass smoke is investigated.
2.6 Surface albedo
Determination of the magnitude and sign of the direct radia-tive effect of aerosols on climate is highly sensiradia-tive to the pre-scribed surface albedo (e.g. Haywood and Shine, 1995; Ross et al., 1998; Myhre et al., 2003). A large number of GCMs currently adopt a land cover classification scheme for the pa-rameterization of the surface albedo, which in turn requires an accurate representation of the soil and vegetation system (e.g. Sellers et al., 1996). However, recent advances in satel-lite based retrievals allow a long term consistent global and high spatial resolution data set of surface albedo to be de-rived. In this study, the sensitivity of the direct radiative ef-fect of southern African biomass burning aerosol to the sur-face albedo derived from the Advanced Very High Resolu-tion Radiometer (AVHRR) and MODIS satellites is investi-gated.
Both the AVHRR and MODIS satellites follow a similar methodology to convert the measured clear-sky up-welling reflectances at the TOA to a land surface albedo. The method involves converting the measured directional reflectances to a hemispheric albedo by utilizing models of the land bidi-rectional reflectance functions, an atmospheric correction to account for aerosol and water vapour effects, and a narrow to broadband spectral conversion.
The current operational MODIS surface albedo algorithm is discussed in detail in Jin et al. (2003a,b). The retrieval out-puts seven spectral narrowband albedos (λ=470, 555, 648, 858, 1240, and 2130 nm) and three broadband albedos, one in the visible (0.3–0.7 µm), one in the near infra-red (0.7– 5.0 µm), and one covering both the visible and near infra-red range (0.3–5.0 µm). Furthermore, both black-sky and white-sky albedos are reported at each spectral resolution. The black-sky albedo refers to the case where the surface is only illuminated by the direct component of the radiation whereas the illuminating radiation field in the white-sky albedo repre-sents the diffuse component. These are both intrinsic albedos that depend on the reflectance properties of the surface. The
0 2 4 6 8 10 12 14 16 18 20 22 24
MODIS black-sky albedo (%)
b)
-20 -10 0 10 20 30 40 50
Longitude [degrees East]
-2 -10 -18 -26 -34 La titude [degr ees N or th] a) -20 -10 0 10 20 30 40 50
Longitude [degrees East]
-2 -10 -18 -26 -34 La titude [degr ees N or th] 0 2 4 6 8 10 12 14 16 18 20 22 24 AVHRR albedo (%)
Fig. 7. (a) MODIS black-sky albedo (0.3–5.0 µm) at 0.25◦resolution for the period 14–29 September 2001 and (b) AVHRR albedo (0.35– 3.0 µm) at 0.25◦resolution for September averaged over a five year period (1985–1987, 1989–1990). White pixels over land regions in the MODIS data set represents missing data values.
MODIS black-sky (Sept 14-29 2001) MODIS white-sky (Sept 14-29 2001) AVHRR (Sept 1985 - 1990) 0 10 20 30 40 30 20 10 0
Land surface albedo (%)
Fr
e
quenc
y [%]
Fig. 8. Histograms of land surface albedo at 0.25◦resolution for southern Africa for the MODIS black and white-sky (0.3–5.0 µm), and AVHRR (0.35–3.0 µm) albedo retrievals. The bin size in the histogram is 1.2%.
actual albedo that occurs in nature is a combination of the two and is dependent on the atmospheric illumination con-ditions. At the time of this study a long term data set of the MODIS surface albedo product was not available and so the
0.25◦ resolution MOD43 16 day average product covering
the period from 14–29 September 2001 is used. However, in-clusion of the MODIS data into the radiative transfer model allows the effect that the increase in spectral complexity of the surface has on the radiative impact of the biomass burn-ing aerosols to be investigated.
A detailed description of the AVHRR retrieval is given by Gutman et al. (1995) and Csiszar and Gutman (1999). The data set used in this study reports five year averaged values (September 1985–1987, 1989–1990), and contains the direct component of the albedo (similar to the MODIS black-sky albedo) in a broadband covering the spectral range 0.35–
3.0 µm at a resolution of 0.25◦. A comparison with the
MODIS broadband albedo will give insight into the effect that differences in the two retrievals, and perhaps changes in the surface albedo with time have on the radiative transfer calculations.
Figure 7 compares the broadband MODIS black-sky albedo over the southern African region to the broadband AVHRR albedo. Similar spatial patterns in the different re-trievals of the direct component of the land surface albedo are evident. However, significant differences in the two re-trievals can be seen by examination of the histograms in Fig. 8, with the albedo from the MODIS retrieval being larger in general. This is consistent with the results of Jin et al. (2003b), who compare the two albedos over the whole globe and attribute the difference to i) the direct component of the albedo generally being higher as the solar altitude increases due to the reflectance properties of the surface (the MODIS black-sky albedo is normalized to local-solar noon whereas the AVHRR albedo is normalized to an overhead Sun); ii) a possible residual aerosol effect in the AVHRR data due to an underestimation of the aerosol amount in the retrievals atmospheric correction procedure; iii) a change in the land cover from the historical AVHRR data-set to the more re-cent MODIS observations. Differences may also arise from the broadband retrievals of the two satellites covering dif-ferent spectral ranges. The possible explanations are not in-vestigated here, rather it is the resulting uncertainty in the
modeled direct radiative effect to the different satellite re-trievals of surface albedo that is of interest. It is also clear in Fig. 8 that the MODIS white-sky albedo (isotropic illumina-tion) is greater than the MODIS black-sky albedo (direct illu-mination). The higher albedo results from an increase in the path length of a photon through the atmosphere and therefore a greater probability of multiple surface-atmosphere scatter-ing with isotropic illumination compared to direct illumina-tion at local solar noon.
Figure 9 shows the different spectral complexities avail-able in the MODIS retrieval for the model grid box centred at
−22◦N and 20◦E. The seven spectral narrowband retrievals
show that there is an increase in the land surface albedo with
wavelength tov2 µm, highlighting the strong spectral
depen-dence of the land surface reflectance. A 220 band spectral albedo is constructed at each model grid box by perform-ing a quadratic fit to the seven spectral measurements in the wavelength range 0.47–2.13 µm. Outside of the wavelength range covered by the retrieval the albedo is extrapolated at a fixed value. Also indicated are the three different broad-band retrievals. In Sect. 3.5 the effect of including either the broadband (0.3–5.0 µm), the visible (VIS) and near infra-red (NIR) broadbands, or a 220 band spectral albedo to the ra-diative effect of the biomass smoke is explored.
In the radiative transfer model used in this study, both diffuse and direct components of surface albedo can be in-cluded. The ratio of the downwelling direct/diffuse radiation to the total downwelling radiation at the surface in the model is used to weight the individual direct/diffuse albedo com-ponents respectively. The inclusion of cloud or aerosol in the atmospheric column will therefore increase the relative weighting of the diffuse albedo. It should be noted that for the AVHRR albedo only a single direct broadband retrieval is available and so the diffuse component is set equal to the di-rect component. Interpolation to data missing regions in the MODIS data-set over land due to non clear sky conditions is performed before inclusion into the model. Over oceanic re-gions the surface albedo is set equal to 4% at all wavelengths in both data sets and is in agreement with the C-130 aircraft broadband measurements of Glew et al. (2005) for the rele-vant monthly mean solar altitude over southern Africa. The strong SZA dependence of the sea surface reflectance is not accounted for in this study.
3 Results
Base case calculations were performed with both the MODIS and GCM derived distributions of aerosol optical depth. Each model run included the fresh aerosol optical proper-ties at the grid boxes where the total number of fire counts exceeds 500, and aged regional haze optical properties else-where, MODIS broadband (0.3–5.0 µm) direct and diffuse land surface albedo, MODIS water cloud properties and spatial distribution from the Terra satellite, and the vertical
MODIS spectral MODIS broadband (0.3 - 5µm) MODIS broadband (0.7 - 5µm) MODIS broadband (0.3 - 0.7µm) Model spectral (0.2 - 10µm) 0.2 1.0 10 40 30 20 10 0.0 W h it e -sk y sur fac e alb edo (%) Wavelength [µm]
Fig. 9. MODIS white-sky albedo as a function of wavelength for 14–29 September 2001 aggregated to the model resolution (4×5◦) for the grid box centred at −22◦N, 20◦E. Shown are the three broadband retrievals at 0.3–0.7 µm, 0.7–5 µm, 0.3–5 µm, and the spectral dependent albedo derived from seven of the MODIS wave-bands. Also indicated is the spectral albedo included in the model using least squares fitting with a quadratic of the form y=a+bx+cx2 to the spectral measurements at λ=0.47–2.13 µm, and extrapolated at a constant value for wavelengths outside of this range.
profile measured onboard the C-130 aircraft over land and oceanic regions. The horizontal resolution of the model was
set at the resolution of the GCM aerosol data (4x5◦). The
finer resolution of the other data sets were aggregated to the coarser resolution of the GCM. This allowed a direct com-parison of the results from both of the aerosol distributions. At each grid point, the model time-step was set at 1 h and run over a 24 h period for the middle day of September. The incoming insolation at the TOA and SZA used to calculate the fluxes at each time-step are determined using the scheme employed in the Met Office Unified model (Ingram et al., 1997). The output model fluxes are then averaged over the total number of time-steps. Sensitivity tests were performed by running the model for the whole of September (compu-tational time increased ×30), resulting in minor differences (≤1%) in the results presented. In the following analysis, the radiative forcing is defined as the instantaneous change in the net downwelling irradiance caused by the direct aerosol effect.
3.1 Base case: sensitivity to aerosol spatial distribution
Figure 10 shows the radiative forcing at the top of
atmo-sphere (1FT OA) for model runs with clouds not included
(clear-sky) and with the inclusion of clouds (whole-sky) over the southern African region using the base case with the MODIS and GCM derived horizontal distributions of
biomass burning aerosol. The clear-sky 1FT OAis negative
-20 -10 0 10 20 30 40 50 -2 -10 -18 -26 -34
Longitude [degrees East]
La titude [degr ees N or th] -20 -10 0 10 20 30 40 50 -2 -10 -18 -26 -34
Longitude [degrees East]
La titude [degr ees N or th] -45 -40 -35 -30 -25 -20 -15 -10 -5 ∆Fsurface [Wm-2] -14 -12 -10 -8 -6 -4 -2 0 2 4 6 8 10 ∆FTOA [Wm-2] -20 -10 0 10 20 30 40 50 -2 -10 -18 -26 -34
Longitude [degrees East]
La titude [degr ees N or th] -20 -10 0 10 20 30 40 50 -2 -10 -18 -26 -34
Longitude [degrees East]
La titude [degr ees N or th] -20 -10 0 10 20 30 40 50 -2 -10 -18 -26 -34
Longitude [degrees East]
La titude [degr ees N or th] -20 -10 0 10 20 30 40 50 -2 -10 -18 -26 -34
Longitude [degrees East]
La
titude [degr
ees N
or
th]
i) Biomass burning aerosol = MODIS distribution
ii) Biomass burning aerosol = GCM distribution
Clear - sky TOA Whole - sky TOA Whole - sky SURFACE
Clear - sky TOA Whole - sky TOA Whole - sky SURFACE
-14 -12 -10 -8 -6 -4 -2 0 2 4 6 8 10 ∆FTOA [Wm-2] -14 -12 -10 -8 -6 -4 -2 0 2 4 6 8 10 ∆FTOA [Wm-2] -14 -12 -10 -8 -6 -4 -2 0 2 4 6 8 10 ∆FTOA [Wm-2] -45 -40 -35 -30 -25 -20 -15 -10 -5 ∆Fsurface [Wm-2]
Fig. 10. Radiative impact over the southern African region in September using the base case with the biomass burning aerosol spatial distribution derived i) from the MODIS satellite aggregated to a resolution of 4×5◦, and ii) from the corrected model results of Tegen et al. (1997) at 4×5◦. Panels show 1FT OAunder clear-sky conditions; 1FT OAwith clouds included (whole-sky); 1Fsurf acewith clouds
included (whole-sky). The dashed line indicates the transition between positive and negative radiative forcing. The color scale changes between the 1FT OAand 1Fsurf aceplots.
optical depth distribution included in the model, with the ex-ception over the semi-arid regions to the south where the higher surface reflectance reduces the net outgoing flux at the TOA compared to areas with a lower surface albedo. The
whole-sky model runs show a positive 1FT OAoff the coast
of Namibia and Angola where the partially absorbing aerosol overlies low-level cloud and is negative elsewhere. The re-gion of positive forcing is in agreement with that predicted from the calculations of Keil and Haywood (2003). Also shown in Fig. 10 is the whole-sky radiative forcing at the
surface (1Fsurf ace), with large negative values evident over
the whole of the southern African region.
Table 3 shows the average 1FT OAand 1Fsurf aceacross
the whole region, and the associated range in the grid box values of the radiative forcing, diagnosed from the
differ-ent spatial distributions of biomass smoke. The average
clear-sky 1FT OAvaried between −7.6 to −9.1 Wm−2, and
the 1Fsurf acefrom −18.1 to −21.4 Wm−2for the different
aerosol distributions. In the absence of clouds the radiative
impact at the surface is approximately 2.4 times greater com-pared to at the TOA. This ratio compares favourably with
the results of Ichoku et al. (2003) (1FT OA=−10 Wm−2,
1Fsurf ace=−26 Wm−2), who use the MODIS aerosol
opti-cal depth data for September 2000 to determine the clear-sky forcing due to southern African biomass smoke over the At-lantic Ocean, and is also typical of studies over the Indian Ocean region (Satheesh and Ramanathan, 2000).
The average 1FT OA for whole-sky conditions ranges
from −3.1 to −3.6 Wm−2, and the 1F
surf ace from −14.4
to −17.0 Wm−2depending on the aerosol distribution used,
with the strongest radiative impact from the GCM derived optical depth. By comparing the clear-sky to the whole-sky runs it is clear that clouds reduce the direct radiative impact of biomass burning aerosol in the southern African region during September by a factor of approximately 2.5 at the TOA and 1.3 at the surface. The magnitude of the forcing is approximately 4.6 times greater at the surface compared to the TOA in the whole-sky runs. This is a direct consequence
Table 3. September monthly mean surface and top of atmosphere direct radiative effect [Wm−2] over the southern African region. Clear-sky and whole-sky results are shown for model runs including the spatial distribution of biomass smoke derived from the MODIS satellite and from the GCM data at 4×5◦resolution. Also included is the range in the individual grid box values of radiative forcing over the model domain [Wm−2].
Aerosol Clear-sky Whole-sky
distribution 1FT OA Range 1Fsurf ace Range 1FT OA Range 1Fsurf ace Range
MODIS −7.6 −3.2 to −21.6 −18.1 −7.8 to −57.6 −3.1 5.1 to −13.1 −14.4 −5.9 to −43.5 GCM −9.1 −3.2 to −24.4 −21.4 −8.9 to −56.7 −3.6 7.0 to −10.8 −17.0 −6.1 to −39.1
of the large amount of solar radiation absorbed by the aerosol
in the atmosphere which is given by 1FT OA–1Fsurf ace,
re-sulting in average values of 11.3 and 13.4 Wm−2for the two
cases. This is similar to the value of 14±3 Wm−2reported
for the Indian Ocean region during the dry season where large amounts of partially absorbing aerosol are persistent in a heavily polluted haze layer (Ramanathan et al., 2001). The strong reduction in the surface solar radiation (range in the
grid box monthly mean 1Fsurf ace=−5.9 to −43.5 Wm−2)
must be compensated by a decrease in either the surface to at-mosphere latent heat flux due to evaporation or to the sensible heat flux (Ramanathan et al., 2001). Reduction in the evapo-ration is likely to be significant over the oceanic regions and may result in a decrease in precipitation and a general weak-ening of the hydrological cycle over the southern African re-gion. Due to the dry conditions over land in September the reduction in solar radiation is more likely to be compensated by changes in the sensible heat flux. The inclusion of real-istic aerosol and cloud fields as used in this study into more detailed climate models would be needed to ascertain if these processes are likely to occur, and if so, assess the subsequent effect on regional climate.
Model runs were also performed using the uncorrected GCM aerosol distribution. This resulted in a large weakening of the modeled radiative forcing as a result of the large under estimation in the amount of aerosol. The impact was to
re-duce the average whole-sky 1FT OAto −1.0 Wm−2and the
1Fsurf ace to −4.1 Wm−2, corresponding to changes from
the base case of −73% and −76% for the TOA and surface forcings respectively. This highlights the large uncertainties in modeling the impact of aerosols on the climate system when utilizing models that do not simulate the emissions and transport of aerosols correctly.
The input parameters were then varied from the base case, and the sensitivity of the radiative forcing to each parameter determined. Table 4 summarizes the average radiative impact of the aerosol at the TOA and surface, the associated range in the individual grid box values of radiative forcing over the model domain, and the percentage change from the base case for various model runs using the MODIS aerosol distribution,
whilst Fig. 11 shows the spatial distribution of the 1FT OA
for a selection of the model runs. Identical features in the
sensitivity of the radiative forcing were evident in model runs performed using the GCM aerosol distribution.
3.2 Sensitivity to aerosol optical properties
To assess the sensitivity in the radiative impact of the smoke from including one aerosol type in the model (fresh or aged) instead of identifying regions of persistent burning and in-cluding two types as in the base case, model runs were per-formed with the aerosol optical properties measured at the source and in the aged regional haze prescribed to the whole
region. The net regional 1FT OAand 1Fsurf acewere found
to be highly sensitive to the aerosol properties, with differ-ences of 53% at the TOA and 26% at the surface between the fresh and aged aerosol only runs.
However, the spatial pattern in the radiative forcing is very similar between the base and aged aerosol cases (compare Figs. 11a and b), with differences of less than ±3% in the regional forcing at both the TOA and surface. Much larger differences arise from the assumption of fresh aerosol ev-erywhere. Figure 11c shows that the inclusion of the fresh aerosol at all grid boxes results in a larger region of positive
1FT OA over the southern Atlantic Ocean due to the
pres-ence of a more absorbing aerosol overlying the highly reflec-tive cloud layer. This results in a significant weakening in the magnitude of the net regional impact of the biomass smoke at the TOA. In contrast, the excess absorption of the aerosol acts to further reduce the flux reaching the Earth’s surface
and therefore strengthens 1Fsurf acewhen compared to the
base case.
The sensitivity of the direct effect to the threshold value of satellite fire counts used to assign fresh aerosol properties to a grid box is tested by reducing the threshold from 500 (base case) to 300. This increases the surface area of the southern African region covered by fresh biomass smoke in the model from approximately 5 to 9% and results in a small weakening
in the 1FT OAby 2%. This suggests that the added
complex-ity of including both fresh aerosol where burning is prevalent, and aged aerosol properties elsewhere does not significantly
improve the estimation of 1FT OA and 1Fsurf ace on a
re-gional scale compared to when using aged properties every-where (3–5% depending on the threshold value).
Table 4. September monthly mean surface and top of atmosphere direct radiative effect [Wm−2] over southern Africa for a series of models runs that vary the input parameters, using the MODIS derived horizontal distribution of biomass burning aerosol. Also shown is the percentage change from the base case monthly mean value, and the range in the individual grid box values of the radiative forcing [Wm−2] for each model run.
Difference from base case Top of atmosphere Surface
1F Change (%) Range 1F Change (%) Range
None −3.1 N/A 5.1 to −13.1 −14.4 N/A −5.9 to −43.5
Aerosol optical properties
Aged aerosol everywhere −3.2 +3 5.1 to −13.1 −14.1 −2 −5.9 to −41.0
Fresh aerosol everywhere −1.6 −50 12.8 to −10.5 −17.8 +23 −7.5 to −51.3 Fresh aerosol (fire counts ≥300) −3.0 −2 5.1 to −12.1 −14.7 +2 −5.9 to −49.2
Cloud optical properties
Cloud reff + 1 µm everywhere −3.2 +1 4.9 to −13.2 −14.5 <1 −5.9 to −43.6
Cloud reff + 3 µm everywhere −3.3 +4 4.5 to −13.2 −14.5 +1 −6.0 to −43.9
Cloud τcloud/0.9 everywhere −2.9 −8 6.6 to −13.0 −14.2 −1 −5.8 to −42.6
Cloud τcloud/0.7 everywhere −2.3 −26 9.9 to −12.8 −13.7 −5 −5.4 to −40.4
Cloud diurnal cycle
AQUA cloud field −3.6 +14 1.9 to −11.7 −14.7 +2 −6.4 to −44.4
Vertical structure
Aerosol and cloud land profile everywhere −4.8 +53 −2.3 to −13.1 −14.6 +2 −6.0 to −43.5 Aerosol and cloud oceanic profile everywhere −2.1 −32 12.7 to −11.1 −14.2 −2 −5.9 to −40.2
Surface albedo
AVHRR broadband surface albedo −3.2 +3 5.2 to −13.1 −14.5 <1 −5.9 to −43.4 MODIS spectral surface albedo −3.4 +10 5.1 to −14.6 −14.6 +1 −5.9 to −43.9 MODIS VIS and NIR broadband surface albedo −3.5 +12 5.1 to −15.2 −14.7 +2 −5.9 to −44.1
3.3 Sensitivity to cloud optical depth and optical properties
The MODIS satellite measurements of τcloud and reff used
in this study do not include aerosols in the retrieval algo-rithm. Haywood et al. (2004) demonstrate that a potential low bias exists in the MODIS data when biomass burning aerosols overlay low-level clouds, as is the case off the coast of Namibia and Angola. This bias may be as large as −30%
in τcloudand −3 µm in reff depending on the burden and
op-tical properties of the cloud and aerosol, and the wavelengths used in the retrieval. Model runs were performed with the
reff increased by 1 to 3 µm, and the τcloud corrected for a
10% (τcloud/0.9) and a 30% (τcloud/0.7) underestimation in
cloud optical thickness across the whole region in order to assess the impact that any biases have on the radiative forc-ing of the biomass smoke.
Increasing the reff of the MODIS data decreases the cloud
reflectivity. Hence, the radiative impact of the aerosol over land increases as more solar radiation passes through the cloud to the underlying aerosol, and over oceanic regions the positive forcing decreases due to a smaller probability of multiple scattering between the aerosol and cloud (Fig. 11d).
However, the impact on the radiative forcing to the changes
in reff is small in comparison to the other parameters tested,
with a strengthening of the average 1FT OA from 1 to 4%,
and of less than 1 to 1% in the 1Fsurf ace, for an increase
in reff of 1 to 3 µm. An increase in τcloudleads to a greater
probability of a photon being scattered back out of the cloud top, and so the impact on the forcing is of the opposite sign to
an increase in reff. Figure 11e shows that the positive region
of 1FT OAover the southern Atlantic Ocean expands
signif-icantly compared to the base case when compensating for a
30% low bias in τcloud. The net regional effect is to decrease
the average 1FT OA by 8 to 26% when compensating for a
10 to 30% low bias in cloud optical thickness. The sensitivity at the surface is less, with changes ranging from −1 to −5%. The effect of the diurnal cycle of clouds on the direct ra-diative effect of the biomass smoke is investigated by replac-ing the water cloud spatial distribution and optical proper-ties derived from the MODIS Terra satellite (morning over-pass) used in the majority of this study with those derived from the MODIS Aqua satellite (afternoon overpass). Fig-ure 11f shows that the general reduction in both cloud cover
-20 -10 0 10 20 30 40 50 -2 -10 -18 -26 -34
Longitude [degrees East]
La titude [degr ees N or th] -20 -10 0 10 20 30 40 50 -2 -10 -18 -26 -34
Longitude [degrees East]
La titude [degr ees N or th] -20 -10 0 10 20 30 40 50 -2 -10 -18 -26 -34
Longitude [degrees East]
La titude [degr ees N or th] -20 -10 0 10 20 30 40 50 -2 -10 -18 -26 -34
Longitude [degrees East]
La titude [degr ees N or th] -20 -10 0 10 20 30 40 50 -2 -10 -18 -26 -34
Longitude [degrees East]
La titude [degr ees N or th] -20 -10 0 10 20 30 40 50 -2 -10 -18 -26 -34
Longitude [degrees East]
La titude [degr ees N or th] -20 -10 0 10 20 30 40 50 -2 -10 -18 -26 -34
Longitude [degrees East]
La titude [degr ees N or th] -20 -10 0 10 20 30 40 50 -2 -10 -18 -26 -34
Longitude [degrees East]
La titude [degr ees N or th] -14 -12 -10 -8 -6 -4 -2 0 2 4 6 8 10
∆F
TOA[Wm
-2]
a) b) c) d) e) g) h) j) -20 -10 0 10 20 30 40 50 -2 -10 -18 -26 -34Longitude [degrees East]
La titude [degr ees N or th] f ) -20 -10 0 10 20 30 40 50 -2 -10 -18 -26 -34
Longitude [degrees East]
La titude [degr ees N or th] i)
Fig. 11. The direct radiative forc-ing at the top of atmosphere (TOA) for a series of model runs using the spatial distribution of biomass burning aerosol derived from the MODIS satel-lite whilst perturbing other model in-puts. The individual panels represent the (a) base case, (b) aged aerosol op-tical properties everywhere, (c) fresh aerosol optical properties everywhere, (d) cloud reff+3 µm everywhere, (e) cloud τcloud/0.7 everywhere, (f) AQUA
cloud field, (g) oceanic vertical file everywhere, (h) land vertical pro-file everywhere, (i) AVHRR land sur-face albedo, and (j) MODIS derived 220 band spectral land surface albedo.
positive 1FT OAof the overlying biomass smoke. Over land
regions the 1FT OA becomes weaker due to an increase in
cloud at the top of the biomass burning aerosol layer, al-though the impact of the cloud diurnal cycle is weaker than over oceanic regions due to the lower cloud fraction. The net
effect is to increase the 1FT OA by 14%, and by 2% in the
1Fsurf aceacross the southern African region.
3.4 Sensitivity to the vertical structure of aerosol and cloud
The sensitivity to the vertical structure was examined by per-forming calculations with both the oceanic profile (aerosol above cloud level) and the land profile (aerosol in and below cloud level) applied to the whole region.
The average 1FT OAacross the region decreased by 32%
with application of the oceanic vertical structure. Figure 11g shows that this is the result of the region of positive forc-ing off the West coast of southern Africa extendforc-ing into land regions around the coast where cloud is prevalent. The mag-nitude of the forcing is also weakened further inland where the cloud amount is not large enough to result in a positive
1FT OA. Substituting the vertical profile measured over land
to the whole region resulted in an increase in the 1FT OAof
53%. It can be seen in Fig. 11h that the presence of cloud at the top of the aerosol layer eliminates all of the areas of
positive 1FT OA, and so the impact of the biomass burning
aerosol is to increase the outgoing flux at the TOA through-out the sthrough-outhern African region. This unrealistic vertical pro-file over oceanic regions gives similar results regarding the sign of the radiative forcing to the GCM results of Penner et al. (1998), Grant et al. (1999), and Iacobellis et al. (1999), highlighting the importance of accurately representing both aerosol and cloud fields in models when assessing the mag-nitude and sign of the direct aerosol effect at the TOA.
In contrast, the 1Fsurf ace is not sensitive to the vertical
profile, with differences from the base case of ≤2% for both oceanic and land profiles. This is because the down-welling flux at the surface is mainly sensitive to the transmission of the overlying atmosphere which is largely independent on the vertical structure, whereas the fluxes at the TOA are sensitive to the radiation incident on the aerosol layer and the under-lying reflectance. These in turn are highly dependent on the aerosol and cloud profile.
3.5 Sensitivity to the land surface albedo
The inclusion of the AVHRR broad-band land surface albedo
(Fig. 11i) resulted in a strengthening of the 1FT OA by 3%
when compared to the MODIS broad-band albedo used in the base case. This is the result of a lower probability of multiple surface-aerosol scattering due to the less reflective surface, leading to a smaller degree of aerosol absorption. Changes of less than 1% in the radiative impact were evident at the surface.
Application of the more detailed spectrally varying albedo (220 bands) derived from the fit to the seven wavelengths in the MODIS satellite retrieval resulted in a strengthening of
the 1FT OAand the 1Fsurf aceby 10% and 1%, respectively.
This increase is a direct result of the high spectral depen-dence of the aerosol optical properties. Because the land sur-face albedo tends to be lower in the visible wavelength range (where the aerosol extinction coefficient is the largest) than at longer wavelengths, the surface is effectively less reflec-tive than in the broad-band retrieval and therefore leads to less aerosol absorption in the atmosphere and a greater out-going flux at the TOA (see Fig. 11j). This shows that the wavelength dependence of surface albedo plays an important role in determining the radiative impact of aerosols. The in-clusion of the MODIS visible and near infra-red broadband albedo resulted in small differences of less than 2% in the
1FT OA compared to using the more detailed 220 band
ver-sion, suggesting that the simple inclusion of a visible and near infra-red broadband albedo in climate models will im-prove the assessment of any direct aerosol radiative effect when compared to using a single broadband albedo.
4 Conclusions
In this study a multi-column radiative transfer code is used to model the direct radiative effect of biomass burning aerosols over the southern African region during September (peak of burning season). The input parameters included in the model are constrained by a variety of measurements and the most important parameters that need to be targeted by future ob-servations and accurately captured in more detailed climate models are then determined.
The horizontal distribution of biomass burning aerosols were estimated from the GCM model results of Tegen et al. (1997) and from a four year data set of observations from the MODIS Terra satellite. The GCM distribution was found to severely under estimate the column integrated aerosol opti-cal depth when compared to ground based and satellite ob-servations, especially in the dry burning season. This un-der estimation is a common feature of many aerosol mod-els in regions influenced by biomass smoke (Kinne et al., 2003). Correction factors were derived to compensate for the low bias in the model data and back-out the biomass smoke component. Through future multi-model and obser-vational comparisons, improving the quality and thus re-ducing uncertainty in GCM aerosol simulations should be achieved and is a key objective of the AeroCom project (http://nansen.ipsl.jussieu.fr/AEROCOM/). By placing con-straints on the spatial distribution of aerosol derived from ob-servations, the aerosol distribution used in this study is likely to be less uncertain than in previous GCM studies of the ra-diative impact of biomass burning aerosols (e.g. Penner et al., 1998; Iacobellis et al., 1999; Myhre et al., 2003).


![Table 3. September monthly mean surface and top of atmosphere direct radiative effect [Wm −2 ] over the southern African region](https://thumb-eu.123doks.com/thumbv2/123doknet/14657742.553299/14.892.77.830.184.281/table-september-monthly-surface-atmosphere-radiative-southern-african.webp)
