HAL Id: inserm-00107355
https://www.hal.inserm.fr/inserm-00107355
Submitted on 12 Apr 2007HAL is a multi-disciplinary open access
archive for the deposit and dissemination of sci-entific research documents, whether they are pub-lished or not. The documents may come from teaching and research institutions in France or abroad, or from public or private research centers.
L’archive ouverte pluridisciplinaire HAL, est destinée au dépôt et à la diffusion de documents scientifiques de niveau recherche, publiés ou non, émanant des établissements d’enseignement et de recherche français ou étrangers, des laboratoires publics ou privés.
Excess deaths during the August 2003 heat wave in
Paris, France.
Florence Canoui-Poitrine, Emmanuelle Cadot, Alfred Spira
To cite this version:
Florence Canoui-Poitrine, Emmanuelle Cadot, Alfred Spira. Excess deaths during the August 2003 heat wave in Paris, France.: 2003 heat wave excess death risk. Epidemiology and Public Health / Revue d’Epidémiologie et de Santé Publique, Elsevier Masson, 2005, 54 (2), pp.127-35. �10.1019/200601173�. �inserm-00107355�
Excess deaths during the August 2003 heat wave in Paris, France Surmortalité pendant la canicule d’août 2003 à Paris, France
F. Canouï-Poitrine, E. Cadot, A. Spira, Groupe régional Canicule1
Atelier Parisien de Santé Publique/Service de Santé Publique et d’Epidémiologie – Hôpital Bicêtre, 82 rue du Gal Leclerc, 94276 Le Kremlin Bicêtre. Email : cadot@vjf.inserm.fr (Tirés
à part : E. Cadot)
Titre court: 2003 heat wave excess death risk
Correspondence: E. Cadot
Service de Santé Publique et d’Epidémiologie – Hôpital Bicêtre 82, rue du Général Leclerc
94 276 Le Kremlin Bicêtre Cedex Tel: +33 (0)1 45 21 23 42
Fax: +33 (0)1 45 21 20 75
cadot@vjf.inserm.fr
1
I. Gremy, A. Lefranc, P. Pépin : ORS Ile-de-France ; H. Isnard, L. Mandereau-Bruno : CIRE Ile-de-France, InVS.
HAL author manuscript inserm-00107355, version 1
HAL author manuscript
Background: During the August 2003 heat wave in France, almost 15,000 excess deaths were recorded. Paris was severely affected, with an excess death rate of 141%. This study had two aims: to identify individual factors associated with excess deaths during a heat wave in an urban environment and to describe the spatial distribution of deaths within the French capital.
Methods: The study population included all people who died at home between August 1st and 20th, 2003 (N=961). We identified factors associated with excess deaths by comparing the socio-demographic characteristics of the study population with those of people who died at home during the same period in reference years (2000, 2001, 2002) (N=530). Spatial differences were analysed by calculating comparative mortality rates within Paris during August 2003. Mortality ratio was determined to demonstrate temporal variations in mortality between the heat wave period and reference years.
Results: The major factors associated with excess death were: age over 75 years (adjusted OR = 1.44 [1.10-1.90], being female (adjusted OR = 1.43 [1.11-1.83]), not being married (adjusted OR = 1.63 [1.23-2.15]), particularly for men. Being a foreigner appeared to be a protective factor for women. Comparative mortality rates by neighbourhood showed a gradient in excess deaths from north-west to south-east. The mortality ratio was 5.44 [5.10-5.79], with very high rates of excess death in the south (12th, 13th, 14th and 15th arrondissement).
Conclusion: The August 2003 heat wave in Paris was associated with both an exceptional increase in mortality rates and changes in the characteristics of those dying and spatial distribution of mortality. The understanding of the effects of a heat wave on mortality can probably be improved by an analysis of risk at two levels: individual and contextual.
Excess deaths, Paris, heat wave, standardized mortality ratio, mortality ratio.
Position du problème : Durant la canicule du mois d’août 2003 en France, on a enregistré environ 15 000 décès en excès. La ville de Paris a été très affectée, avec une augmentation des décès de 141%. Cette étude a deux objectifs : identifier les facteurs individuels associés à la surmortalité en période caniculaire dans un environnement urbain et décrire la répartition spatiale des décès à Paris.
Méthodes : La population d’étude comprenait toutes les personnes décédées à domicile à Paris entre le 1er et le 20 août 2003 (N=961). Les facteurs associés au risque de décès en excès ont été analysé en comparant les caractéristiques socio-démographiques de la population d’étude avec celles des personnes décédées à domicile durant la même période pendant des années de référence (2000, 2001, 2002) (N=530). Les différences spatiales ont été analysées en calculant la distribution des taux comparatifs de mortalité en août 2003 au sein de la capitale. Le ratio de mortalité a été utilisé pour mettre en évidence les variations temporelles de la mortalité entre la période de canicule et les années de référence.
Résultats : les principaux facteurs de risque de décès en excès étaient : l’âge supérieur à 75 ans (OR ajusté = 1.44 [1.10-1.90], le sexe féminin (OR ajusté = 1.43 [1.11-1.83]), ne pas être marié (OR ajusté = 1.63 [1.23-2.15]), en particulier pour les hommes. La nationalité étrangère semblait être un facteur protecteur pour les femmes. L’analyse comparative des taux de mortalité par arrondissement a fait apparaître un gradient croissant de mortalité du nord-ouest au sud-est. Le ratio de mortalité était de 5.44 [5.10-5.79], avec des taux de surmortalité élevés dans le sud de la ville (12ème, 13ème, 14ème et 15ème arrondissements). Conclusion : La canicule d’août 2003 a été associée, à Paris, à une augmentation exceptionnelle de la mortalité et à des changements des caractéristiques des personnes décédées et de la distribution spatiale de la mortalité. La compréhension de ce phénomène se fonde probablement sur l’analyse d’un double niveau de risque : les niveaux individuel et contextuel.
Décès en excès, Paris, canicule, SMR, ratio de mortalité.
Introduction
During the first two weeks of August 2003, France experienced an exceptionally intense heat wave, with daily temperatures exceeding previously recorded maxima (38.1°C on average from August 4th to 12th in Paris) and the persistence of abnormally high temperatures during the night (mean of 23.4°C for the same period2) [1]. Between August 1st and 20th, a large excess mortality has been reported with almost 14,800 excess deaths registered for whole of France [2]. Excess deaths were heterogeneously distributed over the country and the excess mortality rate was highest in the Ile-de-France region, reaching almost 134% as compared to the three previous years. With 4,867 excess deaths, Ile-de-France accounted for one third (33%) of all excess deaths in France, the city of Paris itself accounting for almost 7.2% of excess deaths (1,067 excess deaths) [2], despite housing only 3.7% of the French population3. In their report, Hémon and Jougla [2] identified several factors associated with excess deaths, including sex, age, degree of urbanisation and duration of exposure to high temperatures. The environment, and particularly the description of locations according to degree of urbanisation, proved to have a major effect: the excess death rate varied from 36% in rural communities to almost 141% in Paris [2].
This study had two aims: to identify individual factors associated with an excess death rate during a heat wave in an urban area and to describe spatial differences in excess deaths within the French capital, at the scale of the arrondissement4.
Materials and Methods
Mortality data concern deaths registered during the August 2003 heat wave and during the same period of the three preceding years (2000, 2001 and 2002). The Centre d’Epidémiologie sur les Causes médicales de décès (Cépi-Dc) of INSERM provided mortality data. For each individual who died, data are available concerning age, sex, place of residence, place of death, marital status, nationality and type of occupational activity. For Paris, the information concerning place of residence of the deceased person corresponds to the arrondissement in which they lived. We analysed data for the subpopulation of Parisian residents who died at home, corresponding to an homogeneous population, regarding location of residence.
2
Equivalent to an increase of 3.5°C over mean minimum temperatures calculated based on observations between 1950 and 1980.
3
General Population Census, 1999.
4
There are 20 administrative districts (arrondissements) in Paris, ranging from 16,000 to 225,000 population size.
An analysis of the sociodemographic factors associated with excess death was carried out, comparing the characteristics of people who died between August 1st and 20th 2003 with those who died between August 1st and 20th during reference years. We used these controls in order to identify factors associated with risk of excess death in 2003 compared to years without heat wave. The sociodemographic characteristics studied were age, sex, marital status (married, single, divorced, widowed), nationality (French or other) and professional activity status (active, inactive or retired). The extent of association between a studied factor and excess death was quantified by calculating odds ratios (OR). The two groups of individuals were first compared by univariate methods, then by a logistic regression model including all socio-demographic variables. We stratified for sex to determine with more details the role of the variable “marital status” in the various categories of the population. These analyses were performed with Stata 8.0 ™ software.
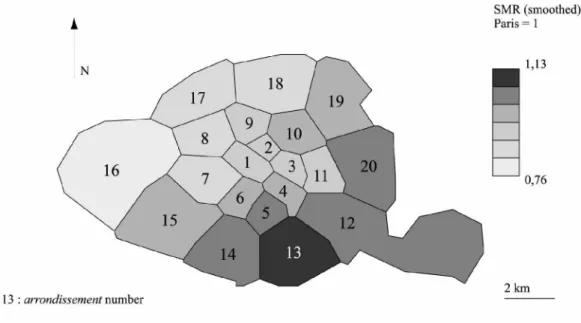
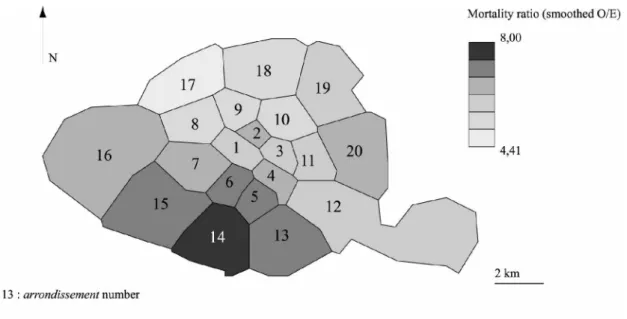
Analysis of spatial differences in excess death rates in Paris was based on two indicators, describing spatial variation of mortality by arrondissement and between 2003 and the reference years. The first indicator, the standardized mortality ratio (SMR), is the ratio of the number of observed deaths to the number of expected deaths for the arrondissement concerned, calculated by applying indirect standardisation method to sex and age (the population of Paris is the reference population and the mortality rates according to age and sex are calculated on the deaths observed in 2003 and the 1999 census population). This method of standardisation, also known as indirect mortality standardisation, was preferred to the direct method because being more robust for small samples [3]. SMRs, computed by adjusting the population for age and sex in each arrondissement, demonstrated spatial variations independent of population structure. Variations in mortality were assessed by the analysis of differences from 1, the reference value corresponding to an homogeneous spatial mortality distribution. A significance test for the SMR [4] was carried out with an alpha error risk of 5%. The second indicator used in analysis, the mortality ratio, is the ratio of the number of observed deaths (O) to the number of expected deaths (E), provided by the average of the number of deaths observed in the reference years (2000/2001/2002). This method can be used to determine the number of excess deaths — the increase in the number of deaths with respect to reference situation in the absence of a heat wave.
Maps were produced with Philcarto© software (version 4.36). A smoothing technique was used: for each spatial unit, the average of the indicators value in this unit and the values for
immediately contiguous units (contiguity order 1) was computed and represented. This method emphasizes the mortality and surmortality spatial structures in Paris [5]. The interquartile discretisation method (Q6) used to represent the two indicators results ensured that all maps were comparable [6].
Results
Between August 1st and 20th 2003, 961 people died at home in Paris. Between the 1st and 20th of August in the reference years (2000, 2001, 2002), a total of 530 people died at home in Paris, providing an average of 177 persons per year. The mortality ratio (O/E) was 5.44 [5.10-5.79]: mortality rates were therefore about five times higher in 2003 than in the reference years.
Socio-demographic characteristics of deaths with respect to reference years
Complete sociodemographic data were available for 942 people who died in 2003 and for 521 in the reference years. The heat wave was accompanied by a change in characteristics of people dying at home. In 2003, 77.2% (N=727) of those who died were aged 75 years and over, whereas only 65.8% (N=114.3), on average, of those dying in the reference years belonged to this age group (Table I). The risk of death during heat wave was increased for individuals over the age of 75 years (crude OR =1.75 [1.38-2.22]). After adjustment, advanced age remained strongly associated with excess death, and this association was independent of the other sociodemographic characteristics of the deceased person, with an adjusted OR of 1.44 [1.10-1.90] (Table II).
The proportion of women amongst those dying increased from an average of 53.9% (N=93.7) during reference years to 68.8% (N=648) in 2003. Being female was an independent risk factor for excess death in a period of heat wave compared to the reference years (OR=1.43 [1.11-1.83]).
The proportion of the deceased who were not married (single, divorced or widowed) also increased from 72.3% (N=125.7) in the reference years to 83.4% (N=786) in 2003, and the proportion of the deceased who were married decreased in the same proportion. After adjustment, being not married was associated with an excess risk of death during the heat wave (OR = 1.63 [1.23-2.15]). After stratification for sex, the risk of death increased for non married men, OR = 1.71 [1.20-2.44]. The proportion of non married women who died in 2003
(90.6% N=587), was similar to that in the reference years (87.2% N=81.7) (p=0.12) (Table III).
The proportion of foreigners dying at home in Paris was 7.9% (N=13.7) on average during the reference years and 3.1% (N=29.0) in 2003 (p<0.0001). Being a foreigner therefore appeared to protect against excess risk of death (OR=0.41 [0.25-0.68]) after adjustment. However, there was an interaction between sex and nationality. After taking into account this interaction [Table II], the global protective effect of being a foreigner disappeared. This result suggested that this protective effect of foreign nationality exists for women only.
Spatial variations in mortality and excess mortality
Large differences were observed in SMRs computed by arrondissement of residence in 2003: SMRs values varied from 0.36 [0.11-0.83] to 1.78 [1.47-2.13]. Three arrondissements displayed significantly lower mortality levels (SMR significantly lower than one, the value corresponding to the average mortality rate in Paris): the 4th, 15th and 16th arrondissements.
Three other arrondissements, the 12th, 14th and 20th, displayed significant excess mortality (SMR > 1). Graphical representation of the data shows a gradient of excess deaths increasing from the north-west to the south-east (Figure 1).
In reference years, smaller differences in SMRs were observed between arrondissements: values ranged from 0.56 [0.06-2.04] to 1.52 [0.94-2.33]. None of the mortality rates of single
arrondissements differed from the mean for Paris (i.e. none differed significantly from 1).
However, the weakest SMR was observed in the 15tharrondissement (p=0.11) and the highest
in the 20th arrondissement (p=0.07). The graphical representation of these data showed a
gradient of mortality with relatively few deaths in the south-west of the capital and a zone of excess deaths in the north-east (Figure 2).
Mortality ratios (O/E) by arrondissement varied from 3.0 to 14.2. All the arrondissements suffered excess deaths, with this ratio significantly greater than one. However, excess mortality rates were higher in the south, affecting primarily the 12th, 13th, 14th and 15th
arrondissements (Figure 3).
Discussion
The summer 2003 heat wave affected several countries in Europe and, in France, caused a public health catastrophe unprecedented in peace-time [2]. Paris was severely affected. In this study, we identified the sociodemographic factors associated with excess mortality in an urban environment. We then described precisely differences in excess mortality between
arrondissements, for spatial and temporal comparisons.
Death certificates were collected exhaustively by INSERM and INSEE, excluding the possibility of bias due to non-exhaustivity of data. The study population comprised all individuals who died at home in Paris during the heat wave in 2003, and all the individuals who died at home during the corresponding period in the reference years.
This study is original in that it attempts to identify individual and contextual factors specifically associated with excess mortality, as opposed to overall mortality. This aim led us to compare the population of individuals dying during the heat wave with those dying during a reference period. The study focused on deaths occurring between August 1st and 20th 2003, the time interval over which excess deaths were recorded; after August 19th, mortality levels decreased to normal levels [2].
The method used for the computation of excess mortality (O/E) was selected based on the conclusions of the “Hémon-Jougla” report, which described this method as the most reliable for the quantification of excess mortality associated with heat waves [2]. This method assumes that Parisian population was stable between 2000 and 2003, both demographically and in terms of general health. The stability of the people deceased was verified for Paris: there was no significant difference in the distribution by age, sex, marital status, nationality and activity status between the people who died in 2000, 2001 and 2002, considered as the reference years.
In this study, we first analysed the association between sociodemographic factors and excess deaths at home. The role of advanced age — already demonstrated in previous studies [7] — was confirmed in this study. Being female also seemed to be strongly associated with risk of excess mortality during a heat wave. The effect of sex on mortality rates during heat waves remains unclear. More excess deaths have been reported among women in recent heat waves in Europe [8], whereas excess deaths among men were reported during a heat wave in Chicago in 1995 [9]. A British group recently demonstrated a higher risk of death among
women during winter periods than in other periods of the year [10]. An apparently poorer adaptation of women to extreme variations in temperature requires confirmation.
Not being married (marital status) was identified as a major risk factor of excess mortality in Paris. This characteristic constituted only an approximation of living alone. In studies performed during the 1995 and 1999 heat waves in Chicago, living alone was also mentioned as a risk factor for mortality [11-12]. Despite different designs, these two studies, as ours, underline the role of social isolation as a major risk factor of excess death during heat waves. The proportion of the deceased in 2003 who were not of French nationality was lower than that in the reference years. The finding that being a foreigner protects against the excess risk of death during a heat wave requires confirmation in other studies because of the small size of the group of foreign people especially for the reference years. However, it may be that foreign communities display greater solidarity towards the elderly than the native French population [13].
In the analysis of individual risk factors, health condition of the deceased at the time of death is not taken into account and could be regarded as one of the limitations of this study. In particular, there is no consideration of their level of dependence, their morbidity, their consumption of drugs and the medical causes of their death, or of individual environmental factors (air conditioning, accommodation at the top of a building, exposure of the building, presence or absence of shutters).The case-control study carried out by the Institut de Veille
Sanitaire on risk factors of the elderly living at home during the 2003 heatwave showed that
the risk of death was significantly increased for the dependent people, those who had cardiovascular or neurological pathologies and those living on the last floor [14].
In 2003, SMRs values revealed a gradient of mortality with excess deaths occurring primarily in the Southern arrondissements of Paris. For the reference years, the spatial differences identified emphasize a different gradient, with the highest levels of mortality observed in the Eastern Parisian arrondissements. We therefore observed a shift in excess mortality towards the South in August 2003. The mortality ratio (O/E) confirmed this tendency.
The longitudinal mortality gradient observed in the reference years constitutes a classic situation which has been described for Ile-de-France as a whole. Two studies carried out at the canton scale — one on deaths in the period 1988-1992 [3] and the other on deaths in the period 1996-1999 [15] — reported similar gradients opposing the south-west of the region (low mortality) with the north-east (high levels of excess mortality with respect to the national average). Despite the absence of significant differences between the reference years SMRs, these former results enable us to affirm the spatial tendency observed in Paris during this time
corresponds to a real situation with a growing gradient of mortality from the south-west to the north-east. No such spatial organisation was observed in previous studies carried out during heat waves, particularly in the USA. In several American towns, including New York and Saint Louis, a centre-periphery gradient has been reported, with much higher levels of mortality in central quarters [16]. This excess mortality, strongly related to housing conditions (old, degraded, insalubrious etc.), also appears to be strongly correlated with socio-economic level of the population, as shown by Klinenberg in Chicago [17]. This spatial structure reflects the socio-economic organisation of American towns, which frequently follows the centre-periphery model. It is not necessarily relevant to European conurbations, which tend to have a more complex spatial organisation. Although the spatial organisation of mortality in reference years differs in Paris and American cities, it is nonetheless based on the socio-economic organisation of the town. The south-west/north-east gradient observed during the reference years coincides with the socio-economic gradient characterised by economically favoured zones in the west and the most deprived zones in the north-east [18]. In 2003, despite a concentration of excess deaths in the South, the persistence of a longitudinal trend (from West to East) in mortality gradient suggests that socio-economic factors continued to have a major influence. The (case-control) study carried out by the Institut de Veille Sanitaire showed also that the low social status represented by the social and professional category was an important individual risk factor of death during the August 2003 heat wave [14]. Socio-economic factors do not constitute only individual risk factors. Their influence can also be contextual: many studies have reported a strong correlation between socio-economic levels of the residence zone of and mortality [19]. However, they probably played a different role during the heat wave, given change in characteristics of people dying. Socio-economic factors may also be closely related to other factors, such as pollution levels (for ozone in particular), or variations in temperature in urban areas (the urban heat island effect), which have already been shown to have an effect during heat waves [20, 21, 22].Our first results of the ecological analysis confirm the important, but different, role of the socio-economic factors during the heat wave and their narrow combination with environmental factors. Moreover, to investigate both contextual and individual risk factors of excess death, we conducted multilevel analysis with geographical nested data at different scales in the town. Once more, these assumptions seem to be confirmed.
Conclusion
During August 2003 heat wave, Paris was the place of a large number of excess deaths at home. Spatial distribution of these excess deaths generated a new map of the capital, suggesting that the heat wave did not simply lead to a temporary increase in mortality. Instead, it seems to have led to changes in the characteristics of dying people. The main individual factors associated with the excess risk of death at home during a heat wave in an urban area were being over the age of 75 years, being female and living alone. These findings reveal two levels of risk — individual and contextual — both of which must be taken into account to understand the effects of a heat wave on mortality and its prevention.
Acknowledgements
We thank E. Jougla and the Cépi-Dc for providing us with all the available data concerning deaths occurring in Paris in August 2003 and during the reference years. This study was made possible by financial support from the City of Paris. We would like to thank the members of the group co-ordinating the epidemiological study of the heat wave in Ile-de-France (I. Gremy, A. Lefrance, P. Pepin from the Ile-de-France Health Observatory, H. Isnard and L. Mandereau-Bruno for the CIRE InVS) for their constructive criticism.
References
1. Météo France. Retour sur la canicule. Dossiers d’actualité (4 septembre 2003).
http://www.meteofrance.com/FR/actus/dossier/archives/canicule2003/dos.htm
2. Hemon D, Jougla E. La canicule du mois d'août 2003 en France. Rev Epidemiol Sante Publique 2004; 52: 3-5.
3. Salem G, Rican S, Jougla E. Atlas de la santé en France. Les causes de décès. Paris, John Libbey Eurotext, 1999; 189p.
4. Breslow NE, Day NE. Statistical methods in cancer research. The design and analysis of cohort studies. IARC Scientific Publications 1987; 82: 406p.
5. Banos A. A propos de l’analyse exploratoire des données. Cybergeo : Revue européenne de géographie 18/10/2001 ; 197 : 15 p. (http://193.55.107.45/modelis/banos/article.htm)
6. Rican S. La cartographie des données épidémiologiques. Les principales méthodes de discrétisation et leur importance dans la représentation cartographique. Cah Santé 1998 ; 8 : 461-470.
7. Basu R, Samet JM. Relation between elevated temperature and mortality: a review of the epidemiologic evidence. Epidemiologic Rev 2002 ; 24: 190-202.
8. Diaz J, Garcia R, Velasquez de Castro F, Hernandez E, Lopez C, Otero A. Effects of extremely hot days on people older than 65 years in Seville (Spain) from 1986 to 1997. Int J Biometeorol 2002; 46: 145-49.
9. Anonymous. Heat-Related Mortality, Chicago, July 1995. MMWR 1995; 4(31): 577-579. (http://www.cdc.gov/mmwr/preview/mmwrhtml/00038443.htm)
10. Wilkinson P, Pattenden S, Armstrong B. Vulnerability to winter mortality in elderly people in Britain: population-based study. BMJ 2004 ; 329: 647-52.
11. Semenza JC, Falter KH, Selanikio JD, Flanders WD, House HL, Wilhelm JL. Heat-related deaths during the July 1995 heat wave in Chicago. N Engl J Med 1996; 335: 84-90.
12. Naughton MP, Henderson A, Mirabelli MC, Kaiser R, Wilhelm JL, Kieszak SM, Rubin CH, McGeehin MA. Heat-related mortality during a 1999 heat wave in Chicago. Am J Prev Med 2002; 22: 328-29.
13. Palloni A, Arias E. Paradox lost : explaining the hispanic adlult mortality advantage. Demography 2004; 41: 385-415.
14. InVS. Etude des facteurs de risque de décès des personnes âgées résidant à domicile
durant la vague de chaleur d’août 2003. Paris, INVS ; 165p.
15. ORS. Panorama de la santé en Ile-de-France. Paris, ORS, 2003 ; 202p
16. Besancenot JP. Vagues de chaleur et mortalité dans les grandes agglomérations urbaines.
Environnement, Risques et Santé 2002 ; 1(4):229-40.
17. Klinenberg E. A social autopsy of disaster in Chicago. Chicago, The University of
Chicago Press 2002; 305p.
18. Pinçon M, Pinçon-Charlot M. Sociologie de Paris. Paris, La Découverte 2004; 121p.
19. Pickett KE, Pearl M. Multilevel analyses of neighbourhood socioeconomic context and
health outcome: a critical review. J Epidemiol Community Health 2001; 55(2): 111-1222.
20. Clarke JF. Some effects of the urban structure on heat morality. Environ Res 1972; 5:
93-104.
21. Buechley RW, Van Bruggen J, Truppi LE. Heat island equals death island? Environ Res 1972 ; 5 : 85-92.
22. InVS. Vague de chaleur de l’été 2003 : relations entre température, pollution atmosphérique et mortalité dans 9 villes françaises. Paris, INVS ; 69p.
Figure 1. Mortality distribution in Paris in August 2003
Figure 2. Mortality distribution in Paris in the reference years
Figure 3. Distribution of excess deaths in Paris in August 2003
Table I: Characteristics of the individuals who died at home in Paris in 2003/2000-2001-2002 Deaths expected(a) N(%) Deaths observed N(%) Crude OR [95% CI] Age group >75 59,4 (34,2) 215 (22,8) 1 >=75 114,3 (65,8) 727 (77,2) 1,75 [1,38-2,22] Sex Men 80 (46,1) 294 (31,2) 1 Women 93,7 (53,9) 648 (68,8) 1,88[1,51-2,35] Marital Status Married 48 (27,6) 156 (16,6) 1
Not Married(b) 125,7 (72,4) 786 (83,4) 1,92[1,49-2,49] Nationality French 160 (92,1) 913 (96,9) 1
Foreign 13,7 (7,9) 29 (3,1) 0,37[0,23-0,61] Activity status Active 26,3 (15,1) 98 (10,4) 1
Retired or inactive 147,4 (84,9) 844 (89,6) 1,54[1,12-2,11] Total 173,7(100,0) 942 (100,0)
(a)
mean of number of deaths in reference years (2000-2001-2002)
(b)
single, divorced or widowed
Table II: Characteristics of the individuals who died at home in Paris in 2003/2000-2001-2002
adjusted OR(a) [95% CI] Model 1 Model 2(b)
Age group >75 1 1
>=75 1,44 [1,10-1,90] 1,46[1,11-1,92]
Sex Men 1 1
Women 1,43 [1,11-1,83] 1,50[1,16-1,94]
Marital Status Married 1 1
Not Married(c) 1,63 [1,23-2,15] 1,65[1,25-2,17]
Nationality French 1 1
Foreign 0,41[0,25-0,68] Men : 0,69[0,34-1,38] _ Women : 0,25[0,12-0,50]
Activity status Active 1 1
Retired or inactive 1,10[0,77-1,58] 1,07[0,75-1,54] (a)
variables : age, sex, marital status, nationality, activity
(b)
with an interaction term sex*nationality
(c)
single, divorced or widowed
Table III: Excess mortality as a function of marital status, by sex, in Paris in 2003/2000-01-02
Deaths expected(a) N(%) Deaths observed N(%) OR [95% CI] Men Married 36 (45,0) 95 (32,3) 1 Not married(b) 44 (55,0) 199 (67,7) 1,71[1,20-2,44] Total 80 (100,0) 294 (100,0) Women Married 12 (12,8) 61(9,4) 1 Not married(b) 81,7 (87,2) 587 (90,6) 1,41[0,91-2,19] Total 93,7 (100) 648 (100,0) (a)
mean of number of deaths in reference years (2000-2001-2002)
(b)
single, divorced or widowed
![Table II: Characteristics of the individuals who died at home in Paris in 2003/2000-2001-2002 adjusted OR (a) [95% CI]](https://thumb-eu.123doks.com/thumbv2/123doknet/14691728.561635/17.892.100.740.690.1012/table-ii-characteristics-individuals-died-home-paris-adjusted.webp)

