HAL Id: hal-00154713
https://hal.archives-ouvertes.fr/hal-00154713
Submitted on 14 Jun 2007HAL is a multi-disciplinary open access
archive for the deposit and dissemination of sci-entific research documents, whether they are pub-lished or not. The documents may come from
L’archive ouverte pluridisciplinaire HAL, est destinée au dépôt et à la diffusion de documents scientifiques de niveau recherche, publiés ou non, émanant des établissements d’enseignement et de
Scintillation of Sol-Gel derived Lutetium orthophosphate
doped with rare earth ions.
Christelle Mansuy, Jean-Marie Nedelec, Christophe Dujardin, Rachid Mahiou
To cite this version:
Christelle Mansuy, Jean-Marie Nedelec, Christophe Dujardin, Rachid Mahiou. Scintillation of Sol-Gel derived Lutetium orthophosphate doped with rare earth ions.. Journal of Sol-Sol-Gel Science and Technology, Springer Verlag, 2006, 38, pp.97-105. �10.1007/s10971-005-5639-9�. �hal-00154713�
Scintillation of Sol-Gel derived Lutetium orthophosphate
doped with rare earth ions.
C. Mansuy
1, J.M. Nedelec
1*, C. Dujardin
2and R. Mahiou
11Laboratoire des Matériaux Inorganiques, CNRS UMR 6002, Université Blaise Pascal et Ecole
Nationale Supérieure de Chimie de Clermont-Ferrand, 63177 Aubière cedex, France
2Laboratoire de Physico-Chimie des Matériaux Luminescents, CNRS UMR 5620 Université
Claude Bernard, 10 rue A.M. Ampère 69622 Villeurbanne Cedex, France.
* Corresponding author : Dr J.M. Nedelec
Laboratoire des Matériaux Inorganiques UMR 6002 Université Blaise Pascal, 24 Avenue des Landais 63 177 Aubière Cedex, FRANCE
Abstract
In this paper, the synthesis, the characterization and the scintillation properties of LuPO4
doped, with several concentrations of Ce3+, Eu3+ and Tb3+ ions, are presented. These materials have been synthesized by sol-gel process. The purity of powders has been verified by X-Ray diffraction and the results confirm the xenotime structure of all the materials. A thermogravimetric analysis allows the obtention of informations on the crystallisation of LuPO4 and the study of its evolution
from the amorphous to crystalline form. The morphology of the powders has been studied by Scanning Electron Microscopy and shows that the powders are constituted of small particles with narrow size distribution. Optical properties have been studied in order to determine the scintillation performances of these materials. The optima are obtained for Ce3+, Eu3+ and Tb3+ concentration of respectively 0.1%, 10% and 5% with high scintillation yields. This study thus confirms the potentialities of these materials as scintillators.
Introduction
Nowadays, research focussed on inorganic scintillators is in constant development. These materials, that convert high energy radiation into UV-Visible light, are used in various applications [1]: medical imaging, high energy physics, airport security and industrial control. For medical imaging applications, the conversion yield of the scintillating materials has to be improved in order to minimize the patient X-rays exposure. The development of materials that present high density are particularly interesting in order to get efficient X-ray absorption.
The sol-gel process seems to be a good solution for the elaboration of scintillating materials. Indeed, the use of molecular precursors in solution confers an important chemical homogeneity to these materials. Moreover, the sol-gel route allows the elaboration of materials of different composition and doped easily with different ions, in various concentration. The sol-gel derived materials are synthesized at lower temperature than the ones elaborated by classical solid state synthesis. This point is economically important and can sometimes lead to new phases.
Because of the required high density, lutetium based oxides materials are very interesting candidates. In order to exhibit luminescence properties, these materials are generally doped with rare earth ions. LuPO4, which is known as an efficient scintillator [2], is the subject of this work and
has been doped with Ce3+, Eu3+ and Tb3+ ions.
The emission of Ce3+ doped scintillator is based upon intense and fast 5d → 4f transitions and occurs in the UV-blue range for which effective detectors are available.
The materials doped with Eu3+ or Tb3+ ions emit in the visible range but with long decay time.
Experimental Section
Materials preparation
Sol-Gel derived samples
In a first step, a mixture of Lutetium and Ln alkoxides (Ln=Eu, Tb or Ce) is prepared by metathesis reaction of lutetium anhydrous chloride with potassium isopropanolate as reported for various metallic alkoxides [3]. All manipulations are carried out under dry argon atmosphere to prevent any influence of air moisture. High purity chlorides (Aldrich) were used; they were dried under vacuum before use to ensure total absence of water. LuCl3 and LnCl3 were mixed together in
anhydrous 2-propanol in required amounts during 2 hours. Potassium isopropoxide was prepared by reacting metallic potassium (Aldrich) with anhydrous 2-propanol (Accros). Anhydrous 2-propanol
was dried and stored over molecular sieve. Lu/Ln chlorides mixture is then reacted with the potassium alcoholate with a K/(Lu+Ln) ratio in slight excess with respect to the stoechiometric K/(Lu+Ln)=3 molar ratio. The mixture was then refluxed for 3 hours t 85°C, white precipitate of KCl appeared rapidly attesting the formation of the Lu/Ln alkoxides. The obtained sol labeled sol 1 is then cooled down to room temperature.
The phosphorus precursor (sol 2) is prepared by reacting anhydrous P2O5 with isopropanol yielding
a mixture of hydroxo alkoxides (O=P(OH)x(OiPr)3-x, x=0,1,2,3).
Sol 1 and sol 2 are then mixed under stirring and immediate precipitation occurs. The mixture was then magnetically stirred for 15 hours at room temperature. The solid is then isolated by centrifugation and elimination of the supernatant and washed thoroughly with deionized water in order to eliminate water soluble KCl. The badly defined amorphous lutetium alkoxo phosphate is dried for about 6 hours at 80°C and the dry xerogel obtained is then fired at 1100 °C for 24 hours. LuPO4 powders doped with Ce3+, Tb3+ and Eu3+ ions have been prepared with an atomic ratio of
0.1, 0.2, 0.3, 0.5 and 1 % for Ce3+, 0.2, 0.5, 1, and 5% for Tb3+ and 0.2, 0.5, 1, 5 and 10 % for Eu3+.
Co-precipitated samples
For sake of comparison, Eu3+ doped LuPO4 samples have been prepared by co-precipitation.
A mixture of Lu2O3 and Eu2O3 is prepared in required amount. A solution of phosphoric acid
(C=0.2 M) is then added to the oxides mixture and refluxed for 15 hours. The resulting white powder is then washed thoroughly with de-ionized water and finally fired in the same conditions than sol-gel derived samples (1100 °C for 24 hours).
Characterization
X-Ray diffraction patterns have been measured for all powders on a Siemens D501 diffractometer working in the Bragg-Brentano configuration with Cu-Kα radiation (λ = 1.5406Ǻ).
Infrared spectra were recorded on a Perkin Elmer 2000 FTIR spectrometer using the KBr pellet technique.
Thermogravimetric analysis were performed using a Metler Toledo 851 apparatus. Samples were heated in air with a rate of 1 °C.min-1.
Micrographs were recorded using a Cambridge StereoScan 360 SEM operating at 20 kV. Samples were prepared by depositing a small quantity of powder on adhesive carbon film before coating the surface with gold.
The excitation spectra of all the powders, doped with Ce3+, Eu3+ or Tb3+, were recorded at room temperature using a Xenon lamp as continuous excitation source and a Triax 320 monochromator coupled with a CCD detector.
The scintillation spectra were recorded with a Jobin-Yvon Triax 320 monochromator coupled with a CCD camera after excitation of the samples with a tungsten X-ray tube working at 35 kV and 15 mA. The signal was collected near the sample with an optical fiber. For relative conversion yield estimation, the samples were placed in a quartz tube with a fixed position throughout the measurements. For measurements of scintillation yields, of Ce3+ or (Eu3+, Tb3+) doped samples, polycristalline BGO or Gd2O2S:Tb3+ powder were respectively used as a standard.
Emission spectra were recorded at room temperature with a single monochromator Jobin Yvon HR 100 spectrometer. For Eu3+, resonant excitation in the 5D0 level was achieved using a
ND62-Continuum dye laser pumped by a frequency doubled pulsed Continuum Surelite I
Nd3+ :YAG laser. A mix of Rhodamine 590 and 610 was used for the dye solution. For Tb3+, a
pulsed nitrogen laser (Jobin Yvon) was used with excitation wavelength λ=337.1 nm.
Time resolved emission was monitored with an EG&G Boxcar and fluorescence lifetimes were measured with a LeCroy 400 MHz oscilloscope.
The afterglow measurements were performed at room temperature on the samples corresponding to concentration optima. The excitation was performed during 10 s with a X-ray source working at 40 kV and 35 mA. Gd2O2S:Tb3+ powder was used as a reference.
Results and Discussion
Characterization
X-Ray Diffraction
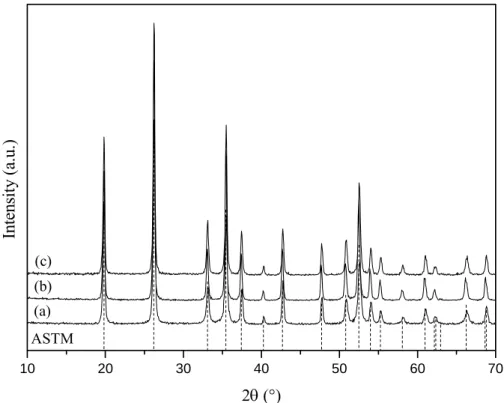
Figure 1 shows the XRD patterns for LuPO4 powders doped with Ce3+, Eu3+ and Tb3+ ions.
Orthophosphates LnPO4 present two crystalline types depending on the nature of Ln3+ cation. In
effect, LuPO4 crystallizes with the xenotime type [4] whereas CePO4 and EuPO4 crystallize with the
monazite type [5]. However the XRD patterns only show the xenotime structure of LuPO4,
confirming the substitution of Lu3+ by Ln3+ (Ln: Ce, Eu or Tb) in solid solution. It is significant to
specify that LuPO4:Ce3+ can be obtained without presence of CePO4 until a maximal Ce
concentration of 1% at. Indeed, the X-ray diffraction pattern of a LuPO4:Ce3+ (2%) powder shows
observed up to 1%, 10% and 5% for respectively cerium, europium and terbium ions. Solid solution limits have not been determined for Eu3+ and Tb3+ doped materials and higher concentration might be possible while keeping the xenotime structure and a monophasic material.
FTIR Spectroscopy
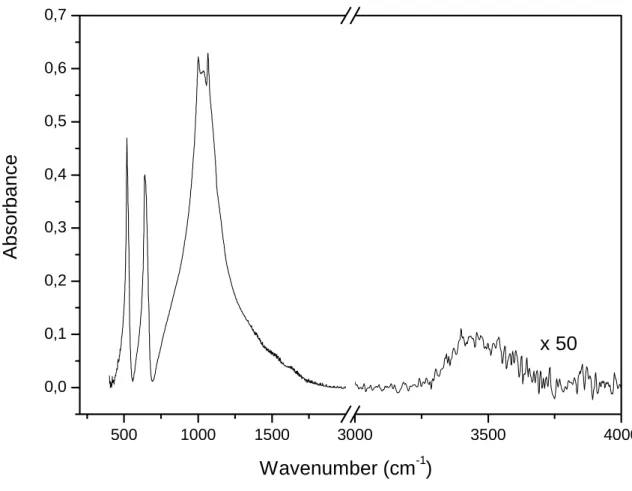
Fourier Transform Infra-Red spectroscopy has been carried out on different samples doped with Ce3+, Eu3+ and Tb3+ ions. All recorded IR spectra are similar, no significant change is observed upon doping with Ce3+, Eu3+ or Tb3+ ions. One of the recorded spectra is displayed in Figure 2. All
the bands, observed in the range 500-1200 cm-1 correspond to (PO4)3- groups present in the
structure. The bands observed between 500 and 640 cm-1 and at about 1000 cm-1 correspond
respectively to bending vibrations δO-P-O and stretching vibrations νP-O [6]. At about 519 cm-1 the
bands relative to stretching vibrations νLu-O can also be observed. The mode observed around 3500
cm-1 corresponds to stretching mode of residual OH groups νO-H. FTIR spectra correspond to a
unique phase identified as LuPO4 regardless of the doping level and the nature of the doping ion.
Residual hydroxyls groups coming from the hydrolysis of alkoxides precursors are observed and will be confirmed by luminescence decay measurements.
Thermal analysis
In order to get informations on the cristallisation of LuPO4, a thermal analysis has been
performed. The evolution from the amorphous to crystalline form is then studied. A
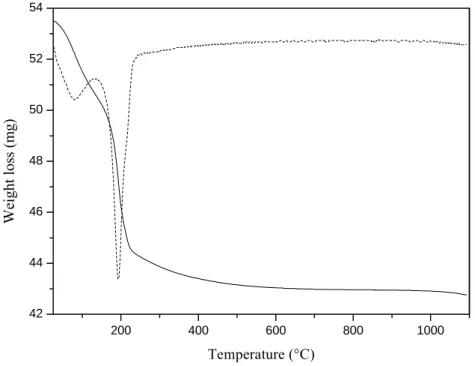
thermogravimetric analysis has been carried out on LuPO4 powder elaborated by sol-gel process
and the resulting thermogramm is presented in Figure 3. The first derivative is also shown in order to clearly identify the temperatures associated with the different weight losses.
A first weight loss is observed around 100°C and can be allotted to the elimination of adsorbed species such as alcohol or water molecules [7]. A second significant weight loss, observed at about 200°C, corresponds to the condensation of the material. There is a condensation of the alkoxy and hydroxy groups with subsequent alcohol or water elimination. Some residual organic compounds can also be directly pyrolyzed. At this temperature, the inorganic skeleton is formed. Total loss of weight is approximately 20%.
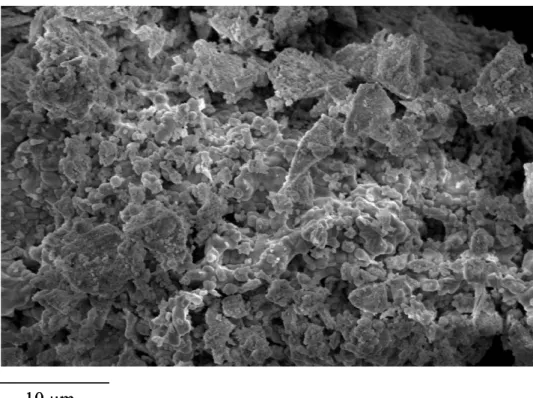
Scanning Electron Microscopy
Scanning Electron Microscopy allows the extraction of informations about the morphology of the powders synthesized by sol-gel process and treated at 1100°C for 24 hours. The images, recorded at 10 000x magnification, are given in Figure 4. The powders are homogeneous and constituted of small spherical particles. The size distribution of these particles is uniform which is a usual consequence of the use of sol-gel process.
Optical properties
Excitation spectra
Figure 5 shows the excitation spectra recorded for Ce3+, Eu3+ and Tb3+ doped LuPO4
powders. The measurements were performed at room temperature by fixing the emission wavelength at 360 nm, 592 nm and 541 nm for respectively LuPO4:Ce3+ (0.5%), LuPO4:Eu3+ (10%)
and LuPO4:Tb3+ (5%). Excitation spectra recorded for other concentrations are identical and are not
presented.
In the case of LuPO4:Ce3+, two main bands are observed which correspond to the transitions
between the 4f level and the excited 5d levels: T2 and E of Ce3+ [8], further splitting of the 5d levels
is not observed probably due to the poor resolution in our room temperature spectra.
The excitation spectrum recorded for LuPO4:Eu3+ is constituted of lines corresponding to
4f-4f transitions. The band observed at about 470 nm is attributed to 7F0 → 5D2 transition and the
ones situated in the range between 300-430 nm correspond to 7F0 → 5F2, 5HJ, 5D4, 5GJ, 5L8,5L6, 5D3
transitions. The excitation band located below 250 nm corresponds to the charge transfer absorption [9].
The excitation bands observed for LuPO4:Tb3+ powder, in the range of 300-400 nm, are
characteristic of 4f-4f transitions. They correspond to 7F6 → 5H6, 5H7, 5L8, 5L9, 5D2, 5G5, 5L10, 5G6
and 5D3 transitions [10].
Emission spectra
The emission spectra have been recorded at room temperature under X-ray excitation for LuPO4 powders doped with different concentrations of Ce3+, Eu3+, Tb3+ ions (Figure 6).
BGO (Bi4Ge3O12) and Gadox (Gd2O2S:Tb) emission spectra have also been recorded in order to
estimate the scintillation yields. BGO and Gadox will respectively allow the scintillation yields measurements of Ce doped materials and Eu and Tb doped materials.
In the case of LuPO4:Ce3+ (Figure 6 (a)), two emission bands characteristic of 5d → 2F5/2
and 5d → 2F
7/2 transitions of Ce3+ can be observed in the region of 300-400 nm. The optimum is
obtained for LuPO4:Ce3+ (0.1%). The Ce3+ doped materials present an emission in the UV-blue
range.
For LuPO4:Eu3+, the emission spectra have been recorded for powders elaborated by sol-gel
process (Figure 6 (b)) and by co-precipitation. The two spectra are similar and constituted of bands corresponding to 5D0 → 7FJ (J = 0-4) transitions of Eu3+ ions. The numbering of the different lines
fairly respect the D2d point group. The spectral distribution of the Eu3+ doped materials results in a
global orange-red emission.
LuPO4:Tb3+ emission spectrum (Figure 6 (c)) exhibits, in the range between 475-650 nm,
several bands characteristic of 5D4 → 7FJ (J = 3-6) transitions of Tb3+ ions. 5D4 → 7F5 transition is the
most intense and confers to the materials a global greenish emission.
Luminescence decays
For practical applications, the lifetime of the emission is a very important parameter. Decay curves have been measured for the optima concentrations. Due to the very short radiative lifetime of Ce3+ (25 ns in LuPO4), the decay curve has not been measured for the Ce3+ doped samples.
The decay curves obtained for the co-precipitated LuPO4:Eu3+ 5 % and for the sol-gel derived
LuPO4:Eu3+ 5 % and LuPO4:Tb3+ 5% samples have been measured. The decays were all fitted with
a single exponential as shown in Figure 7. The lifetimes given on the graph are 3.9 ms, 2.5 ms and
2.5 ms for LuPO4:Eu3+ 5 % co-precipitated, LuPO4:Eu3+ 5 % and LuPO4: Tb3+ 5 % sol-gel
respectively. The shorter radiative lifetime of the sol-gel derived sample as compared to the co-precipitated one is related to higher residual OH concentration in the material prepared by sol-gel
chemistry as observed for YPO4 [11]. The measured lifetimes are fully compatible with
applications.
Scintillation yields
Scintillation yields have been measured for all the powders by comparing the integrating areas of the emission spectra of the sample and the reference (BGO or Gadox). Scintillation yields under γ-rays excitation are respectively 8060 photons/MeV [12] and 78000 photons/Mev [13] for BGO and Gadox. The yields of our materials were calculated from reference values which are obtained under γ-ray excitation. Our measurements have been performed under X-ray excitation, so the results given for the scintillation yields under γ-ray excitation might be under-estimated. The
For Ce3+ doped LuPO4, the optimum is obtained for a Ce concentration of 0.1% with a
scintillation yield of about 10200 photons/MeV. This result is in good agreement with the published
value of 12000 photons/MeV [14]. The scintillation yield of LuPO4:Ce3+ has been improved by
optimizing the Ce concentration. Indeed, recent work [15] presents the scintillation yield of different Ce doped materials and in particular the one of LuPO4:Ce3+ (1%) which was equal to 7400
photons/MeV. This paper [15] also presents results concerning the cerium oxidation state in cerium doped sol-gel derived materials indicating the presence of Ce4+ ions, so this observation can explain the fact that the measured yields are lower than those published in the literature. However, it is always difficult to compare the results obtained on single crystals and on powders. Moreover the results depend strongly on the experimental set-up.
In the case of Eu3+ doped LuPO4 powders, the maximum is obtained for LuPO4:Eu3+ (10%)
when powders are elaborated by sol-gel process. For an europium concentration of 5%, the scintillation yields are respectively about 5400 photons/MeV and 9400 photons/MeV for the material elaborated by sol-gel process and the one synthesized by co-precipitation. We can see that the scintillation yields obtained for the materials synthesized by co-precipitation are higher than those of the corresponding sol-gel derived materials. A possible explanation could be the presence of OH residual groups in the materials prepared by sol-gel route as already postulated from the lifetime measurements and illustrated by FTIR measurements.
Different scintillation yields have been measured for LuPO4:Tb3+, and particularly for Tb3+
concentration varying from 0.2 to 5%. LuPO4:Tb3+ (5%) present the higher scintillation yield since
this one is equal to about 9200 photons/MeV.
Afterglow
The afterglow value is an important characteristic for scintillating materials used in tomography. Indeed, for an application in tomography, the scintillator afterglow should be weak because a lot of images are recorded successively in a short time.
The afterglow behaviours for Ce3+, Eu3+ and Tb3+ doped LuPO4 powders are presented in
Figure 9. The afterglow of Gadox (Gd2O2S:Tb) was also measured as a reference. The materials
present an afterglow of 0.9%, 0.35%, 2.5% and 0.007% at 1 s after X-rays turn-off, for LuPO4:Ce3+
(0.1%), LuPO4:Tb3+ (5%), LuPO4:Eu3+ (10%) elaborated by sol-gel process and Gadox
respectively. The relatively high afterglow of Eu3+ doped samples could be restrictive for practical applications. LuPO4:Eu3+ (5%) synthesized by co-precipitation present an afterglow equal to 1% at
Conclusion
The sol-gel process is a good technique which allows the elaboration of scintillating LuPO4
powders doped with different rare earth ions. These sol-gel derived powders present good cristallinity and purity, a homogeneous distribution of the particles and a controlled morphology. The scintillating properties of Ce3+, Eu3+ or Tb3+ doped LuPO4 powders were studied and high
scintillation yields were obtained. These materials appear to be promising scintillators.
The optical properties of the prepared materials are not different from the ones of analogous solid state derived materials. The main advantage of sol-gel chemistry remains the possibility to prepare easily various compositions changing both the nature of the oxide matrix and the rare earth doping ions. The maximum possible concentration of doping ions is always higher for sol-gel derived materials than for the ones derived from solid state reaction and in particular single crystals. In some cases new compositions unreachable by solid state reaction are possible.
Furthermore, the sol-gel process developed in this work will allow the production of these materials as thin films which is a highly desirable configuration for X-ray intensifying screens.
Sol-gel process appears to be a simple and more flexible process for preparing oxides scintillators. In particular, it allows a high output screening of compositions and a high versatility in term of final shape.
Acknowledgments
Financial support from the French FRT under project LuminiX (RNTS-01B262) and from FNS under “ACI Nanostructures” project LuNaTIC (N5501) is acknowledged.
Figures captions
Figure 1: X-Ray diffraction patterns recorded for (a) LuPO4:Ce3+ (1%), (b) LuPO4:Eu3+ (10%) and
(c) LuPO4:Tb3+ (5%) with the corresponding reference patterns (dotted lines)
Figure 2: FTIR spectrum of LuPO4 powder heated at 1100°C for 24 hours
Figure 3: TG curve obtained from LuPO4 powder and first derivative curve (dotted line)
Figure 4: SEM micrographs of LuPO4 powders treated at 1100°C for 24 hours
Figure 5: Excitation spectra of LuPO4:Ce3+, LuPO4:Eu3+ and LuPO4:Tb3+ recorded at room
temperature and respectively at λem = 360 nm, λem = 592 nm and λem = 541 nm
Figure 6: Emission spectra recorded at room temperature under X-Ray excitation on (a) LuPO4:Ce3+, (b) LuPO4:Eu3+ and (c) LuPO4:Tb3+ (The emission spectra of LuPO4:Eu3+ powders
synthesized by co-precipitation are not presented, but they are similar to the ones recorded for the Eu3+ doped powders elaborated by sol-gel process)
Figure 7: Decay curves recorded at room temperature for LuPO4: Eu3+ 5 % co-precipitated (a),
LuPO4: Eu3+ 5 % sol-gel (b) and LuPO4: Tb3+ 5 % sol-gel (c). Decays have been fitted with a single
exponential and lifetimes are given on the graph.
Figure 8: Relative scintillation yields of LuPO4:Ce3+, LuPO4:Eu3+ and LuPO4:Tb3+ samples
Figure 9: Afterglow measurements on LuPO4:Ce3+, LuPO4:Eu3+ and LuPO4:Tb3+ and on Gadox
10 20 30 40 50 60 70 ASTM (c) (b) (a) Inten sit y ( a.u.) 2θ (°)
Figure 1: X-Ray diffraction patterns recorded for (a) LuPO4:Ce3+ (1%), (b) LuPO4:Eu3+ (10%) and (c) LuPO4:Tb3+ (5%) with the corresponding reference patterns (dotted lines)
500 1000 1500 3000 3500 4000 0,0 0,1 0,2 0,3 0,4 0,5 0,6 0,7 x 50 Abs o rbance Wavenumber (cm-1)
200 400 600 800 1000 42 44 46 48 50 52 54 Wei ght l os s (m g) Temperature (°C)
Figure 4: SEM micrographs of LuPO4 powders treated at 1100°C for 24 hours 10 µm
200 220 240 260 280 300 320 340 5d (T2 and E) Inten sit y (a.u .) λ (nm) LuPO4:Ce 200 250 300 350 400 450 500 7 F 0 5 D 2 7 F 0 5 D 3 7F 0 5L 6 7 F 0 5 G 2 , 5 L 8 7 F 0 5 D 4 7 F 0 5 H J 7 F 0 5 F 2 In te ns ity (a .u .) λ (nm) LuPO4:Eu 200 250 300 350 400 450 7 F6 5 G6+5 D3 7 F6 5 L10 7 F 6 5 L 9 + 5 D 2 7 F 6 5 L 8 7 F 6 5 H 7 7F 6 5H 6 Int ens it y (a. u. ) λ (nm) LuPO4:Tb
Figure 5: Excitation spectra of LuPO4:Ce3+ (0.5%), LuPO4:Eu3+ (10%) and LuPO4:Tb3+ (5%) recorded at room temperature and respectively at λem = 360 nm, λem = 592 nm and λem = 541 nm
300 350 400 5d 2 F7/2 5d 2 F5/2 LuPO4:Ce 0.1% 0.2% 0.3% 0.5% 1% In te ns ity ( a. u.) λ (nm) 600 650 700 5 D0 7 F4 5 D0 7 F3 5 D0 7 F2 5 D0 7 F1 0.2% 0.5% 1% 5% 10% LuPO4:Eu In te ns ity (a .u .) λ (nm) 450 500 550 600 650 5 D4 7 F6 5 D4 7 F4 5 D4 7F5 5 D4 7 F6 5% 1% 0.5% 0.2% LuPO4:Tb Inte ns ity (a. u.) λ (nm)
Figure 6: Emission spectra recorded at room temperature under X-Ray excitation on (a) LuPO4:Ce3+, (b) LuPO4:Eu3+ and (c) LuPO4:Tb3+ (The emission spectra of LuPO4:Eu3+ powders synthesized by co-precipitation are not presented, but they are similar to the ones recorded for the Eu3+ doped powders elaborated by sol-gel process)
0 6000 12000 18000 0 4000 8000
τ
=2.5 ms
(b)
In te n s it y [a .u .] Time [µs](c)
τ
=2.5 ms
0 6000 12000 18000τ
=3.9 ms
(a)
Figure 7: Decay curves recorded at room temperature for LuPO4: Eu3+ 5 % co-precipitated (a), LuPO4: Eu3+ 5 % sol-gel (b) and LuPO4: Tb3+ 5 % sol-gel (c). Decays have been fitted with a single exponential and lifetimes are given on the graph.
0 2 4 6 8 10 0 2000 4000 6000 8000 10000 Sci nt ill ati on yi eld (p hot ons /MeV)
Doping concentration (% at.) LuPO4:Ce
LuPO4:Eu (Sol-gel)
LuPO4:Eu (Co-precipitation) LuPO4:Tb
1 10 100 1000 10000 100000 1E-6 1E-5 1E-4 1E-3 0,01 0,1 1 In ten sit y ( a.u .) Time (ms) LuPO4:Ce
LuPO4:Eu Sol-gel
LuPO4:Eu Co-precipitation
LuPO4:Tb
Gd2O2S:Tb
Figure 9: Afterglow measurements on LuPO4:Ce3+, LuPO4:Eu3+ and LuPO4:Tb3+ and on Gadox under X-ray excitation with a 10 s irradiation time
References
[1] a) Proc. of Inorganic Scintillators and their Applications, Chamonix, France 2001; b) Proc. of
Inorganic Scintillators and their Applications, Valencia, Spain 2003.
[2] a) A. Lempicki, E. Berman, A.J. Wojtowicz, M. Balcerayk, L.A. Boatner, IEEE Trans. Nucl.
Sci., 1993, 40, 384; b) A.J. Wojtowicz, A. Lempicki, D. Wisniewski, M. Balcerzyk, C. Brecher, IEEE Trans. Nucl. Sci., 1996, 43, 2168; c) W.W. Moses, M.J. Weber, S.E. Derenzo, D. Perry, P.
Berdahl, L.A. Boatner, IEEE Trans. Nucl. Sci., 1998, 45, 462; d) M. Balcerzyk, Z. Gontarz, M. Moszynski and M. Kapusta, J. Lum., 2000, 87-89, 963-966; e) D. Wisniewski, S. Tavernier, P. Dorenbos, M. Wisniewska, A.J. Wojtowicz, P. Bruyndonckx, E. van Loef, C.W.E. van Eijk, L.A. Boatner, IEEE Trans. Nucl. Sci., 2002, 49, 937.
[3] D. C. Bradley, R. C. Mehrotra and D. P. Gaur, Metal Alkoxides, Academic Press Inc.,
London, 1978.
[4] a) W.O. Milligan, D.F. Mullica, G.W. Beall and L.A. Boatner, Inorg. Chim. Acta, 1982, 60, 39-43; b) W.O. Milligan, D.F. Mullica, G.W. Beall and L.A. Boatner, Acta Cryst., 1983, C39, 23-24; c) W.O. Milligan, D.F. Mullica, G.W. Beall and L.A. Boatner, Inorg. Chim. Acta, 1983, 70, 133-136. [5] a) G.W. Beall, L.A. Boatner, D.F. Mullica and W.O. Milligan, J. Inorg. Nucl. Chem., 1980, 43, 101-105 ; b) D.F. Mullica, W.O. Milligan et D.A. Grossie, Inorg. Chim. Acta, 1984, 95, 231-236 ; c) D.F. Mullica, D.A. Grossie and L.A. Boatner, J. Solid State Chem., 1985, 58, 71-77 ; d) D.F. Mullica, D.A. Grossie, Inorg. Chim. Acta, 1985, 109, 105-110; e) Yunxiang Ni, John M. Hughes, Anthony N. Mariano, American Mineralogist, 1995, 80, 21-26.
[6] a) S-L. Tie, Y-Y. Li and Y-S. Yang, J. Phys. Chem. Solids, 1997, 58 (6), 957-961; b) T. Masui, H. Hirai, N. Imanaka and G. Adachi, Phys. Stat. Sol. (a), 2003, 198 (2), 364-368.
[7] S.K. Ruan, J.G Zhou, A.M. Zhong, J.F. Duan, X.B. Yang and M.Z. Su, J. Alloys Compd., 1998,
275-277, 72-75.
[8] L. Zhang, PhD Dissertation, 1998, Lyon I.
[9] D. Hreniak, E. Zych, L. Kepinski and W. Strek, J. Phys. Chem. Solids, 2003, 64, 111-119. [10] M. Zawadzki, D. Hreniak, J. Wrzyszcz, W. Mista, H. Grabowska, O.L. Malta and W. Strek,
Chem. Phys., 2003, 291 (3), 275-285.
[11] J.M. Nedelec, D. Avignant and R. Mahiou, Chem. Mat., 2002, 14, 651.
[12] M. Moszynski, M. Kapusta, M. Mayhugh, D. Wolski and S.O. Flyckt, IEEE Trans. Nucl. Sci.,
1997, 44, 1052.
[14] M. Balcerzyk, Z. Gontarz, M. Moszynski and M. Kapusta, J. Lum., 2000, 87-89, 963-966. [15] C. Mansuy, J-M Nedelec and R. Mahiou, J. Mater. Chem., 2004, 14, 3274-3280.