HAL Id: tel-02188098
https://tel.archives-ouvertes.fr/tel-02188098
Submitted on 18 Jul 2019HAL is a multi-disciplinary open access archive for the deposit and dissemination of sci-entific research documents, whether they are pub-lished or not. The documents may come from teaching and research institutions in France or abroad, or from public or private research centers.
L’archive ouverte pluridisciplinaire HAL, est destinée au dépôt et à la diffusion de documents scientifiques de niveau recherche, publiés ou non, émanant des établissements d’enseignement et de recherche français ou étrangers, des laboratoires publics ou privés.
approaches
Romain Schläppy
To cite this version:
Romain Schläppy. Snow avalanche hazard assessment in the French Alps using a combination of dendrogeomorphic and statistical approaches. Geography. Université Panthéon-Sorbonne - Paris I; Université de Berne, 2014. English. �NNT : 2014PA010679�. �tel-02188098�
PhD
thesis
Geography
SCHLÄPPY
Romain
Snow
avalanche hazard assessment in the French
Alps
using a combination of dendrogeomorphic and
statistical
approaches
Supervisors
of PhD thesis: Dr. Vincent JOMELLI / Prof. Dr. Markus STOFFEL
Defended
on 23 April 2014
Commitee:
Dr.
Vincent JOMELLI, Université Paris 1 Panthéon‐Sorbonne, co‐director
Prof.
Dr. Markus STOFFEL, Université de Berne, co‐director
Dr.
Nicolas ECKERT, Irstea, Grenoble, co‐supervisor
Prof.
Dr. Daniel GERMAIN, Université Québec, reviewer
Dr.
Luuk DORREN, Universität für Bodenkultur, Vienne, reviewer
Prof.
Dr. Pierre PECH, Université Paris 1 Panthéon‐Sorbonne, examiner
Dr.
Frédéric BERGER, Irstea, Grenoble, examiner
Université
Paris 1 Panthéon‐Sorbonne
École
Doctorale
de
Géographie de Paris
Université
Berne
Décanat
de la Faculté
des
Sciences naturelles
Thèse
de Doctorat
Géographie
SCHLÄPPY
Romain
Caractérisation
de laléa avalancheux dans les Alpes
françaises.
Combinaison dapproches
dendrogéomorphologique
et statistique
Thèse
dirigée par: Dr. Vincent JOMELLI / Prof. Dr. Markus STOFFEL
Soutenue
le 23 avril 2014
Jury:
Dr.
Vincent JOMELLI, Université Paris 1 Panthéon‐Sorbonne, co‐directeur
Prof.
Dr. Markus STOFFEL, Université de Berne, co‐directeur
Dr.
Nicolas ECKERT, Irstea, Grenoble, co‐encadrant
Prof.
Dr. Daniel GERMAIN, Université Québec, rapporteur
Dr.
Luuk DORREN, Universität für Bodenkultur, Vienne, rapporteur
Prof.
Dr. Pierre PECH, Université Paris 1 Panthéon‐Sorbonne, examinateur
Dr.
Frédéric BERGER, Irstea, Grenoble, examinateur
Université
Paris 1 Panthéon‐Sorbonne
École
Doctorale
de
Géographie de Paris
Université
Berne
Décanat
de la Faculté
des
Sciences naturelles
Summary ‐ V
Summary
Snow avalanches are a significant natural hazard that impact roads, structures and threaten human lives in mountainous terrain. Although relatively few people are killed during ''normal winters, extreme winters may still claim victims, as winter 1998/1999 showed very clearly throughout the Alps. Hence, specification of expected runout distances and related return periods are the most important steps for zoning in snow avalanche prone terrain. Runout distances can be identified through a combination of field observations, historical records or the analysis of aerial photos and topographic maps. However, as long and continuous historical observations are generally scarce, the extent of avalanches is usually evaluated using topographic or statistic models. These models are well capable to simulate contemporary events with return periods typically � 30 yr, but uncertainties increase as soon as longer return periods are investigated. Thus, there is a real need for validation of modeling procedures to corroborate model predictions.
Dendrogeomorphology has been recognized as a powerful tool to reconstruct past activity of avalanches with annual resolution and for risk assessment. The approach has also been used to find relations between snow and weather variables and avalanche activity. Surprisingly, little attention has been paid so far to assess the accuracy and relevance of dendrogeomorphology for these particular uses in the field of snow avalanche science. It is therefore the aim of this PhD thesis to (i) propose a new tree‐ring‐based semi‐quantitative approach for the identification of avalanche events and to evaluate the quality and completeness of tree‐ring records, to (ii) densify and extend existing avalanche data in different paths within the French Alps and to (iii) evaluate runout distances and related return periods for extreme events, to (iv) perform the first cross‐validation of high return period avalanche information derived from a locally calibrated statistical‐dynamical model and the long‐term, higher‐return period information gathered from tree‐ring records, and to (v) evaluate the actual contribution of dendrogeomorphic data to the assessment of avalanche‐climate relations at the path scale.
In the first paper, a total of 1169 samples extracted from 587 conifers (Larix decidua Mill.,
Picea abies (L.) Karst., and Abies alba Mill.) in three different avalanche paths was
investigated. Using an alternative tree‐ring‐based semi‐quantitative approach, we were able to reconstruct a total of 75 avalanche events for the period 1799�2010. As the approach relies on the assessment of the number and position of disturbed trees within avalanche paths as well as the intensity of reactions in trees, the principal objective of this study was to demonstrate that no bias was induced by the dendrogeomorphic expert. Based on a statistical evaluation (Classification Trees, or CART) of the approach, we were able to point out the consistency and replicability of the procedure. Moreover, comparison between the avalanche years recorded in a substantial database in a well‐documented path in Chamonix and those defined with dendrogeomorphic techniques shows that the avalanche record reconstructed from tree‐ring series contains 38% of the observed events.
In the second paper, a total of 713 samples extracted from 297 conifers (L. decidua and P.
abies) were used to reconstruct avalanche activity in two avalanche paths using the semi‐
quantitative approach validated previously. The objective was to perform the first cross‐ validation of high return period avalanches derived from a locally calibrated statistical‐ dynamical model and the long‐term, higher‐return period information gathered from tree‐ ring records. Based on the reconstructed distribution of runout distance of 25 events for the period 1799�2010 and mean event frequencies, we successfully derived runout values for events with return periods of � 300 yr. Comparison of relations between runout distances and return periods between both approaches shows very good agreement. Within the classical intervals used in hazard zoning (i.e. 10�300 yr), mean and mean square errors amounted to ~20 and 30�45 m, respectively.
The main objective of the last part of this PhD thesis was to evaluate the relevance of climateavalanche relationships inferred from tree‐ring chronologies at the local scale, given that dendrogeomorphic reconstructions may miss a significant number of avalanches. Firstly, past avalanche activity was reconstructed in five paths in different areas of the French Alps with various site‐related characteristics. Based on refined daily snow and weather data for the period 1959�2009, we defined a large set of potential variables that could explain
Summary ‐ VII
avalanche activity and picked up the most pertinent of them using a variable selection procedure implemented within a logistic regression framework. A similar approach was used with event chronologies derived from historical archives as well as with a third data set composed of a combination of both chronology types. Obtained logistic regression models suggest that tree rings preferentially record events that occurred during cold winter storms with heavy precipitation. Conversely, an important proportion of those events may be missed by human observation on remote paths or on paths were risk exposure is low.
In conclusion, this PhD thesis provides new insights into the possibilities and limitations of tree‐ring analyses in snow avalanche research. The new semi‐quantitative approach used in this work has been proven to be consistent and applicable in different types of paths. This approach is not restricted to the identification of high‐magnitude avalanches but also allows determination of relatively small events. Although tree‐ring reconstructions may miss a significant number of avalanches, dendrogeomorphic data can be seen as an extremely valuable data pool for the assessment of runout distances and return periods of extreme avalanche events, and in particular for the hazard zoning on forested paths with limited or no historical data. Furthermore, tree‐ring records contribute to a better understanding of link between snow, climate and avalanche activity, but only up to a certain extent, specifically for avalanche events occurring during cold episodes accompanied by heavy precipitation. It seems, however, that combining tree‐ring and historical event chronologies for refining the study of climate‐avalanche relations remains a difficult and open problem. In the current context of climate warming, similar approaches are needed at the regional scale to evaluate the contribution of dendrogeomorphic data for documenting the response of avalanche activity to climate change.
Keywords: snow avalanche, dendrogeomorphology, tree ring, hazard assessment, runout
distance, return period, avalanche‐climate relations, statistical‐dynamical model, logistic regression, French Alps, validation.
Résumé ‐ IX
Résumé
Dans les régions de montagne, les avalanches sont susceptibles daffecter le réseau routier et les infrastructures bâties, mettant ainsi en péril la population résidante. Bien que lon dénombre relativement peu de victimes davalanches spontanées durant les hivers considérés comme «normaux», les hivers extrêmes peuvent parfois se révéler très meurtriers, comme ce fut le cas durant lhiver 1998/1999 dans les Alpes. Ainsi, la caractérisation des distances darrêt des avalanches et lévaluation des périodes de retour associées représentent létape la plus importante pour un zonage réaliste en aval des couloirs. Les distances darrêt peuvent être identifiées à laide de plusieurs méthodes telles que les observations de terrain, la consultation darchives historiques ou encore lanalyse de photos aériennes et de cartes topographiques. Cependant, ces données sont souvent lacunaires et limitées dans le temps. Pour cette raison, lextension des avalanches est généralement évaluée à laide de modèles physiques et/ou statistiques. Ces modèles sont très performants lorsquil sagit de simuler des évènements relativement fréquents dont la période de retour est inférieure ou égale à 30 ans. A linverse, les incertitudes tendent à augmenter rapidement dès lors que lon considère des périodes de retour supérieures. Il est donc indispensable de valider les procédures de modélisation afin de confirmer les prédictions qui en découlent
La dendrogéomorphologie a prouvé son utilité pour reconstituer lactivité avalancheuse passée au pas de temps annuel. Cette technique a également été utilisée pour caractériser les relations entre des variables liées au manteau neigeux et météorologiques, et lactivité avalancheuse. De manière assez surprenante, peu dintérêt a été porté sur lévaluation de la précision et la pertinence de lapproche dendrogéomorphologique dans le domaine de létude des avalanches. Lobjectif de ce travail de thèse est donc de (i) proposer une nouvelle approche semi‐quantitative fondée sur létude des cernes darbres pour lidentification des évènements avalancheux et dévaluer la qualité et lexhaustivité de cet outil naturaliste; (ii) densifier et étendre les données existantes sur les avalanches dans plusieurs couloirs des
Alpes françaises et (iii) évaluer les distances darrêt et les périodes de retour associées pour les évènements extrêmes; (iv) réaliser la première validation croisée entre des avalanches à période de retour très élevées prédites par un modèle statistique‐dynamique calibré localement et des informations sur des périodes de retour davalanches similaires obtenues grâce à létude des séries de cernes darbres impactés; (v) évaluer la contribution effective des données dendrogéomorphologiques pour la caractérisation des relations avalanche�climat à léchelle locale.
La première étude de ce travail se fonde sur lanalyse de 1169 échantillons extraits de 587 conifères (Larix decidua Mill., Picea abies (L.) Karst., and Abies alba Mill.) dans trois couloirs davalanches. Grâce à lutilisation dune nouvelle approche dendrogéomorphologique semi‐ quantitative, un total de 75 évènements avalancheux a été reconstitué pour la période 1799�2010. Cette approche se fonde sur lévaluation du nombre et de la position des arbres impactés par les avalanches situés dans les couloirs ainsi que sur lintensité des réactions dans les arbres. Lobjectif principal était donc de démontrer quaucun biais ne résulte de lexpertise dendrogéomorphologique. Une évaluation statistique (arbres de classification) de lapproche a permis de confirmer la cohérence et la transférabilité de la procédure utilisée. Par ailleurs, la comparaison entre les années avalancheuses reportées dans une base de données substantielle et celles identifiées par lapproche dendrogéomorphologique dans un couloir très bien documenté à Chamonix montre que la chronique issue des séries de cernes darbres contient 38% des évènements observés.
La seconde étude se fonde sur un total de 713 échantillons extraits de 297 conifères (L.
decidua and P. abies) et a permis de reconstituer lactivité avalancheuse dans deux couloirs à
laide de lapproche semi‐quantitative évaluée préalablement. Lobjectif était de réaliser la première validation croisée entre des avalanches à période de retour très élevées prédites par un modèle statistique‐dynamique calibré localement et des informations sur des périodes de retour davalanches similaires obtenues grâce à létude des séries de cernes darbres impactés. Se fondant sur la distribution des distances d'arrêt de 25 évènements reconstitués dans deux couloirs et sur la fréquence évènementielle moyenne pour la période 1799�2010, il a été possible de déduire l'extension spatiale pour des évènements dont la
Résumé ‐ XI
période de retour est égale ou inférieure à 300 ans. Les relations entre distances d'arrêt et périodes de retour issues des deux approches ont été comparées. Les résultats montrent une bonne concordance entre les deux approches. En effet, considérant les intervalles traditionnellement utilisés en zonage, i.e. 10�300 ans, les écarts moyens ainsi que les écarts quadratiques moyens s'élèvent à ~20 et 30�45 mètres, respectivement.
Lobjectif principal de la troisième étude de ce travail était dévaluer la pertinence des relations climat�avalanches dérivées des séries de cernes darbres impactés à léchelle locale, considérant la non‐exhaustivité des reconstructions dendrogéomorphologiques. Dans un premier temps, lactivité avalancheuse a été reconstituée dans cinq couloirs dispersés dans les Alpes françaises. Se fondant sur des données journalières ré‐analysées liées au manteau neigeux et aux conditions météorologiques pour la période 1959�2009, nous avons défini un important jeu de variables pouvant potentiellement expliquer lactivité avalancheuse et les plus pertinentes ont été sélectionnées à laide dune procédure mise en place dans le cadre dune régression logistique. Une approche similaire a été utilisée avec les chronologies évènementielles dérivées des archives historiques et dun troisième jeu de données composé dune combinaison des deux types de chronologie. Les modèles obtenus de la régression logistique suggèrent que les cernes darbres enregistrent de manière préférentielle les évènements qui ont eu lieu durant des épisodes froids associés à des tempêtes hivernales accompagnées de fortes précipitations. A linverse, ce genre dévènements échappe régulièrement aux observateurs en charge de la surveillance des couloirs situés dans des zones reculées ou pour lesquels le risque dexposition est faible. En conclusion, ce travail de thèse fournit de nouvelles connaissances concernant les apports et les limites de létude des cernes darbres dans le domaine de la prévention des avalanches. Nous avons démontré que lapproche semi‐quantitative utilisée pour cette recherche est cohérente et peut être appliqué dans différents types de couloir. Lutilisation de cette approche nest pas restreinte à lidentification des avalanches extrêmes mais permet également la caractérisation dévènements relativement confinés. Bien que les reconstitutions dendrogéomorphologiques tendent à manquer un certain nombre dévènements avalancheux, les séries de cernes darbres impactés par les avalanches
peuvent être très utiles pour lévaluation des distances darrêt des évènements extrêmes et des périodes de retour associées, en particulier en ce qui concerne le zonage à proximité des couloirs boisés pour lesquels les archives historiques sont lacunaires, voire inexistantes. Par ailleurs, les données dendrogéomorphologiques peuvent, dans une certaine mesure, contribuer à une meilleure compréhension des relations entre le manteau neigeux, le climat et lactivité avalancheuse, particulièrement pour les évènements ayant lieu durant les épisodes hivernaux froids accompagnés de fortes précipitations. Cependant, létude des relations climat�avalanches se fondant sur la combinaison de chronologies dévènements dérivées des archives historiques et des cernes darbres demeure compliquée et reste une problématique ouverte. Dans le contexte actuel de réchauffement climatique, il paraît indispensable de conduire des approches similaires à léchelle régionale afin dévaluer la contribution des analyses dendrogéomorphologiques pour documenter la réponse de lactivité avalancheuse aux changements climatiques.
Mots‐clés: avalanche, dendrogéomorphologie, cerne darbre, caractérisation des aléas,
distance darrêt, période de retour, relations avalanche‐climat, modèle statistique‐ dynamique, régression logistique, Alpes françaises, validation.
Table of contents ‐ XIII
Table
of contents
Summary
________________________________________________________________ VRésumé
__________________________________________________________________ IXTable
of contents
_______________________________________________________ XIIIList
of tables
____________________________________________________________ XIXList
of figures
___________________________________________________________ XXIAcknowledgements
___________________________________________________ XXVPreamble
_____________________________________________________________ XXVIICHAPTER
A : GENERAL INTRODUCTION
1
Introduction
________________________________________________________ 3 1.1 Snow avalanche process _______________________________________________ 3 1.1.1 Definition _______________________________________________________ 3 1.1.2 Snow avalanche formation _________________________________________ 3 1.1.3 Path characteristics _______________________________________________ 5 1.2 Main issues __________________________________________________________ 6 1.3 Objectives ___________________________________________________________ 8 1.4 Structure of the thesis _________________________________________________ 82
Dendrogeomorphology: a valuable tool for the reconstruction of
snow
avalanche activity
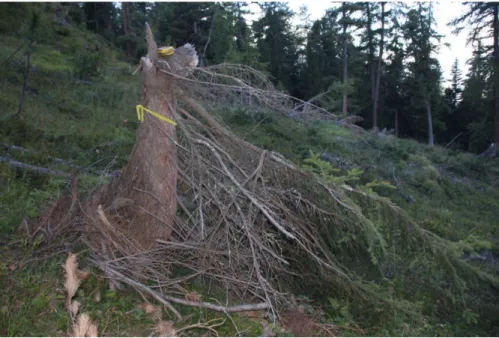
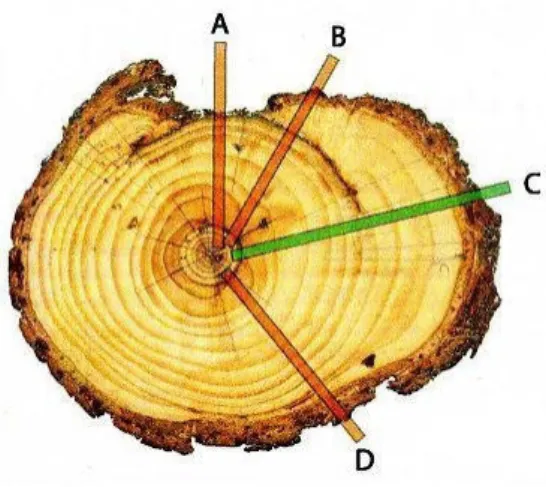
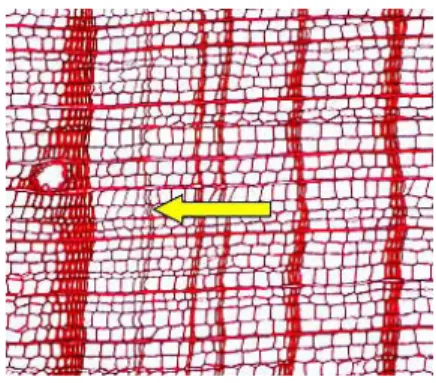
___________________________________________ 11 2.1 Principles of dendrochronology _________________________________________ 11 2.2 Influence of snow avalanches on trees and their reactions to the disturbance ____ 12 2.2.1 Growth injuries (wound) and formation of traumatic resin ducts __________ 13 2.2.2 Tilting of trunks _________________________________________________ 14 2.2.3 Decapitation of trees and elimination of branches ______________________ 14 2.3 Dendrogeomorphic procedure _________________________________________ 162.3.1 Field approach __________________________________________________ 16 2.3.2 Sampling design and methods _____________________________________ 16 2.3.3 Sample preparation, counting of tree‐rings and growth disturbance analysis 20 2.3.4 Reference chronology ______________________________________________________ 21
3
Dendrogeomorphology applied to snow avalanche science a state
of
the art
________________________________________________________________ 234
Study sites
_________________________________________________________ 27CHAPTER
B : IDENTIFICATION OF PAST SNOW AVALANCHE ACTIVITY
Abstract _____________________________________________________________ 311
Introduction
_______________________________________________________ 322
Study area and historical archives
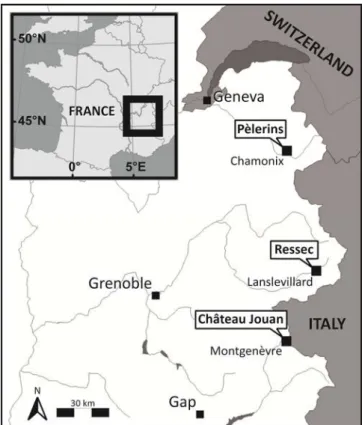
_________________________________ 34 2.1 Pèlerins path ________________________________________________________ 34 2.2 Ressec path _________________________________________________________ 35 2.3 Château Jouan path __________________________________________________ 36 2.4 Historical archives ___________________________________________________ 373
Tree‐ring based snow avalanche event chronologies
_____________ 39 3.1 Dendrogeomorphic analysis ____________________________________________ 39 3.2 Determination of snow avalanche years __________________________________ 39 3.3 Growth disturbances and past avalanche activity ___________________________ 414
Statistical evaluation of the semi‐quantitative approach
_________ 43 4.1 Classification trees and characterization of assessment criteria _______________ 43 4.2 Consistency of the approach ___________________________________________ 44 4.3 Replicability of the approach based on an independent path _________________ 45 4.4 An efficient tool to complement historical avalanche chronologies _____________ 475
Discussion and conclusion
_________________________________________ 50 5.1 Contribution of the spatial information in avalanche assessment ______________ 50 5.2 A valuable approach for the determination of past snow avalanches ___________ 52 Acknowledgments _____________________________________________________ 57Table of contents ‐ XV
CHAPTER
C : EVALUATION OF RUNOUT DISTANCES AND RETURN PERIODS
Abstract _____________________________________________________________ 611
Introduction
_______________________________________________________ 622
Study sites
_________________________________________________________ 66 2.1 Château Jouan path __________________________________________________ 66 2.2 Avalanche des Pylônes path ____________________________________________ 673
Data and methods
_________________________________________________ 69 3.1 Avalanche historical data ______________________________________________ 69 3.2 A locally calibrated Bayesian statistical‐dynamical model ____________________ 70 3.3 Dendrogeomorphic analysis and avalanche event reconstruction ______________ 72 3.4 Evaluation of avalanche runout distances from field data ____________________ 74 3.5 Evaluation of return periods ___________________________________________ 75 3.6 Cross validation of models simulations with independent dendrogeomorphic data 784
Results
_____________________________________________________________ 80 4.1 Tree‐ring analysis and event reconstruction _______________________________ 80 4.1.1 Age structure of the forest stand ___________________________________ 80 4.1.2 Growth disturbances and identification of avalanche events _____________ 81 4.2 Determination of event frequencies _____________________________________ 82 4.3 Runout distance distribution along the path _______________________________ 83 4.4 Cross validation between simulated and empirical high return periods _________ 845
Discussion and conclusion
_________________________________________ 90 Acknowledgements ____________________________________________________ 96CHAPTER
D : ASSESSMENT OF AVALANCHE‐CLIMATE RELATIONS
Abstract _____________________________________________________________ 991
Introduction
______________________________________________________ 1002
Study sites
________________________________________________________ 103 2.1 Avalanche des Pylônes path ___________________________________________ 104 2.2 Pèlerins path _______________________________________________________ 104 2.3 Ressec path ________________________________________________________ 1052.4 Château Jouan path _________________________________________________ 105 2.5 Ourcière path ______________________________________________________ 105
3
Data and methods
________________________________________________ 106 3.1 Dendrogeomorphic analysis and avalanche event identification ______________ 106 3.2 Historical avalanche data _____________________________________________ 108 3.3 Modeled weather and snow data ______________________________________ 109 3.4 Monthly standardized data ___________________________________________ 111 3.5 Variable selection in logistic regression __________________________________ 1114
Results
____________________________________________________________ 115 4.1 Avalanche event chronologies derived from dendrogeomorphic and/or historical data ______________________________________________________________ 115 4.2 Statistical relationships between snow/climate variables and avalanche activity _ 116 4.2.1 Snow and weather explanatory factors of avalanche events recorded in dendrogeomorphic data _________________________________________ 116 4.2.2 Snow and weather explanatory factors of avalanche events reported in historical data _________________________________________________ 120 4.2.3 Snow and weather explanatory factors of events derived from both datasets __ _____________________________________________________________ 1235
Discussion
________________________________________________________ 1256
Conclusion and outlook
___________________________________________ 129 Acknowledgements ___________________________________________________ 130CHAPTER
E : SYNTHESIS
1
Conclusions
_______________________________________________________ 133 1.1 An improved tool for the identification of snow avalanche events ____________ 133 1.2 Tree‐ring data contain valuable information to anticipate future extreme avalanche events ____________________________________________________________ 134 1.3 Trees may preferentially record avalanche events occurring in full winter conditions _________________________________________________________ 1342
Further research
__________________________________________________ 136Table of contents ‐ XVII
CHAPTER
F : APPENDICES
1
Appendix to Chapter C
____________________________________________ 141 1.1 Statistical‐dynamical model ___________________________________________ 141 1.2 Bayesian calibration on historical data and posterior sampling _______________ 1442
Appendix to Chapter D
___________________________________________ 147 2.1 Description of snow and weather variables ______________________________ 147 2.1.1 Variables that were tested on a monthly basis analysis _________________ 147 2.1.2 Composite variables based on the daily outputs from SAFRAN and CROCUS simulations ____________________________________________________ 1473
Maps of snow avalanche years
___________________________________ 151 3.1 Avalanche des Pylônes path ___________________________________________ 151 3.2 Pèlerins path _______________________________________________________ 154 3.3 Ressec path ________________________________________________________ 159 3.4 Château Jouan path _________________________________________________ 161 3.5 Ourcière path ______________________________________________________ 163Bibliography
_________________________________________________________________ 165List of tables ‐ XIX
List
of tables
Table 1. Site‐related characteristics in the Pèlerins, Ressec and Château Jouan paths. The three paths exhibit quite different features although their solar exposure and mean slope are rather similar. The Pèlerins path represents a very‐extended avalanche path, while the Ressec and ChâteauJouan paths are smaller in size. __________________________________________________ 35
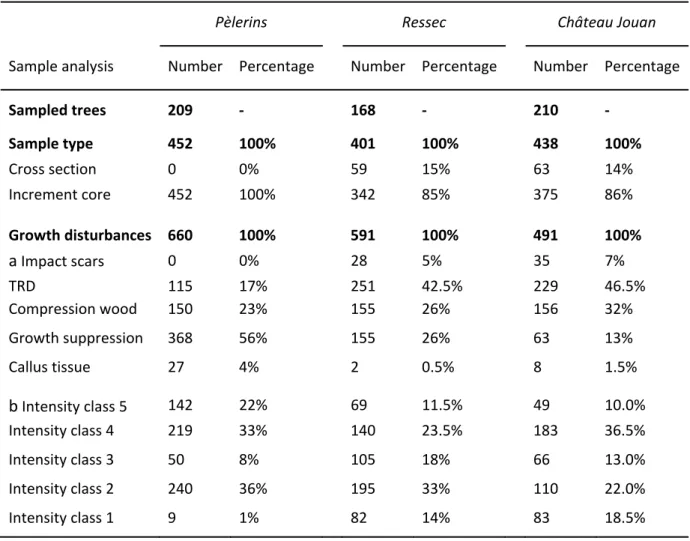
Table 2. Growth disturbance intensity scale. This scale emphasizes features that are clearly associated with avalanche activity and discriminates against disturbances which may be induced by other factors. Thresholds related to growth reduction and compression wood have been defined based on the visual quality of these reactions within each sample. TRD = tangential rows of traumatic resin ducts. _____________________________________ 40 Table 3. Sample depth, (a) types, and (b) intensity of growth disturbances in the Pèlerins, Ressec and Château Jouan paths. TRD = tangential rows of traumatic resin ducts. ___________________ 42 Table 4. Confusion matrix of assigned and predicted avalanche occurrences in the Château Jouan path. The dendrogeomorphic expert initially assigned scores during assessment procedure. Predicted values result from the classification tree calibrated from a combined dataset composed of tree‐ring chronology years from both Pèlerins and Ressec paths. ____________ 47 Table 5. Snow avalanche years reconstructed based on several assessment criteria in the Pèlerins path. This study reconstructed 34 event years for the period 1771�2010. In comparison, only eleven years (bold underlined) would have been identified based on the fixed thresholds of GDs � 10 and It � 10 (Dubé et al., 2004; Reardon et al., 2008; Corona et al., 2012a). _______ 56 Table 6. Parameters of the statistical dynamical model in the (a) Château Jouan and (b) Avalanche des Pylônes paths. For each parameter, the marginal prior distribution used for Bayesian inference is provided, as well as the posterior mean, the posterior standard deviation and the lower and upper limits of the 95% credible interval. _________________________________ 71 Table 7. Sample size, (a) types, and (b) intensity of growth disturbances in the Château Jouan and Avalanche des Pylônes paths. TRD = tangential rows of traumatic resin ducts. ____________ 74 Table 8. Tree‐ring based snow avalanche events, minimum runout altitudes and related horizontal runout distances in the Château Jouan and Avalanche des Pylônes paths. ________________ 82 Table 9. Historical and tree‐ring based annual event frequencies. Considered median annual frequency and related 2.5%, and 97.5% were derived from Figure 23. ___________________ 84 Table 10. Mean and mean square errors between tree‐ring based runout distancereturn period relations and model simulations as functions of time windows. For each time window, the number of years for which the tree‐ring based estimation could be evaluated is provided. __ 88 Table 11. Principal site‐related characteristics in the different avalanche paths. ______________ 104
Table 12. Sample depth, (a) types, and (b) intensity of growth disturbances in the five paths. ___ 107 Table 13. Logistic regression models �� � ∑������������� at the path scale for the annual
avalanche/non avalanche years derived from dendrogeomorphic data. For each explanatory variable retained, ���, �� is the weighting coefficient, �� the marginal correlation coefficient between ������� and �� (the regression model seen as a time series), and �� the determination coefficient of the logistic regression (Nagelkerke, 1991). _____________________________ 118 Table 14. Logistic regression models �� � ∑������������� at the path scale for the annual
avalanche/non avalanche years derived from historical data. For each explanatory variable retained, ���,�� is the weighting coefficient, �� the marginal correlation coefficient between ������� and �
� (the regression model seen as a time series), and �� the determination
coefficient of the logistic regression (Nagelkerke, 1991). _____________________________ 121 Table 15. Logistic regression models �� � ∑������������� at the path scale for the annual
avalanche/non avalanche years derived from both dendrogeomorphic and historical data. For each explanatory variable retained, ���, �� is the weighting coefficient, �� the marginal
correlation coefficient between ������� and �� (the regression model seen as a time series), and �� the determination coefficient of the logistic regression (Nagelkerke, 1991). __________ 124
List of figures ‐ XXI
List
of figures
Figure 1. Illustration of (a) loose and (b) slab avalanche failure types (after McClung and Schaerer, 2006). _______________________________________________________________________ 4 Figure 2.The three principal subdivisions in an avalanche path. ______________________________ 6 Figure 3. Cross‐dating of tree‐ring series of unknown age from houses or moraines with younger series from living trees illustrated with the raw data as seen on the cross‐sections as well as in the form of measured ring‐width series (Source: Schweingruber, 1983). _________________ 12 Figure 4. Injuries in a Larix decidua Mill.: (a) Injured stem (b) Cross‐section with overgrowth starting from the lateral edges of the injury. (c) Callus tissue as observed in the overgrowing cell layers bordering the injury. (d) Tangential row of traumatic resin ducts migrating from earlywood towards later portions of the tree ring with increasing distance from the wound (Source: Bollschweiler, 2007). __________________________________________________________ 13 Figure 5. (a) Tree morphology and (b) cross‐sections of a tilted Larix decidua Mill. (c) Increment curves of a Picea abies (L.) Karst. tree (Source: Stoffel and Bollschweiler, 2008). ___________ 15 Figure 6. Tree decapitation and branches removing caused by the windblast of a snow avalanche event. ______________________________________________________________________ 15 Figure 7. Different types of sample extracted from trees. (a) Cross‐section (b) Wedge (c) Increment cores. ______________________________________________________________________ 17 Figure 8. Increment borer used in forestry to extract cores. _______________________________ 18 Figure 9. When sampling injured trees, special attention needs to be addressed to the sampling position. Samples taken (a) inside the wound or (b) from the overgrowing callus tissue will provide an incomplete tree‐ring record, as wounds are closed from their edges. (c) Ideally, increment cores are extracted just next to the injury where the presence of overgrowing callus tissue and TRD will allow accurate dating. (d) Cores taken too far away from the wound will not necessarily show signs of the disturbing event and thus prevent dating (Source: Stoffel and Bollschweiler, 2008). __________________________________________________________ 19 Figure 10. Narrow tree ring of larch with regard to larch budmoth outbreak under the microscope (Photo: F. Schweingruber / WSL). ________________________________________________ 20 Figure 11. Study sites analyzed in this PhD thesis are located in the northern part of the French Alps: Pyl � Avalanche des Pylônes; Pel � Pèlerins; Res � Ressec; Our � Ourcière; Cha � Château Jouan. ______________________________________________________________________ 27 Figure 12. Location of the three study sites (Pèlerins, Ressec and Château Jouan paths) in the French Alps. _______________________________________________________________________ 34Figure 13. Location of sampled trees in the (a) Pèlerins, (b) Ressec and (c) Château Jouan snow avalanche paths. The CLPA (Carte de Localisation des Phénomènes dAvalanche) represents historical spatial limits of snow avalanches derived from technical reports and photographs. 36 Figure 14. Classification tree calibrated from a combined dataset composed of tree‐ring chronology years from both the Pèlerins and Ressec paths. It was used to predict scores (avalanche/non‐ avalanche years) in the Château Jouan path in order to demonstrate replicability of the semi‐ quantitative approach. ________________________________________________________ 46 Figure 15. Spatial distribution of disturbed trees for six years in the Château Jouan path. Initially, scores (avalanche/non‐avalanche year) were assigned using expert procedures (see text for details). Scores were subsequently predicted using a classification tree calibrated from a combined dataset composed of tree‐ring chronology years from both the Pèlerins and Ressec paths. Two examples (green underlined) represent years correctly predicted by the model. Conversely, four years (1975, 1958, 1931, and 1799) were incorrectly predicted (red underlined). These represent only 3% of all predicted years. GD � growth disturbance. CLPA areas represent historical limits of snow avalanches derived from technical reports and photographs. ________________________________________________________________ 48 Figure 16. Snow avalanche years in the Pèlerins path. Comparison of (a) tree‐ring based reconstructed years from this study with (b) documented avalanche years from historical archives and the EPA database. EPA � Enquête Permanente sur les Avalanches. Index numbers correspond to the percentage of disturbed trees in a given year. Bold values emphasize years where both the fixed thresholds of GDs � 10 and It � 10 were reached. _________________ 49 Figure 17. Spatial distribution of disturbed trees in the Pèlerins path in 1836, 1911, and 1988. Note that only avalanches reaching a determined observation threshold are recorded in the EPA database. For discussion, see text. _______________________________________________ 54 Figure 18. Location of the Château Jouan (Montgenèvre) and Avalanche des Pylônes (Chamonix‐ Mont‐Blanc) avalanche paths in the French Alps. ____________________________________ 66 Figure 19. Localization of sampled trees in the (a) Château Jouan and (b) Avalanche des Pylônes paths. ______________________________________________________________________ 68 Figure 20. Multivariate statistical‐dynamical avalanche model fitted on the Château Jouan EPA data. (a) release abscissa distribution. (b) release depth distribution. (c) runout distance distribution. (d) maximal flow depth distribution for avalanches whose runout distance exceeds the 10‐yr return period abscissa. (e�f) maximal velocity distribution for avalanches whose runout distance exceed the (e) 10‐yr and (f) 100‐yr return period abscissas. ____________________ 77 Figure 21. Flowchart of the principal steps leading to the cross validation of runout distance‐return period relationships. __________________________________________________________ 79 Figure 22. Age structure of the forest stand growing in the (a) Château Jouan and (b) Avalanche des Pylônes paths as obtained from tree‐ring data. Tree ages were approximated by counting the number of tree rings present in the selected trees and at sampling height. The black arrow corresponds to the maximal reach of very shallow avalanche flows that have been recorded in the EPA data. ________________________________________________________________ 80 Figure 23. Evaluation of annual mean frequency in the (a�d) Château Jouan and (e�h) Avalanche des Pylônes paths: (a, e) annual frequency for historical events as a function of the considered time
List of figures ‐ XXIII window. (b, f) related probability distribution. (c, g) annual frequency for dendrogeomorphic events as a function of the considered time window. (d, h) related probability distribution. In this work, for the historical and tree‐ring based chronicles, the median of histograms 23b, 23f, 23d, and 23h were primarily considered (Table 9). __________________________________ 83 Figure 24. Empirical and simulated cumulative distribution functions (cdfs) of runout distances in the (a) Château Jouan and (b) Avalanche des Pylônes paths. ______________________________ 85 Figure 25. Return periods (in yr) for each of the historical (grey) and tree‐ring based (black) events in the (a) Château Jouan and (b) Avalanche des Pylônes runout zones. Return periods were evaluated based on mean event frequencies (Table 9) and the estimated cumulative distribution function (cdf) of runout distances (Eq. (6)). Note that very small return periods (� 5.9 yr) are not represented to simplify display. ___________________________________ 86 Figure 26. One‐to‐one relation between runout distance and return period. Empirical relations and associated 95% confidence intervals derived from historical archives and tree‐ring reconstructions are compared to the ones derived from the statistical‐dynamical simulations. (a) At Château Jouan, return periods derived from dendrogeomorphic analysis tend to approximate very well modeled data, especially for return periods ranging from 30 to 300 yr. (b) At Avalanche des Pylônes, tree‐ring based return periods ranging from 50 to 110 yr
correspond roughly to those simulated by the model. ________________________________ 87 Figure 27. Influence of the tree‐ring based event frequency on the comparison for the Château Jouan
path: (a) mean and mean square errors as functions of the tree‐ring event frequency. (b) tree‐ ring based runout distancereturn period relations versus model simulations for the range of possible mean event frequencies from Figure 23c�d. ________________________________ 93 Figure 28. Location of the five avalanche paths in the French Alps. The French Alps are divided into 23 massifs. The Northern French Alps and Southern French Alps are represented in blue and green, respectively. The massifs where the studied paths are located are surrounded in red (adapted from Castebrunet et al., 2012). _________________________________________________ 103 Figure 29. Snow avalanche years in the five paths. Grey and white features correspond to avalanche events derived from historical and dendrogeomorphic data, respectively. ______________ 115 Figure 30. Interannual anomalies in the covariates retained in the regression models related to
avalanche activity derived from dendrogeomorphic data in the five paths. �� is the marginal correlation coefficient between each covariate and the regression model seen as a time series. Green bands correspond to avalanche years for which the regression model is above its 80th percentile. Grey bands correspond to avalanche years for which the model does not exceed the threshold. __________________________________________________________________ 119 Figure 31. Interannual anomalies in the covariates retained in the regression models related to
avalanche activity derived from historical data in the five paths. �� is the marginal correlation coefficient between each covariate and the regression model seen as a time series. Green bands correspond to avalanche years for which the regression model is above its 80th
percentile. Grey bands correspond to avalanche years for which the model does not exceed the threshold. __________________________________________________________________ 122
Acknowledgements ‐ XXV
Acknowledgements
I would like to gratefully acknowledge my two co‐directors, Dr. Vincent Jomelli and Prof. Markus Stoffel, as well as my co‐supervisor Dr. Nicolas Eckert for their guidance, support, insight and contributions throughout the process of completing my PhD thesis. They have assisted me during my whole work and offered me the great opportunity to live a 4‐year experience in the world of scientific research. I would also like to thank the other members of my examination committee, Drs. Daniel Germain, Luuk Dorren, Pierre Pech and Frédéric Berger, for accepting to review this thesis.
Special thanks to Delphine Grancher and Daniel Brunstein, who were present every day to answer my questions, to provide me technical as well as psychological support and to reassure me during this pretty long work. In addition, I would also thank Drs. Michelle Schneuwly‐Bollschweiler, Christophe Corona, Jérôme Lopez Saez, Mohamed Naaim, as well as Michaël Deschâtres and Claude Legentil for their worthy scientific contribution and the great discussions we had together. I gratefully acknowledge Louis Manière, Jonathan Dumani and Matthieu Schläppy for their assistance in the field as well as Marie‐Adélaïde Bouquet for her help in sample analysis. I also want to thank the Office National des Forêts (ONF), and especially Didier Bois, as well as the provosts in Lanslevillard, Modane, Chamonix and Montgenèvre for sampling permissions and technical assistance. Many thanks as well to the Compagnie du Mont‐Blanc for providing me free access to the Planpraz cable car during sampling campaigns. I would like to acknowledge wholeheartedly the Laboratoire de Géographie Physique Pierre Birot (LGP) in Meudon, for hosting me during all these years, and especially its former director Catherine Kuzucuoglu and its secretary Michelle Pennec, for their effective administrative assistance. In addition, I would like to gratefully thank Irina, Salomé, Valentina, Nathalie, Céline, Marie, Clélia, Marina, Anne, Marion, Anne‐Kyria, Charlotte, Sèverine, Sterenn, Thomas, Alex, Édouard, Clément, Vincent R., Vincent T., Aurélien,
Frédéric, Fouzi, Antoine, Jean‐Marc, Yohan and Tim. Without the countless coffee breaks, fit of laughter, parties and nice moments, I would probably not have succeeded in finishing my work. Many thanks to all the LGP members for having shared out their valuable human and scientific qualities. Furthermore, this research would not have been possible without the support provided by the French National Research Agency (ANR‐09‐RISK‐007‐01) and the Swiss National Science Foundation (project P1SKP2_148492). My thoughts also go to Caro, Marie, Thibault, Chris, Lilian, Steven, Laurent, Manu, Artus, and Guillaume, who allowed me to break with routine during hundreds of hours of very good music. I would also acknowledge all IMBC92 members for the great sporty moments that allowed me to retrieve a balanced body and mind.
Special thanks to my long‐time friends Lili, Véro, Jon, Youri, Louis, Kevin and Mouloud for having been present during my journeys in Switzerland and for visiting me sometimes. I would also like to thank my flatmates Marine, Alex and Jenny, as well as Sophie and Mat, Julie, Antoine and Dorothée, Marie, Alain, Cécilia and Alex, Auré and François, Alice and Stéphane, Lilou and Mat, Constance and Alexis, Johana and Xavier, Emma, Bastien, Émilie and Flo, Marie and Antoine, Nathalie and Thomas, Élo and Jim, Lulu and Alex, Stéphanie and Thom, Trifon and Mariam, and Olivier for the very nice time we spent together. I would like to express my gratitude to my mother and Pierre, Mélanie and Matthieu, Céline and Bastien, Soleïa, Lénaë, Gabrielle, Aléïna and Ayan, as well as Violaine and Tico, Johanna, Sylvie, for their support, smiles and humor. I am very proud to be part of such a beautiful family. I would also like to thank sincerely Françoise and Mao, Marion and Akram, Sandrine and Nico, Eileen, Leïla, Betty and Henri‐Paul, Aurélie and Julien, Julie and Alex, Iléa, Florence and Fréd, as well as Lorn for all the very pleasant moments we shared together. Finally, many, many thanks to Sophie, for her great patience and support during the last 3 years and for making me happy every day.
Preamble ‐ XXVII
Preamble
This PhD thesis has been realized within the framework of the MOPERA (Modélisation Probabiliste pour lÉvaluation du Risque dAvalanche) project funded by the French National Research Agency and headed by Dr. Nicolas Eckert from Irstea (Institut national de recherche en sciences et technologies pour lenvironnement et lagriculture), Grenoble, France.
Research of this thesis has been conducted at the Laboratoire de Géographie Physique Pierre Birot (LGP) research unit of the Centre National de la Recherche Scientifique (CNRS) directed by Dr. Catherine Kuzucuoglu, Université Paris 1 Panthéon‐Sorbonne, as well as at Dendrolab.ch directed by Prof. Markus Stoffel, University of Berne.
General introduction ‐ 1
CHAPTER
A
GENERAL
INTRODUCTION
Introduction ‐ 3
1
Introduction
1.1
Snow avalanche process
The following section is essentially based on McClung and Schaerer (2006). 1.1.1 Definition Snow avalanches are rapid downslope transfers of snow, often with great destructive power, which are significant natural hazards in areas of steep terrain (Luckman, 2010). They can contain rocks, soil, vegetation, or ice (Schweizer et al., 2003). Snow avalanches vary in size from a few to several million cubic meters of snow ranging in character from dry powder avalanches to dense wet snow. 1.1.2 Snow avalanche formation There are two general types of snow avalanche release: loose‐snow avalanche and slab avalanche (Schweizer et al., 2003). Loose‐snow avalanches start at or near the surface and they usually involve only surface or near‐surface snow. They start at a single area or point and spread out as they move down the slope in a triangular pattern (inverted V‐shape) as more snow is pushed down the slope and entrained into the slide (McClung and Schaerer, 2006; Figure 1). Slab avalanches initiate by a failure associated with a thin weak layer at depth in the snow cover, ultimately resulting in a block of snow, usually approximating a rectangular shape, that is entirely cut out by propagating fractures in the snow (Figure 1b). When a slab avalanche releases, it generally leaves a set of readily identifiable failure surfaces in the surrounding snowpack.These two types can be further described as to whether they are wet or dry. Wet snow avalanches have a water content of � 3% (McClung and Schaerer, 2006).
Snow avalanche activity depends on the interaction between terrain variables that control slope characteristics and meteorological/climatic conditions that control the accumulation patterns of snow (Luckman, 2010). The terrain characteristics usually determine the locations within the landscape where snow can accumulate to sufficient depth on an adequate slope (usually between 25° and 55°) to generate avalanches. However, avalanches result from the mechanical failure of the snow cover when it becomes unstable. This may be the result of direct loading during precipitation events (either snow or rain on snow), changes in the physical characteristics of the snow cover over time (mainly related to wind activity, temperature variations, and solar radiation) or inherent instability of the snow cover due to its depositional history and stratigraphy (Luckman, 2010). On the other hand, an avalanche may be actively triggered, meaning a release initiated due to a disturbance such as the presence of a skier, cornice fall, snowmobile, or explosive (Delparte, 2008).
Figure 1. Illustration of (a) loose and (b) slab avalanche failure types (after McClung and Schaerer,
Introduction ‐ 5
1.1.3 Path characteristics
An avalanche path is a fixed locality within which an avalanche moves. Avalanche paths may cover a vertical distance of only 50 m or may fall the full length of a mountainside with a vertical drop of 2000 m or more (McClung and Schaerer, 2006). Within a path, smaller avalanches may start and stop at various places, each avalanche having its own starting zone, track, and runout zone. The starting zone is the location where the unstable snow failed and began to move (Figure 2). The crown (Figure 1b) of a slab avalanche and the initiation point of a loose‐snow avalanche (Figure 1a) define the upper limit of the starting zone for each avalanche (McClung and Schaerer, 2006). A combination of variables affect the avalanche starting zone character: slope incline, wind exposure, orientation to the sun (aspect), forest cover, ground surface, slope dimensions, altitude, as well as crown and flank locations.
The track is the slope below the starting zone that connects the starting zone with the zone where debris collects: the runout zone (Figure 2). While the track is the major terrain feature for large avalanches, it is often ill‐defined in avalanches with a short running distance. Avalanche speed attains its maximum value in the track, with accelerating flow at the start of the track and decelerating flow at the end (McClung and Schaerer, 2006). The track is typically in the 15°�30° slope range (Mears, 1992). It can be confined, unconfined or a combination of both. A confined track is characterized by small drainages or gullies and has the effect of increasing flow depth and runout distances. Unconfined tracks occur on large open slopes where increased deposition may be observed at abrupt slope transitions such as benches along the avalanche path (Delparte, 2008). The runout zone is the area where deceleration is rapid, snow and transported material is deposited, and the avalanche stops (Figure 2). It can be a wide bench, a talus slope, a valley bottom, the opposite side of a valley, or anywhere that an avalanche stops running. Typical slope angles for the runout zone are 15° or less (McClung and Schaerer, 2006).
The three zones can vary for individual avalanches within an avalanche path. A forest in the runout zone can retard avalanche flow, depending on the tree spacing, tree height, and elasticity and type of avalanche. However, forest cover cannot be relied on to stop all
avalanches because these may either move through the trees or break them, especially on steep slopes above the runout zone.
Figure 2.The three principal subdivisions in an avalanche path.
1.2
Main issues
Snow avalanches are a significant natural hazard that impact roads, structures and threaten human lives in mountainous terrain (Delparte, 2008). In France, even if around 600 townships are strongly susceptible to snow avalanche danger, only few people are killed