HAL Id: hal-00925706
https://hal-univ-rennes1.archives-ouvertes.fr/hal-00925706
Submitted on 8 Jan 2014HAL is a multi-disciplinary open access archive for the deposit and dissemination of sci-entific research documents, whether they are pub-lished or not. The documents may come from teaching and research institutions in France or abroad, or from public or private research centers.
L’archive ouverte pluridisciplinaire HAL, est destinée au dépôt et à la diffusion de documents scientifiques de niveau recherche, publiés ou non, émanant des établissements d’enseignement et de recherche français ou étrangers, des laboratoires publics ou privés.
Analysis of the interaction products in U(Mo,X)/Al and
U(Mo,X)/Al(Si) diffusion couples, with X = Cr, Ti, Zr
Jérôme Allenou, Hervé Palancher, Xavière Iltis, Olivier Tougait, Houda El
Bekkachi, Anne Bonnin, Rémi Tucoulou
To cite this version:
Jérôme Allenou, Hervé Palancher, Xavière Iltis, Olivier Tougait, Houda El Bekkachi, et al.. Analysis of the interaction products in U(Mo,X)/Al and U(Mo,X)/Al(Si) diffusion couples, with X = Cr, Ti, Zr. Journal of Nuclear Materials, Elsevier, 2014, 446 (1-3), pp.208-216. �10.1016/j.jnucmat.2013.11.043�. �hal-00925706�
ANALYSIS OF THE INTERACTION PRODUCTS IN U(Mo,X)/Al AND
U(Mo,X)/Al(Si) DIFFUSION COUPLES, WITH X = Cr, Ti, Zr
J. Allenoua,b, H. Palanchera*, X. Iltisa, O. Tougaitb, H. El Bekkachib, A. Bonnina,c, R. Tucoulouc
a CEA, DEN, DEC, F-13108 Saint Paul Lez Durance Cedex, France
b Université de Rennes 1, UMR-CNRS 6226, Campus de Beaulieu, 35042 Rennes Cedex,
France
c ESRF, 6, rue J. Horowitz, 38000 Grenoble Cedex, France
* Corresponding author:
Tel: +33 4 42 25 7555, Fax: +33 4 42 25 3285, E-mail address: herve.palancher@cea.fr
ABSTRACT
In the framework of the development of a low 235U enriched nuclear fuel for material testing reactors, γ-U(Mo)/Al based materials are considered as the most interesting prospect. In the process to optimise their composition, addition to both γ-U(Mo) and Al have been proposed. In this paper, the crystallographic composition of Interaction Layers (ILs) in γ-U(Mo,X)/Al and γ-U(Mo,X)/AlSi7 diffusion couples, with X = Cr, Ti, Zr, heat-treated at 600°C for 2 hours, were studied by micro-X-Ray diffraction (µ-XRD). When compared to the U(Mo)/Al and U(Mo)/Al(Si) reference systems, all investigated systems involving either Al or Al(Si) as counterparts show interaction products composed of similar phases and related sequences of phase formation. Only relative thicknesses of sub-layers and relative fractions of intermediate phases are correlated with the nature of the X element in the γ-U(Mo,X) alloy.
More generally this work shows that γ-U(Mo)/Al and γ-U(Mo)/Al(Si) ILs are now robustly described down to the micrometer scale.
Keywords: MTR, fuel, uranium, molybdenum, titanium, zirconium, chromium, aluminium, silicon, interaction, XRD, diffusion couple
1. Introduction
Because of their high uranium density and good irradiation stability, γ-U(Mo) alloys (which adopt the high temperature form (bcc-form) of uranium) are considered as the most promising candidates for the fuel conversion of research and test reactors. In a low-enriched uranium (LEU) U(Mo) fuel being developed to replace high-enriched uranium (HEU), the fissile material is composed of atomized U(Mo) particles dispersed in a matrix of pure Al or Al alloy [1][2].
In-pile experiments reveal the formation of an Interaction Layer (IL) between U(Mo) particles and the matrix which is seen as a major limit for the fuel stability at high burn-up [3][4]. The in pile performances are improved with the addition of some Si to the Al matrix [5][6][7][8] and a subsidiary potential beneficial effect is pointed out with ternary alloying of U(Mo) alloy, at least in the case of Ti additions [9].
Out-of-pile experiments, mostly carried out on diffusion couples established, (i) that addition of Si above 5 at.% in Al(Si) alloys modifies the interaction behaviors with a Si accumulation process in IL, suppressing the formation of both the brittle UAl4 compound and of the ternary U6Mo4Al43 phase [10][11], which are supposed to have a poor irradiation behavior [12], (ii) that ternary alloying of U(Mo) with Ti [13][14] and with Zr [14][15] reduces interdiffusion kinetics. Moreover, it was demonstrated using diffusion couples with Al(Si) alloys that adding small amounts of Ti or Zr into γ-U(Mo) induces a strong accumulation of Si within the IL, especially in the case of Ti, whereas Zr additions increase the destabilization kinetics of the γ-U(Mo) alloy [9][16]. Recent works have also investigated the interest of increasing the Mo content in U(Mo) alloys (in this case (X=Mo) for decreasing IL growth kinetics [17][18].
In a previous study [19], U(Mo,X), with X = Y, Cu, Zr, Ti and Cr, and Al or Al(Si) diffusion couples, heat treated at 600°C for 2 and 4 hours, were characterized by Scanning Electron Microscopy (SEM) coupled with Energy Dispersive Spectroscopy (EDS). These results confirmed the reduction of interaction kinetics and evidenced the benefit on Si diffusion through the IL, when a third X element like Cr, Ti or Zr has some solubility into γ-U(Mo) alloy. However, some questions remained open, concerning the role played by the addition of an alloying element into γ-U(Mo) alloys. In particular, a possible modification of interaction phases had not been yet investigated.
To get new experimental data about these points, γ-U(Mo,X)/Al and γ-U(Mo,X)/Al(Si) diffusion-couples with X= Cr, Ti, Zr previously characterized by SEM-EDS were studied in reflection mode by diffraction using synchrotron micro focused X-rays (µ-XRD). This experimental strategy has already been applied to the study of γ-U(Mo)/Al [20] and γ-U(Mo)/Al(Si) [11] diffusion-couples. In the present article, the results obtained thanks to this set of characterizations are presented and compared with the γ-U(Mo)/Al and γ-U(Mo)/Al(Si) reference systems.
2. Experimental details
2.1. Materials and diffusion couples
Four U(Mo,X)/Al and four U(Mo,X)/AlSi diffusion couples have been considered in this study. They were taken from a previous work in which an extensive description of their preparation has been provided [19] and are only briefly summarized here. Four Uranium alloys were synthetized: one γ-U(8Mo) (U82Mo18, in atomic percent) reference alloy and three U(Mo,X) alloys with (X= Cr, Ti, Zr), their elemental
composition in atomic percent being U80Mo15X5. They have been heat treated at 900°C during 3 weeks for homogenization. Two types of Al were used in this study: pure Al and a commercial Al 4343 alloy containing 7.3 wt%Si and 0.3 wt% Fe, referred to as AlSi7 in the following (Al93Si7 in atomic percent). Table I gathers all details concerning the composition and metallurgical state of these alloys. Diffusion couple preparation has been performed according to the following procedure [14]: two blocks (one of γ-U(Mo,X) and another of either Al or AlSi7) were mechanically polished down to 1 µm with a diamond suspension. The U(Mo) pellets were embedded into the Al or AlSi7 blocks by cold pressing. These assemblies were wrapped into Ta foils and were maintained under a constant load of about 40 N/m during the heat treatment. This treatment was performed for 2 hours at 600°C in a furnace which ensures an accuracy better than ± 15°C. After annealing, the sample was cut, embedded and polished (using a 1 µm diamond suspension at the ultimate step), to observe the diffusion layer in cross-section. When using AlSi7 alloy, at 600°C, a certain fraction of liquid is expected, since this temperature is above the eutectic one for the Al-Si binary system (577°C). In fact, after heat treatment, no major modification of the AlSi7 alloy sample geometry and a slight coarsening of the lamellar microstructure of the Si precipitates were noticed. These observations suggest that almost no liquid phase was formed during the annealing, probably because of the presence of impurities (i.e. 0.3% Fe) in the alloy.
2.2. Characterizations
Some of microstructural characteristics and concentration profiles of ILs determined by SEM + EDS in the different diffusion couples are described in reference [19]. Main
results are reminded in this study to help for interpreting the complementary analyses by µ-XRD.
The µ-XRD/µ-XRF measurements on ILs were performed in reflection mode, on the ID18f beam line at the ESRF (European Synchrotron Radiation Facility) in Grenoble (France) [21]. The photon energy was set to 28 keV and the beam size on the samples was about 20 x 2 µm² [11][20]. The length of the beam print was positioned parallel to the reaction front and the sample was moved by micrometric steps, perpendicularly to this front, between each acquisition. The angle between the X-ray beam and the sample surface was estimated to 15°.
2.2.1. µ-XRD measurements
Two dimensional diffraction patterns and fluorescence spectra were simultaneously collected. Diffraction patterns were integrated by means of the FIT2D software [22] further analysed using the Rietveld method. A dedicated refinement methodology detailed in a previous study was followed [23]; an automatic procedure has been designed based on the use of the FULLPROF software package [24]. Semi-quantitative phase compositions in the IL are then obtained. The list of phases (and their characteristics) considered in these refinements is given in Table II ([10],[25]‐ [31]).
As already discussed [11], these results can be used to determine an average IL thickness for each diffusion couples. The main source of error here is linked to the difficulty to determine with XRD very accurate quantitative weight fractions at the U(Mo,X)/IL and IL/Al interfaces. Indeed X-ray penetration depths (and absorption), on the one hand, and grain sizes, on the other hand, strongly differ in these three parts of diffusion couples. Indeed this diffraction technique fails to accurately characterize
Al and U(Mo) fractions because of their coarse grains. Finally µ-XRD is more sensitive to IL irregularities (as observed in U(Mo,Zr)/Al diffusion couple for instance) since the horizontal size of the beam is relatively large (i.e. 20 µm) and since the 28 keV X-ray beam has a non-negligible penetration depth inside the IL (from a few micrometers (in U(Mo,X)) up to a few hundreds of micrometres in Al).
An additional consequence of the much higher penetration depth of these X-rays in the Al (or Al(Si)) than in the IL, is the apparent difficulty for defining the interface between the IL and Al (or Al(Si)) which should appear very smooth with respect to vertical position (i.e. IL growth direction). This interface is taken at the location where Al concentration becomes significant rather than where the IL components fully disappear.
2.2.2. µ-XRF measurements
The fluorescence spectra were automatically treated using the Pymca software [32] and qualitative information about U and Mo elemental content in the IL have been derived. Since U and Mo profiles appeared systematically identical throughout the IL, only uranium profiles (i.e. ULα1 emission line integrated intensity) are reported here. As diffusion couples had to be packed under kapton tape (for safety reasons), Cr, Ti, Al and Si emission lines could not be recorded.
3. Results
Results obtained by SEM + EDS and μ-XRD/µ-XRF on diffusion couples made with Al and Al(Si) alloys are summarized in Figure 1 to Figure 5 and in Figure 8 to Figure 11 respectively.
For each diffusion couple, microstructure and elemental composition profiles are presented on the left hand side of the Figures. Distributions throughout the IL of major phases are illustrated in the middle part of each figure: weight fractions of each interaction phase are plotted versus the distance from U(Mo) alloy. A simplified view of the results is finally presented on the right hand side of each figure. In this last scheme, the localization of interaction phases, the total thickness of interaction layer and the relative thickness of each interaction sub-layer are mentioned. Refined lattice constants of the intermediate phases of the interaction product are gathered in Table III and Table IV for U(Mo,X)/Al and U(Mo,X)/Al(Si) diffusion couples respectively.
3.1. Diffusion couples with pure Al 3.1.1. U(Mo)/Al reference
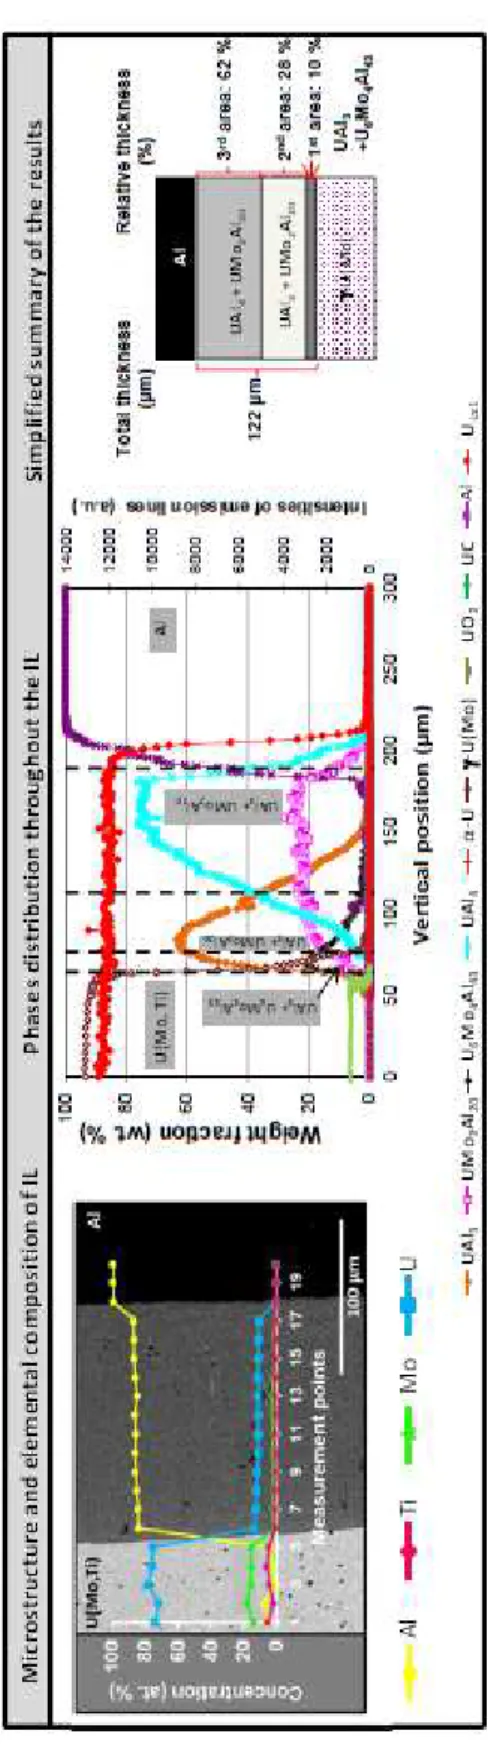
SEM+EDS characterizations on U(Mo)/Al reference highlight an increase of the Al-to (U+Mo) atomic ratio when moving from the U(Mo) to the Al side within the IL, which exhibits a composition ratio equivalent to that of UAl4.
The μ-XRD analysis of this couple reveals three main sub-layers in the IL starting from the U(Mo) side (see Figure 1):
- a first sub-layer, containing the UAl3 phase in coexistence with the U6Mo4Al43 phase, - a second sub-layer, intermediate, containing the UAl3 phase, coexisting with the UMo2Al20 phase,
- a third sub-layer, close to Al, containing the UAl4 phase in coexistence with the UMo2Al20 phase.
Lattice constants for the four crystallographic phases have been found constant throughout the IL (see Table III). These results are fully consistent with literature data [20][33].
3.1.2. U(Mo,X)/Al diffusion couples
Except for X = Zr, SEM micrographs collected in back-scattered electron mode do not show any particular stratification or elemental composition modification with respect to the IL in U(Mo)/Al. The Al/(U+Mo+X) ratio remains close to 4 as for the U(Mo)/Al reference couple (see Figure 2 and Figure 3).
In the case of U(Mo,Zr)/Al diffusion couple, two types of interaction features are encountered. The first kind of IL is characterized by an uniform thickness and does exhibit a plane front-growth morphology (see Figure 4). The second one (see Figure 5) is characterized by an irregular interaction propagation, which can be considered as a columnar dendritic growth process.
These two features are presumably correlated to the metallurgical state of the -U(Mo,Zr) phase, as already observed by Mirandou et al. [33] and E. Perez et al. [34]) on U(Mo)/Al diffusion couples. Indeed, when the U(Mo) alloy was found to retain the -U form (high temperature, bcc form) regular IL zones grew, whereas irregular ones (with more likely cellular/ laminar morphology) grew on destabilized areas (α-U and U2Mo or -U(Mo) enriched in Mo). Unfortunately, μ-XRD characterizations failed to clearly demonstrate the direct correlation between local destabilizations of -U(Mo,Zr) alloy with the thickness and morphology of the interaction areas. Indeed, a small amount of phase α-U was detected in both, fine and thick areas (see Figure 4 and Figure 5).
ILs total thicknesses, as measured by SEM and µ-XRD in the U(Mo,X)/Al diffusion couples are recapped and compared in Figure 6. The obtained values present a reasonable agreement, discrepancies being mainly attributed to limitations of μ-XRD for these measurements (see section 2.2.1). They allow to conclude that alloying has a certain effect on the reduction of the kinetics of the IL’s growth.
Crystallographic composition
μ-XRD characterizations of U(Mo,X)/Al diffusion couples do not evidence the formation of new phases in the interaction layer, compared to those identified in a regular U(Mo)/Al system. In fact U(Mo,X)/Al diffusion couples with X = Cr, Ti, Zr develop three sub-layers, each of them containing the phases previously identified in the reference U(Mo)/Al sample. Moreover the localization of phases within ILs also appears with a similar sequence as that observed in the reference system.
When comparing the lattice constants from one diffusion couple to another, no significant difference can be found for UAl3 and U6Mo4Al43 (see Table III). However, some fluctuations in lattice constants exceeding estimated uncertainties (±0.01 Å) can be mentioned for UAl4 and UMo2Al20. Since the UMo2Al20 crystal structure is cubic whereas UAl4 is orthorhombic, the measured variation in UMo2Al20 lattice constants can be considered as more reliable. For U(Mo,Ti)/Al and U(Mo,Cr)/Al diffusion couples, the measured UMo2Al20 lattice constant is lower than one found in regular U(Mo)/Al interaction. This could suggest an influence of Cr or Ti elements on the UMo2Al20 crystal structure in U(Mo,Cr)/Al and U(Mo,Ti)/Al diffusion couples. The existence of UTi2Al20 and UCr2Al20 ternary compounds has been reported (see Table II). The UTi2Al20 cell parameter being much larger than the one measured for the
UMo2Al20 type phase in the U(Mo,Ti)/Al diffusion couple (14.46 versus 14.60 Å), it is very unlikely that this phase is present in the sample. However in the case of U(Mo,Cr)/Al diffusion couple, the measured lattice constant for UMo2Al20 is intermediate between values reported for pure UMo2Al20 and UCr2Al20; this could be in agreement with the presence of some Cr in this crystal structure.
The case of Zr addition to U(Mo) for which lattice constants are found very close to the expected ones for UAl4 and UMo2Al20 is easier to describe (compare Table II and Table III): these µ-XRD experiments do not provide indications for the Zr location inside the IL. More generally it must be mentioned that the components identified in the U(Mo,Zr)/Al irregular interdiffusion layer are identical to those reported earlier in the analysis of a very similar system (U(Mo,Zr)/Al diffusion couple annealed at 550°C during 1.5 hours) [15].
Unfortunately because of the low concentrations of X element in the U(Mo,X)/Al diffusion couples, this µ-XRD study only allows to propose hypotheses regarding the location of X element inside ILs.
Sub-layer thicknesses
The addition of X elements in U(Mo) alloys appears to have a significant influence on two aspects characterising U(Mo,X)/Al interactions: the relative thicknesses of sub-layers (see Figure 7) and the relative phase fractions within sub-sub-layers.
Chromium is the element that seems to cause the weakest changes in terms of crystallographic composition with relative thicknesses of the sub-layers in the IL, which are found quite close to those measured on the reference diffusion couple.
U(Mo,Ti)/Al diffusion couple develops a lower relative thickness of the sub-layer containing the phases UAl3 and U6Mo4Al43, than in the reference sample. Conversely, it develops a greater relative thickness of the sub-layer containing the UAl4 and UMo2Al20 phases. For U(Mo,Zr)/Al diffusion couple, in the "regular IL configuration" for which it is assumed that the alloy U(Mo,Zr) remained in its bcc form, the sub-layer containing the UAl3 and U6Mo4Al43 phases does virtually not exist whereas the other one containing the UAl3 and UMo2Al20 phases is highly developed. Finally, the relative thickness of the sub-layer containing the UMo2Al20 and UAl4 phases is quite similar to that developed in the reference sample. In the same couple, but in the "irregular IL configuration" (not shown in Figure 7), it was found that the propagation of the IL within the U(Mo,Zr) alloy mainly consists in UAl3 and U6Mo4Al43 phases. This IL composition is very close to the one reported in a U(Mo)/Al diffusion couple prepared with a destabilised U(Mo) sample [33].
3.2. Diffusion couples with Al(Si) alloy 3.2.1. U(Mo)/Al(Si) reference
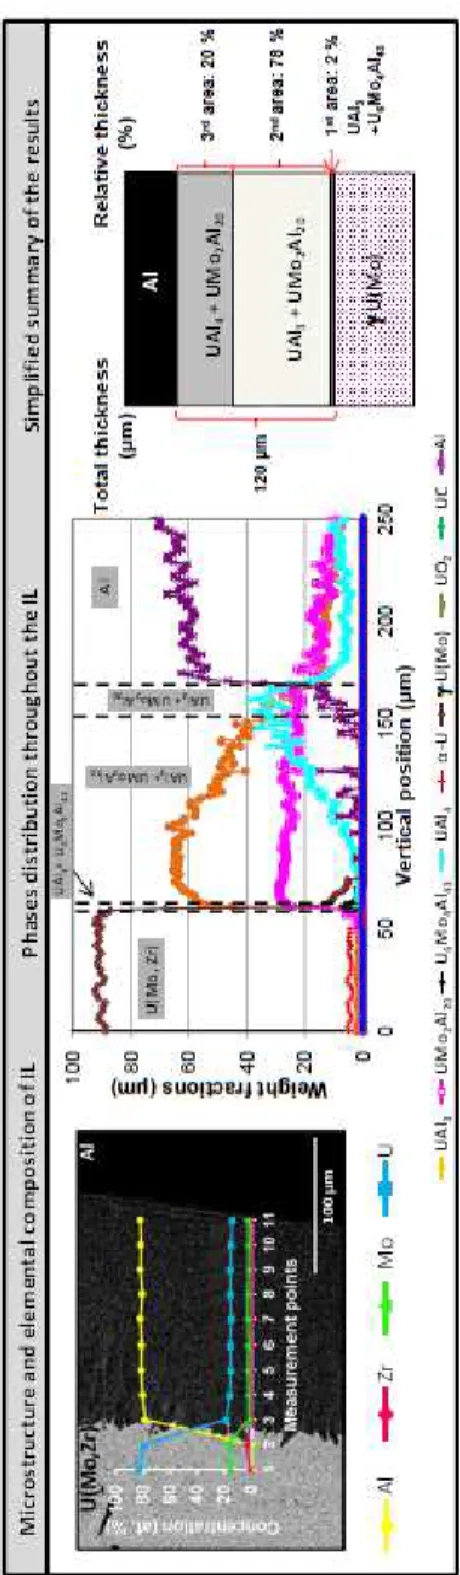
In presence of Al(Si) alloy, a significant reduction of the IL thickness is observed for the γ-U(Mo)/Al(Si) reference couple: it is of the order of 40 µm, instead of 200 µm for U(Mo)/Al diffusion couple. From the observations of the IL microstructure (SEM) and elemental compositions (EDS), two sub-layers can be defined:
- a first sub-layer, on the γ-U(Mo) alloy side, about 10 µm thick, with a Si content of the order of 45 at.%,
- a second sub-layer, on the Al(Si) alloy side, about 30 µm thick, with a Si content of 20 at.% in average.
These results are in agreement with available literature data [10][11][35]. The existence of these two sub-layers is confirmed by μ-XRD:
- a first sub-layer, close to U(Mo) alloy, which contains the silicides U3Si5 and U4Mo(MoxSi1-x)Si2, as recently identified in the same type of system [35],
- a second sub-layer, close to Al(Si) alloy, which contains the U(Al,Si)3 and UMo2Al20 phases. Recent TEM investigations have shown that solubility limit of Si in UMo2Al20 is almost null whereas Mo solubility could be increased in U(Al,Si)3 compared to UAl3 [17].
Lattice constants for U3Si5, U4Mo(MoxSi1-x)Si2 and UMo2Al20 measured here (see Table III) are found in good agreement with those reported in literature (see for example [35]). Concerning U(Al,Si)3, its lattice constant is known to depend on Si concentration. In this reference sample, it equals 4.19 Å which means that about 32% of Si atoms occupy Al sites in the UAl3 crystal structure [30]. Contrary to that of other phases inside the IL, the U(Al,Si)3 lattice constant varies: it definitely increases from the Al(Si) towards U(Mo) side by 0.01 Å.
Contrary to our previous work on very similar diffusion couple [35], the existence of a second U(Al,Si)3 phase with a smaller lattice constant (i.e. 4.15 Å) has not been evidenced. This is tentatively attributed to the limited thickness of the IL as compared to our previous sample. This remark is also in agreement with the somewhat limited thickness of the Si precipitate free zone (PFZ) in Al(Si) close to the IL. This PFZ is known to appear as a result of the Si diffusion in the IL (towards) U(Mo) [10]. Thickness of these zones is given in Table V. The reported values have been
obtained using µ-XRD and not by optical microscopy as often used for such analysis. Indeed this PFZ was too thin to be studied accurately with this technique. Note finally that this PFZ is generally much higher than the IL thickness [10], which is not the case in the diffusion couples studied here. Komar-Varela et al. have attributed this effect to the high temperatures chosen for annealing the diffusion couples: during the heat treatment (above a so called solution temperature) Si precipitates dissolve but re-precipitate during the cooling step down to room temperature [36]. To definitely confirm this hypothesis, XRD experiments should be performed in-situ during annealing at 600°C on this AlSi7 alloy.
3.2.2. U(Mo,X)/Al(Si) with X= Cr, Ti, Zr diffusion couples
Crystallographic composition
For all U(Mo,X)/Al(Si) diffusion couples with X = Cr, Ti and Zr, two main sub-layers are also evidenced in the IL (see Figure 9 to Figure 11):
- a first sub-layer, close to U(Mo) alloy, contains the U3Si5 and U4Mo(MoxSi1-x)Si2 phases,
- a second one, close to Al(Si) alloy, contains the U(Al,Si)3 and UMo2Al20 phases. These results, in terms of IL crystallographic composition are consistent with those obtained on U(Mo)/Al(Si) reference couple. Note that for the U(Mo,Zr)/Al(Si) diffusion couple, no evidence for the presence of the Zr5Al3 phase could be found neither in the first sub-layer (together with U3Si5 as suggested in [15]) nor in the second sub-layer.
As shown in Table IV, lattice constants for U3(Si,Al)5, U4Mo(MoxSi1-x)Si2 and UMo2Al20 do not evolve significantly with the nature of X element; the refined values are also quite close from those found in the reference couple.
A slight increase (0.01 Å) of the U(Al,Si)3 lattice constant in the vicinity of the U(Mo,X) part is also evidenced, as reported above on the U(Mo)/Al(Si) diffusion couple. Finally, only in the case of the U(Mo,Zr)/Al(Si) diffusion couple the existence of a second U(Al,Si)3 phase with a smaller lattice constant (4.15 Å) could be established in agreement with a previous work [35]. The reason for the presence of this second U(Al,Si)3 phase remains unclear at this point but could be related to the solubility of Mo (i.e. (U, Mo)(Al,Si)3 phase).
Si precipitate free zones in the Al(Si) alloy are too thin to be identified by µ-XRD U(Mo,Cr)/Al(Si) whereas a larger one has been found in U(Mo,Ti)/Al(Si) and U(Mo,Zr)/Al(Si). Once again the occurrence of such PFZ can be most probably correlated with the thickness of ILs in associated diffusion couples.
Sub-layer thicknesses
Figure 12 represents the IL total thickness, as measured by SEM and µ-XRD, in U(Mo,X)/Al(Si) diffusion couples.
The differences between IL thicknesses measured by these two methods are slightly higher than those found for U(Mo,X)/Al samples (see Figure 6). This may be related to the smaller thickness of IL in these diffusion couples (it does not exceed 50 µm), which probably affects the measurements accuracy. Despite these slight differences, U(Mo,X)/Al(Si) diffusion couples can be compared to the reference: a slight decrease of IL thickness is observed for the U(Mo,Cr)/Al(Si) diffusion couple, whereas a reduction of about 50% of the total thickness is noticed for U(Mo,Ti)/Al(Si) and
U(Mo,Zr)/Al(Si) (in regular IL configuration) couples. The U(Mo,Zr)/Al(Si) irregular IL configuration could not be characterized by μ-XRD on a sufficiently large area. The relative thicknesses of each sub-layer, estimated by μ-XRD are presented in Figure 13.
As in the case of U(Mo,X)/Al diffusion couple, the relative thicknesses of the sub-layers depend on the nature of X element. The U(Mo,Cr)/Al(Si) couple develops a very thin first sub-layer containing the silicide phases: it is estimated at about 6 % of the IL total thickness.
For the U(Mo,Ti)/Al(Si) sample, compared to the reference, similar sub-layers relative thicknesses are measured even if the total IL thickness is significantly lower.
In the case of U(Mo,Zr)/Al(Si) diffusion couple (in regular IL configuration), a reduction of IL thickness of the same order of magnitude as for U(Mo,Ti)/Al(Si) sample is observed, but it seems to develop a larger first sub-layer containing the silicide phases (in relative thickness).
4. Conclusion and outlooks
The present work investigated the influence of X element addition to U(Mo, X) alloys with X = Cr, Ti, Zr, by means of SEM-EDS, µ-XRF and µ-XRD characterizations performed on the interaction layers of U(Mo,X)/Al and U(Mo,X)/Al(Si) diffusion couples, heat-treated at 600°C for 2 hours.
The most efficient element for reducing the U(Mo,X)/Al IL thickness is clearly Ti or Zr when it has been possible to retain the -U allotropic form which is very difficult under
the chosen annealing conditions. The same conclusion has been obtained after comparison of the IL thicknesses in U(Mo,X)/AlSi diffusion couples.
The μ-XRD characterizations of U(Mo,X)/Al and U(Mo,X)/Al(Si) diffusion couples did not evidence any new phases formation in the interaction layer, as compared to those identified in U(Mo)/Al [20][33] and U(Mo)/Al(Si) systems [36] (and even [10][11] if one disregards the specific case of the U4Mo(MoxSi1-x)Si2 phase). Compared to the reference systems, the localization of phases within IL also appears unchanged; the main modifications concern the relative fractions of the intermediate phases within each sub-layer. Location of the X elements inside the IL remained very challenging. It should be mentioned that the previous descriptions of U(Mo)/Al and U(Mo)/Al(Si)reference systems are confirmed by a large number of diffusion couple analysis (4 in each case). Note also that the diffusion couples included in these different systems have not strictly been prepared using the same methods. As a consequence, these experiments provide an interesting statistics which indicate that these descriptions are reproducible and robust.
Future work in this field should first deal with characterizations by TEM/STEM/EDS on U(Mo,X)/Al and U(Mo,X)/Al(Si) couples in order to localize the X element in the IL and to provide a better understanding of the interaction mechanism. Note that the technical feasibility of such analyses has already been proven on samples with very close compositions [17][34][35][37].
Secondly it should be investigated whether the microstructure of the U(Mo) (or U(Mo,X)) alloy has any influence on ILs crystallographic composition. Even if a first answer has been proposed in the analysis of annealed fuel rods [38], a more systematic study is required.
Acknowledgments:
C. Jarousse and M. Grasse, from AREVA-CERCA (Romans, France) are gratefully acknowledged for supplying the U(Mo) samples used in this study. Authors thank the ESRF for beamtime provision as well one of the referees for very constructive remarks.
REFERENCES
[1] J.L. Snelgrove, G.L. Hofman, M.K. Meyer, C.L. Trybus, T.C. Wiencek, Nucl. Eng Design 178 (1997) 119.
[2] M.K. Meyer, G.L. Hofman, S.L. Hayes, C.R. Clark, T.C. Wiencek, J.L. Snelgrove, R.V. Strain, K.H. Kim, J. Nucl. Mater. 304 (2002) 221.
[3] G.L. Hofman, Y.S. Kim, M.R. Finlay, J.L. Snelgrove, C. Clark, in: Proceedings 2003 International RERTR Meeting, Chicago, IL, USA, 2003.
[4] A. Leenaers, S. Van den Berghe, E. Koonen, C. Jarousse, F. Huet, M. Trotabas, M.Boyard, S. Guillot, L. Sannen, M. Verwerft, J. Nucl. Mater. 335 (2004) 39.
[5] A. Leenaers, S. Van den Berghe, W. Van Renterghem, F. Charollais, P. Lemoine, C. Jarousse, A. Röhrmoser, W. Petry, J. Nucl. Mater. 412 (2011) 41.
[6] D.D. Keiser, A.B. Robinson, J.F. Jue, P. Medvedev, D.M. Wachs, M.R. Finlay, J. Nucl. Mater. 393 (2009) 311.
[7] M. Ripert, S. Dubois, P. Boulcourt, S. Naury, P. Lemoine, in: Proceedings of the 10th International Topical Meeting on Research Reactor Fuel Management (RRFM), Sofia, Bulgaria, 2006.
[8] Y.S. Kim J.M. Park, H.J. Ryu, Y. H. Jung, G.L. Hofman, J. Nucl. Mater., 430 (2012) 50. [9] Y.S Kim, G.L. Hofman, A.B. Robinson, D.M. Wachs, H.J. Ryu, J.M. Park, J.H. Yang, J. Nucl. Mater. 427 (2012) 233.
[10] M. Mirandou, S. Arico, M. Rosenbusch, M. Ortiz, S. Balart, L. Gribaudo, J. Nucl. Mater. 384 (2009) 268. s
[11] J. Allenou, H. Palancher, X. Iltis, M. Cornen, O. Tougait, R. Tucoulou, E. Welcomme, Ph. Martin, C. Valot, F. Charollais, M.C. Anselmet, P. Lemoine, J. Nucl. Mater. 399 (2010) 189. [12] J. Gan, D. Keiser, D. Wachs, B. Miller, T. Allen, M. Kirk, J. Rest, J. Nucl. Mater. 411 (2011) 174–180.
International Topical Meeting on Research Reactor Fuel Management, Lyon, France, 2007. [14] J.M. Park, H.J. Ryu, S.J. Oh, D.B. Lee, C.K. Kim, Y.S. Kim, G.L. Hofman, J. Nucl. Mater., 374 (2008) 422.
[15] C. Komar Varela, M. Mirandou, S. Aricó, S. Balart, L. Gribaudo, J. Nucl. Mater. 395 (2009) 162.
[16] G.L. Hofman, Y.S. Kim, J. Rest, A.B. Robinson, D.M. Wachs, in: 12th International Topical Meeting on Research Reactor Fuel Management, Hamburg, Germany, 2008.
[17] E. Perez, Y. H. Sohn, D.D. Keiser, Metallurgical and materials transactions A -Physical Metallurgy and Material Science, 44A (2013) 584.
[18] J. Allenou, Ph.D. thesis, Rennes 1 university (France) (2011).
[19] J. Allenou, O. Tougait, M. Pasturel, X. Iltis, F. Charollais, M.C. Anselmet, P. Lemoine, J. Nucl. Mater. 416 (2011) 205.
[20] H. Palancher, P. Martin, V. Nassif, R. Tucoulou, O. Proux, J. Hazemann, O. Tougait, E. Lahera, F. Mazaudier, C. Valot, S. Dubois, J. Appl. Crystallogr. 40 (2007) 1064.
[21] A. Somogyi, M. Drakopoulos, L. Vincze, B. Vekemans, C. Camerani, K. Janssens, A. Snigirev, F. Adams, X-Ray Spectrom. 30 (2001) 242.
[22] H. Hammersley (1999), http://www.esrf.eu/computing/scientific/FIT2D/.
[23] H. Palancher, R. Tucoulou, P. Bleuet, A. Bonnin, E. Welcomme, P. Cloetens, J.Appl. Crystallogr. 44 (2011) 1111.
[24] J. Rodriguez-Carvajal, Commission on Powder Diffraction (IUCr), Newsletter 26 (2001) 12.
[25] M. Hansen and K. Anderko, Constitution of Binary Alloys, McGraw-Hill, New York (1958).
[27] S. Niemann, W. Jeitschko, J. Solid State Chem., 114 (1995) 337.
[28] K. Okuda, S. Noguchi, Y. Nakazawa, M. Ishikawa, J. Phys. Soc. Jpn. 58 (1989) 4296.
[29] S. Niemann, W. Jeitschko, Z. Metallkd, 85 (1994) 345.
[30] A.E. Dwight, ANL 82–14 report, September 1982.
[31] B. Aronsson, Acta Chem. Scand. 9 (1955) 1107.
[32] V.A. Solé, E. Papillon, M. Cotte, Ph. Walter, J. Susini, Spectrochim. Acta B62 (2007) 63.
[33] M. Mirandou, S.N. Balart, M. Ortiz, M.S. Granovsky, J. Nucl. Mater. 323 (2003) 29.
[34] E. Perez, D.D. Keiser, Y-H. Sohn, Metallurgical and materials transactions A -Physical metallurgy and material science, 42A (2011) 3071.
[35] X. Iltis, J. Allenou, B. Verhaeghe, H. Palancher, O. Tougait, A. Bonnin, R. Tucoulou, J. Nucl. Mater. 433 (2013) 255.
[36] M. Mirandou, S. Aricó, S. Balart, L. Gribaudo, Materials Characterization 60 (2009) 888.
[37] E. Perez, A. Ewh, J. Liu, B. Yuan, D.D. Keiser Jr., Y.H. Sohn, J. Nucl. Mater. 394 (2009) 160
[38] W.J. Kim, H. Palancher, J.M. Nam, H.J. Ryu, J. M. Park, A. Bonnin, V. Honkimäki, F. Charollais, P. Lemoine, J. Alloys and compounds (2013), submitted.
TABLE CAPTIONS
Table I: Elemental compositions and homogenization thermal treatment of uranium and aluminium based alloys.
Table II: Space group, crystal structure and lattice parameters of phases in the U-Mo-Al ternary and U-Mo-U-Mo-Al-Si quaternary systems relevant for the description of U (Mo,X)/Al and U(Mo,X)/Al(Si) interaction products ([10],[25]-[31])
Table III: Lattice constants of the phases present inside the IL for the four U(Mo,X)/Al diffusion couples. Uncertainties are ± 0.01 Å.
Table IV: Lattice constants of the phases present inside the IL for the four U(Mo,X)/AlSi diffusion couples. Uncertainties are ± 0.01 Å except for U(Al,Si)3 whose uncertainty is given in the text.
Table V: Thickness of the Si free zone in the Al(Si) matrix as determined by µ-XRD
FIGURE CAPTIONS
Figure 1: SEM and µ-XRD analysis of a U(Mo)/Al diffusion couple annealed at 600°C for 2 h. Major phases distribution throughout the IL and a simplified summary of the results are presented.
Figure 2: SEM and µ-XRD analysis of a U(Mo,Cr)/Al diffusion couple annealed at 600°C for 2 h. Major phases distribution throughout the IL and a simplified summary of the results are presented.
Figure 3: SEM and µ-XRD analysis of a U(Mo,Ti)/Al diffusion couple annealed at 600°C for 2 h. Major phases distribution throughout the IL and a simplified summary of the results are presented.
Figure 4: SEM and µ-XRD analysis of a U(Mo,Zr)/Al diffusion couple annealed at 600°C for 2 h. Major phases distribution throughout the IL and a simplified summary of the results are presented.
Figure 5: SEM and µ-XRD analysis of a U(Mo,Zr)/Al diffusion couple (with decomposed -U(Mo,Zr)) annealed at 600°C for 2 h. Major phases distribution throughout the IL and a simplified summary of the results are presented.
Figure 6: Total thicknesses measurements of ILs determined by SEM and µ-XRD for U(Mo,X)/Al diffusion couples, compared to the U(Mo)/Al reference couple.
Figure 7: IL relative thickness as determined by µ-XRD in U(Mo,X)/Al diffusion couples annealed at 600°C for 2 h with X = Cr, Ti, Zr.
Figure 8: SEM and µ-XRD analysis of a U(Mo)/Al(Si) diffusion couple annealed at 600°C for 2 h. Major phases distribution throughout the IL and a simplified summary of the results are presented.
Figure 9: SEM and µ-XRD analysis of a U(Mo,Cr)/Al(Si) diffusion couple annealed at 600°C for 2 h. Major phases distribution throughout the IL and a simplified summary of the results are presented.
Figure 10: SEM and µ-XRD analysis of a U(Mo,Ti)/Al(Si) diffusion couple annealed at 600°C for 2 h. Major phases distribution throughout the IL and a simplified summary of the results are presented.
Figure 11: SEM and µ-XRD analysis of a U(Mo,Zr)/Al(Si) diffusion couple annealed at 600°C for 2 h. Major phases distribution throughout the IL and a simplified summary of the results are presented.
Figure 12: ILs total thickness as determined by SEM and µ-XRD for U(Mo,X)/Al(Si) diffusion couples, compared to the U(Mo)/Al(Si) reference couple.
Figure 13: ILs relative thickness as determined by µ-XRD in U(Mo,X)/Al(Si) diffusion couples annealed at 600°C for 2 h with X = Cr, Ti, Zr.
Alloys Composition (wt.%) Composition (at.%) Homogenization thermal treatments U(Mo) U(Mo,Cr) U(Mo,Ti) U(Mo,Zr) U92 Mo8 U91.8 Mo6.9 Cr1.3
U91.9 Mo6.9 Ti1.2 U90.9 Mo6.9 Zr2.2
U82 Mo18 U80 Mo15 Cr5
U80 Mo15 Ti5 U80 Mo15 Zr5 3 weeks at 900°C Al Al(Si) Al 100 Al93 Si7 Al 100 Al93.1 Si6.9
Table I: Elemental compositions and homogenization thermal treatment of uranium and aluminium based alloys.
Lattice constant (Å) Crystal system Space group a b c Reference UAl3 cubic P m 3 m 4.266 4.266 4.266 [25] UAl4 orthorhombic I m m a 4.401 6.255 13.728 [26] UMo2Al20 cubic F d 3 m 14.506 14.506 14.506 [27] UTi2Al20 cubic F d 3 m 14.619 14.619 14.619 [27] UCr2Al20 cubic F d 3 m 14.40 14.40 14.40 [28] U6Mo4Al43 hexagonal P 6 3/m c m 10.966 10.966 17.69 [29] U3Si5 hexagonal P 6/m m m 3.896 3.896 4.017 [30] U3(Si1-x,Alx)5 hexagonal P 6/m m m 3.92 3.92 4.05 [10] U4Mo(MoxSi
1-x)Si2
tetragonal I 4/m c m 10.694 10.694 5.32 [31]
Table II: Crystal system, space group and lattice constants of phases in the U-Mo-Al ternary and U-Mo-Al-Si quaternary systems relevant for the description of U (Mo,X)/Al and
Lattice constants (Å)
UAl3 UAl4 UMo2Al20 U6Mo4Al43
a 4.27 4.40 14.51 10.97 b 4.27 6.26 14.51 10.97 U(Mo)/Al c 4.27 13.73 14.51 17.69 a 4.27 4.39 14.46 10.97 b 4.27 6.23 14.46 10.97 U(Mo,Ti)/Al c 4.27 13.76 14.46 17.69 a 4.27 4.40 14.46 10.97 b 4.27 6.26 14.46 10.97 U(Mo,Cr)/Al c 4.27 13.73 14.46 17.69 a 4.27 4.42 14.52 10.97 b 4.27 6.27 14.52 10.97 U(Mo,Zr)/Al c 4.27 13.75 14.52 17.69
Table III: Lattice constants of the phases present inside the IL for the four U(Mo,X)/Al diffusion couples. The estimated deviation is lower than ± 0.01 Å.
Lattice constants (Å)
U(Al,Si)3 U(Al,Si)3 UMo2Al20 U3(Si,Al)5 U4Mo(MoxSi1-x)Si2
a 4.19 --- 14.51 3.92 10.71 b 4.19 --- 14.51 3.92 10.71 U(Mo)/Al(Si) c 4.19 --- 14.51 4.02 5.34 a 4.19 --- 14.51 3.92 10.71 b 4.19 --- 14.51 3.92 10.71 U(Mo,Ti)/Al(Si) c 4.19 --- 14.51 4.02 5.34 a 4.20 --- 14.51 3.92 10.71 b 4.20 --- 14.51 3.92 10.71 U(Mo,Cr)/Al(Si) c 4.20 --- 14.51 4.02 5.34 a 4.19 4.15 14.51 3.92 10.71 b 4.19 4.15 14.51 3.92 10.71 U(Mo,Zr)/Al(Si) c 4.19 4.15 14.51 4.02 5.34
Table IV: Lattice constants of the phases present inside the IL for the four U(Mo,X)/AlSi diffusion couples. The estimated deviation is lower than 0.01Å.
Si Precipitate Free zone thickness (µm) U(Mo)/Al(Si) 15 U(Mo,Ti)/Al(Si) 5 U(Mo,Cr)/Al(Si) --- U(Mo,Zr)/Al(Si) 20
Figure 1: SEM and µ-XRD analysis of a U(Mo)/Al diffusion couple annealed at 600°C for 2 h. Major phases distribution throughout the IL and a simplified summary of the results are presented.
Figure 2: SEM and µ-XRD analysis of a U(Mo,Cr)/Al diffusion couple annealed at 600°C for 2 h. Major phases distribution throughout the IL and a simplified summary of the results are presented.
Figure 3: SEM and µ-XRD analysis of a U(Mo,Ti)/Al diffusion couple annealed at 600°C for 2 h. Major phases distribution throughout the IL and a simplified summary of the results are presented.
Figure 4: SEM and µ-XRD analysis of a U(Mo,Zr)/Al diffusion couple annealed at 600°C for 2 h. Major phases distribution throughout the IL and a simplified summary of the results are presented.
Figure 5: SEM and µ-XRD analysis of a U(Mo,Zr)/Al diffusion couple (with decomposed -U(Mo,Zr)) annealed at 600°C for 2 h. Major phases distribution throughout the IL and a simplified summary of the results are presented.
Figure 6: Total thicknesses measurements of ILs determined by SEM and µ-XRD for U(Mo,X)/Al diffusion couples, compared to the U(Mo)/Al reference couple.
Figure 7: IL relative thickness as determined by µ-XRD in U(Mo,X)/Al diffusion couples annealed at 600°C for 2 h with X = Cr, Ti, Zr.
Figure 8: SEM and µ-XRD analysis of a U(Mo)/Al(Si) diffusion couple annealed at 600°C for 2 h. Major phases distribution throughout the IL and a simplified summary of the results are presented.
Figure 9: SEM and µ-XRD analysis of a U(Mo,Cr)/Al(Si) diffusion couple annealed at 600°C for 2 h. Major phases distribution throughout the IL and a simplified summary of the results are presented.
Figure 10: SEM and µ-XRD analysis of a U(Mo,Ti)/Al(Si) diffusion couple annealed at 600°C for 2 h. Major phases distribution throughout the IL and a simplified summary of the results are presented.
Figure 11: SEM and µ-XRD analysis of a U(Mo,Zr)/Al(Si) diffusion couple annealed at 600°C for 2 h. Major phases distribution throughout the IL and a simplified summary of the results are presented.
Figure 12: ILs total thickness as determined by SEM and µ-XRD for U(Mo,X)/Al(Si) diffusion couples, compared to the U(Mo)/Al(Si) reference couple.
Figure 13: ILs relative thickness as determined by µ-XRD in U(Mo,X)/Al(Si) diffusion couples annealed at 600°C for 2 h with X = Cr, Ti, Zr.