HAL Id: hal-00328334
https://hal.archives-ouvertes.fr/hal-00328334
Submitted on 27 Feb 2003
HAL is a multi-disciplinary open access
archive for the deposit and dissemination of
sci-entific research documents, whether they are
pub-lished or not. The documents may come from
teaching and research institutions in France or
abroad, or from public or private research centers.
L’archive ouverte pluridisciplinaire HAL, est
destinée au dépôt et à la diffusion de documents
scientifiques de niveau recherche, publiés ou non,
émanant des établissements d’enseignement et de
recherche français ou étrangers, des laboratoires
publics ou privés.
Aerosol sources and their contribution to the chemical
composition of aerosols in the Eastern Mediterranean
Sea during summertime
J. Sciare, H. Bardouki, C. Moulin, N. Mihalopoulos
To cite this version:
J. Sciare, H. Bardouki, C. Moulin, N. Mihalopoulos. Aerosol sources and their contribution to the
chemical composition of aerosols in the Eastern Mediterranean Sea during summertime. Atmospheric
Chemistry and Physics, European Geosciences Union, 2003, 3 (1), pp.291-302.
�10.5194/acp-3-291-2003�. �hal-00328334�
Atmos. Chem. Phys., 3, 291–302, 2003
www.atmos-chem-phys.org/acp/3/291/
Atmospheric
Chemistry
and Physics
Aerosol sources and their contribution to the chemical composition
of aerosols in the Eastern Mediterranean Sea during summertime
J. Sciare1, H. Bardouki2, C. Moulin1, and N. Mihalopoulos21LSCE, Orme des Merisiers, Bat 709, CE Saclay, 91191 Gif-sur-Yvette Cedex, France
2Environmental Chemical Processes Laboratory, Department of Chemistry, University of Crete, P.O. Box 1470, 71409 Heraklion, Greece
Received: 2 July 2002 – Published in Atmos. Chem. Phys. Discuss.: 5 September 2002 Revised: 13 January 2003 – Accepted: 11 February 2003 – Published: 27 February 2003
Abstract. A detailed study on the temporal variability of
compounds important in controlling aerosol chemical com-position was performed during a one-month experiment con-ducted during summer 2000 at a background site on Crete, in the Eastern Mediterranean Sea. Contribution of different aerosol sources in the Eastern Mediterranean Basin could be investigated at this location since the site is influenced by a wide range of air masses originating mainly in Europe and Africa. Chemical apportionment was performed for vari-ous air mass origins and showed a strong impact of anthro-pogenic emissions in the Turkey and Central Europe sectors, with black carbon (BC) and non-sea-salt sulfate (nss-SO4) concentrations higher than observed in the Eastern and West-ern Europe sectors. High levels of non-sea-salt calcium (nss-Ca) were associated with air masses from Africa but also from Central Turkey. Evidence was found that BC calcula-tion based on light absorbance during dust events was biased. This quality-controlled high temporal resolution dataset allowed to investigate in detail the source-receptor relation-ships responsible for the levels of BC, nss-SO4 and sulfur dioxide (SO2), observed in Crete. Among the results ob-tained from this model, the major contribution of Turkey and Central Europe was confirmed in terms of anthropogenic emissions. Comparisons with remote optical properties ob-tained from Satellite observations (SEAWIFS) north of Crete indicates that our ground based aerosol characterization was suitable for describing aerosol properties in the atmospheric column for most of the time during the campaign.
1 Introduction
Climate forcing by anthropogenic tropospheric aerosols re-mains one of the largest uncertainties in climate variability
Correspondence to: N. Mihalopoulos
(Mihalo@chemistry.uoc.gr)
and climate change studies (IPCC, 2001). Radiative forc-ing of natural and anthropogenic aerosols exhibits a strong seasonal and geographical variability and locally can even be higher than that of greenhouse gases (Ramanhatan et al., 2001). The magnitude and sign of aerosol forcing depend on both aerosol optical thickness (AOT) and single scattering albedo (ω0), determined by aerosol distribution and chemical composition.
Aerosol optical properties derived from the Advanced Very High Resolution Radiometer (AVHRR) classified the Mediterranean Sea as one of the areas with the highest aerosol optical depths in the world (Husar et al., 1997). The importance of satellite derived measurements to describe the aerosol loads above the Mediterranean was also demon-strated by Moulin et al. (1997), who reported that year-to-year changes in aerosol optical depths in the Mediterranean are driven by African dust and are closely related to air mass circulation and the Northern Atlantic Oscillation. Recent model studies reproduced satellite observations and demon-strated that three major components of aerosols (sulfate, BC and dust), have very high direct radiative forcing of aerosols at the top of the atmosphere in surrounding regions of the Mediterranean Basin (Jacobson, 2001). This model esti-mates a negative radiative forcing for aerosols in the Mediter-ranean, roughly comparable to that of greenhouse gases (e.g.
−3 to −4 W m−2). Transport of aerosols and their precur-sors from the surrounding regions could therefore have a dramatic impact, not only on radiative properties over the Mediterranean Sea, but even on cloud properties and thus on water cycle (Lelieveld et al., 2002). Rosenfeld (2000), using satellite-derived pictures, concluded that pollution from large Turkish cities influences downwind cloud radius droplets. Complete characterization of aerosols reaching the Mediter-ranean Basin will undoubtedly be needed to validate model calculations and remote sensing observations.
Very few studies have focused in detail on the three com-ponents of aerosols in the Eastern Mediterranean Sea taking
292 J. Sciare et al.: Aerosols in the Eastern Mediterranean Sea during summertime
Fig. 1. Distribution of 5-day back-trajectories arriving at Finokalia
Station for the period (9/07–6/08). A = Western Europe, B = Mediterranean, C = Turkey + Central Europe, D = Turkey + Eastern Europe.
into account all the surrounding emitting regions, namely Western, Central and Eastern Europe, Turkey and Africa. Mihalopoulos et al. (1997) showed that the highest levels of sulfate and nitrate measured on Crete originated from long-range transport of air masses coming from west and north-central Europe. Zerefos et al. (2000) assessed the role of long-range transport of air pollutants above Greece and es-timated that 70% of the total SO2 column above the north-ern Greece during NE flow could originate from lignite com-bustions in Central Europe. During the PAUR II campaign (Crete Island, May 1999), significant correlations were ob-served between ammonium sulfate mass, aerosol scattering coefficient and aerosol single-scattering albedo (ω0), indi-cating the key role of ammonium sulfate in determining the radiative forcing of the Eastern Mediterranean area (Kou-varakis et al., 2002). However, a closer look at the differ-ent sources contributing to the total burden of sulfate aerosol in the Eastern Mediterranean Basin is still needed, since re-cent studies have pointed out the importance of biogenic emissions on the sulfur budget in the Eastern Mediterranean (Ganor et al., 2000; Kouvarakis and Mihalopoulos, 2002).
This work attempts to identify the main regions respon-sible for the observed levels of three important components of aerosols (sulfate, BC and dust) in Crete, in the Eastern Mediterranean during summer. The chemical characteriza-tion of aerosols presented in this work was carried out as part of the EU funded program EL CID (Evaluation of the Climatic Impact of DMS), which took place in Crete Island during summer 2000. Air mass origin is used to estimate the influence of emitting regions on the chemical composition of aerosols sampled in Crete; then a simple source-receptor model is applied to the data to identify more specifically the most important aerosol source areas. Finally, the rep-resentativity of this ground-based dataset will be discussed
by comparison with optical properties of aerosols retrieved from satellite measurements.
2 Experiment
2.1 Finokalia sampling station
Finokalia Sampling Station (35.3◦N, 25.7◦E) is located at 150 m asl in a remote area of the Northern coast of Crete Island. A detailed description of the station is given by Mi-halopoulos et al. (1997) and Kouvarakis et al. (2000). The station’s suite of measurements includes ion speciation of aerosols, dry, and wet deposition measurements for the past 5 years (Kouvarakis et al., 2001) as well as ozone monitoring (Kouvarakis et al., 2000).
2.2 Climatology
The most striking feature of the meteorological conditions that occurred during the campaign was the quasi-permanent flow from the North wind sector together with strong wind speed of 35 km h−1 on average. Such a flow is a common pattern, not only for Crete, as shown by Mihalopoulos et al. (1997) based on the results of a 5-year back-trajectory study performed for Finokalia Station, but for the eastern Mediterranean generally (Alpert et al., 1990; Dayan et al., 1991; Kallos et al., 1998).
Figure 1 shows the residence time of air masses reaching Finokalia Station in 0.5◦×0.5◦grid cells during the cam-paign (9/7–6/8/2000). Air mass back-trajectories in this fig-ure were calculated from Hysplit Dispersion Model (Hybrid Single - Particle Langrangian Integrated Trajectory; Draxler and Hess, 1998) and are described by 1-h endpoint locations in terms of latitude and longitude. 72 h backtrajectories are reported in this figure for every hour of the campaign started at 500 m asl at the location of Finokalia Station (35.3◦N, 25.7◦E). This figure confirms the prevailing northern origin of air masses reaching Crete Island during summer and al-lowed us to better separate these air masses into four “sec-tors”. Sector A corresponds to “Western Europe”, sector B to the “Mediterranean”, sector C to “Turkey and Central Eu-rope”, and sector D to “Turkey and Eastern Europe”. It is also worth-noting that during this one-month experiment, air masses arriving at Crete Island crossed all the 0.5×0.5◦grids of Europe (at least once), demonstrating the central location of this island in monitoring the export of European air pollu-tants over Northern Africa and Middle East.
Air masses crossing Crete from the 28/07 to 02/08 were considered to be influenced by “Local Pollution”; this period (28/07–02/08) is not taken into account in the later discussion on aerosol sources.
From the wind direction recorded at Finokalia it was con-cluded that local orographic effects such as land-sea / sea-land breeze did not occur at the sampling site. No precipita-tion or clouds were reported during the campaign.
J. Sciare et al.: Aerosols in the Eastern Mediterranean Sea during summertime 293
2.3 Sampling and analysis
The dataset presented here consist in a high temporal reso-lution of relevant gases and bulk aerosol components. Such high resolution was motivated by:
1. The variability observed in the Radon 222 (222Rn) ac-tivity during the campaign, indicative of important short term changes in transport conditions (some changes of one order of magnitude from 10 to 100 pCi m−3could occur within 4 h).
2. The remote location of the receptor site. At such sites, the typical duration of “continental events” is short in time and normally does not exceed few hours (see, for instance, the event noted as 1 in Figs.2a and 3).
3. At last but not least, for source-receptor model as the one applied in this study the number of data points used as input is a critical parameter (refer to Charron et al., 2000, for more information). Each data point is asso-ciated with an air mass back trajectory. The more data points used in this model, the more accurate will be the definition of the sources, especially far from the recep-tor site. For a monthly study as in our case, daily or diurnal sampling would not be sufficient for use as in-put parameter.
2.3.1 Gas sampling for sulfur dioxide (SO2)
Two techniques for SO2 collection operated during the EL CID campaign: the Na2CO3-impregnated filters-IC (23– 29/07) and the cofer mist chamber-IC techniques (whole campaign). The sampling step was to 2 h for both tech-niques. A total of 34 samples could be directly compared be-tween 23–29/07 with SO2values ranging from 1.99 to 9.84
µg m−3. The SO2 concentrations obtained using the two techniques compare quite well (slope 1.13 and correlation coefficient r2 = 0.86); with the cofer mist technique giv-ing the highest results. The average discrepancy between the two techniques was 8.5%. The data presented in this paper are those obtained by the cofer mist technique. A detailed description of the cofer mist technique used here is given by Sciare and Mihalopoulos (1999). A 0.5 µm PTFE filter was mounted on the cofer line to collect aerosols. The 1/400Teflon line between the PTFE filter and the cofer was limited to 3 m to reduce loss on the line surface. Gaseous SO2was trapped by the mist created by the cofer and was analyzed as sulfate by Ion Chromatography (IC).
Attention is paid to the identification of analytical errors possibly induced by our short sampling duration. Based on 2 h sampling (cofer-mist), the average SO2 concentration analysed by the IC was 350 ppb. Blanks collected during the campaign were below the detection limit (5 ppb). Thus, blanks would represent about 1.4% of the SO2 concentra-tion, which lies within the 8.5% error derived by comparing the two SO2techniques described above.
Figure 2 : Air concentration in µg/m3of Black carbon (a), sulfur dioxyde and non-sea-salt
sulfate (b),and non-sea-salt calcium (c). Air masses sectors are reported for all the campaign. Stars correspond to peaks of BC during dust events. Peak of BC noted as (1) correspond to Fires in the Peloponesian
A B
Western Europe Mediterranean
C Turkey + Central Europe D Turkey + Eastern Europe
E Local Pollution
Figure 2
A B A B A A C D C E BC D nss -Ca (b) SO 2 & n ss-S O4 (c) 1 0 4 8 12 16 20 09/07 12/07 15/07 18/07 21/07 24/07 27/07 30/07 02/08 05/08 0 2 4 6 8 10 nss-SO4 SO2 C 0 0.25 0.5 0.75 1 1.25 (a) Bl ac k ca rb onFigure 2 : Air concentration in µg/m3of Black carbon (a), sulfur dioxyde and non-sea-salt
sulfate (b),and non-sea-salt calcium (c). Air masses sectors are reported for all the campaign. Stars correspond to peaks of BC during dust events. Peak of BC noted as (1) correspond to Fires in the Peloponesian
A B Western Europe Mediterranean A A B B Western Europe Mediterranean
C Turkey + Central Europe D Turkey + Eastern Europe C Turkey + Central Europe D
C
C Turkey + Central Europe D
D Turkey + Eastern Europe
E Local Pollution E E Local Pollution
Figure 2
A B A B A A C D C E BC D nss -Ca (b) SO 2 & n ss-S O4 (c) 11 0 4 8 12 16 20 09/07 12/07 15/07 18/07 21/07 24/07 27/07 30/07 02/08 05/08 0 2 4 6 8 10 nss-SO4 SO2 C 0 0.25 0.5 0.75 1 1.25 (a) Bl ac k ca rb onFigure 2 : Air concentration in µg/m3 of Black carbon (a), sulfur dioxyde and non-sea-salt sulfate (b),and non-sea-salt calcium (c). Air masses sectors are reported for all the campaign. Stars correspond to peaks of BC during dust events. Peak of BC noted as (1) correspond to Fires in the Peloponesian
A B
Western Europe Mediterranean
C Turkey + Central Europe D Turkey + Eastern Europe
E Local Pollution
Figure 2
A B A B A A C D C E BC D nss -Ca(b)
SO 2 & n ss-S O4(c)
1 0 4 8 12 16 20 09/07 12/07 15/07 18/07 21/07 24/07 27/07 30/07 02/08 05/08 0 2 4 6 8 10 nss-SO4 SO2 C 0 0.25 0.5 0.75 1 1.25(a)
Bl ac k ca rb onFigure 2 : Air concentration in µg/m3 of Black carbon (a), sulfur dioxyde and non-sea-salt sulfate (b),and non-sea-salt calcium (c). Air masses sectors are reported for all the campaign. Stars correspond to peaks of BC during dust events. Peak of BC noted as (1) correspond to Fires in the Peloponesian
A B Western Europe Mediterranean A A B B Western Europe Mediterranean
C Turkey + Central Europe D Turkey + Eastern Europe C Turkey + Central Europe D
C
C Turkey + Central Europe D
D Turkey + Eastern Europe
E Local Pollution E E Local Pollution
Figure 2
A B A B A A C D C E BC D nss -Ca(b)
SO 2 & n ss-S O4(c)
11 0 4 8 12 16 20 09/07 12/07 15/07 18/07 21/07 24/07 27/07 30/07 02/08 05/08 0 2 4 6 8 10 nss-SO4 SO2 C 0 0.25 0.5 0.75 1 1.25(a)
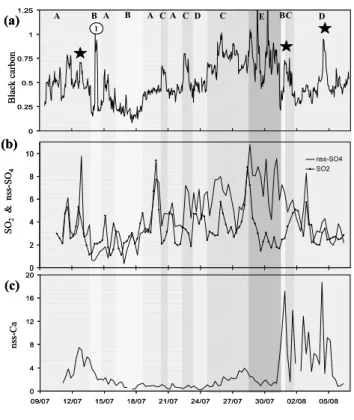
Bl ac k ca rb onFig. 2. Air concentration in µg m−3of BC (a), sulfur dioxide and non-sea-salt sulfate (b), and non-sea-salt calcium (c). Air mass sec-tors are reported for all the campaign. Stars correspond to peaks of BC during dust events. Peak of BC noted as (1) corresponds to fires in the Peloponnesian.
2.3.2 Aerosol sampling and analysis
Aerosol collection was done on 0.5 µm PTFE filters at a flow rate of 20 L min−1. The results presented here correspond to bulk aerosols. Sampling time was 2 h, i.e. similar to the cofer mist sampling. A total of 279 aerosol samples were collected from 11/07 to 6/08/2000 and analysed for the main anions and cations using IC. The analytical precision was 10%. De-tails of the analytical procedure can be found in Kouvarakis and Mihalopoulos (2002).
Non-sea-salt sulfate (nss-SO4) was calculated from the ion ratio SO2−4 /Na+in seawater equal to 0.252, and non-sea-salt calcium (nss-Ca) from the ion ratio of Ca2+/Na+in seawater equal to 0.038. Contribution of sea salt to the total sulfate measured in aerosols was respectively 5%, 15%, 22% and 42% for sectors C, A, D and B. By comparison, sea salt cal-cium contribution was relatively small (7% on average).
Methanesulfonate (MSA) was also detected by ion chro-matography. This compound is an oxidation product of at-mospheric Dimethylsulfide (DMS), and can be used as a tracer for biogenic sulfur emissions.
294 J. Sciare et al.: Aerosols in the Eastern Mediterranean Sea during summertime
Figure 3
Figure 3 : Seawifs satellite picture of fires in Peloponese taken on July, 13th 2000. Backtrajectory plots arriving at Finokalia corresponds to the BC peak of figure 2a noted « 1 ». Each square on these plots corresponds to 1h on the backtrajectory pathway.
Fig. 3. Seawifs satellite picture of fires in Peloponese taken on 13
July 2000. Back trajectory plots arriving at Finokalia correspond to the BC peak of Fig. 2a denoted (1). Each square on these plots corresponds to 1 h on long back-trajectory pathway.
2.3.3 BC measurements
A commercial instrument (PSAP; particle soot absorption photometer; Radiance Research; Seattle, USA) was used to measure in quasi real time the light absorption coefficient of ambient aerosols. The method is based on the integrating plate technique in which the change in optical transmission through a filter caused by particle deposition on the filter is related to the light absorption coefficient of the deposited particles using the Beer-Lambert law. Total uncertainty of PSAP measurement at 60 s averaging time and typical atmo-spheric levels was estimated around 15% (95% confidence level) by Bond et al. (1999). For the major part of the cam-paign (9–30/07), the PSAP absorption was compared against that obtained using an Aethalometer (Model AE-8 manufac-tured by Magee Scientific; Hansen et al., 1984). Using mass absorption efficiencies of 10 and 19 m2g−1 for PSAP and Aethalometer respectively, as recommended by the manufac-turers, the agreement between the two 6 h averaged dataset was very good (slope of 1.03, r2=0.76; n = 83).
As PSAP and Aethalometer compared well during the campaign, the most important error in calculating the BC concentrations during the campaign is probably related to the uncertainty in mass absorption efficiency which could range between 5 and 15 m2g−1depending on the environment, i.e error up to 50% (Liousse et al., 1993). On the other hand, the significant correlation between BC and CO obtained during this campaign, excluding the dusty periods, indicates that the error in the estimation of BC concentrations is fairly constant through the campaign and unlikely to be as high as 50%.
The absorption coefficient determined with the PSAP is
corrected from the scattering as recommended by Bond et al. (1999). These corrections will lower the uncorrected BC concentrations by about 20% on average.
3 Results and discussion
3.1 Temporal variations of chemical constituents in aerosols
3.1.1 BC in aerosols
Hourly-averaged BC levels for the whole campaign are shown in Fig. 2a, along with air mass origin. No regular di-urnal variation of BC was observed which could be linked to a change in the MBL, suggesting a quite uniform distribution of BC at least within the first layers of the atmosphere.
As expected, the lowest BC levels corresponded to the ma-rine sector, the highest to local pollution. Several fires oc-curred over Continental Greece (Pelonoponese) on 13 July (Fig. 3). Hundreds of wildfires, ignited by a relentless heat wave, continued to blaze in Greece on 14 July. The BC peak noted in Fig. 2a as (1) corresponds to the Peloponese fires as displayed in Fig. 3. Arrows on this picture represent the wind direction on 13 July. A change in the wind direction occurred later this day as shown on Fig. 3 from back trajec-tories. Using back trajectories at 500 m asl for the ending point (Finokalia Station), 16 h was necessary for the biomass burning plume to reach Crete Island.
Surprisingly high BC concentrations were observed during the periods receiving air masses from Central Algeria (12– 13/07 and 27/07), and the period receiving air masses from Central Turkey (2–6/08) (Fig. 2). Back trajectory plots for these periods did not suggest either local anthropogenic or large-city influence, which could explain these high BC con-centrations. Moreover, the high levels of BC during these pe-riods were not associated with high levels of SO2or nss-SO4 (Fig. 2b). As a result, the (BC/nss-SO4) mass ratio, which is quite stable for the duration of the campaign (11.6 ± 3.8% for the non dusty periods), increased to (18.9 ± 4.8%) during these three periods. In addition BC and CO did not correlate during these periods whereas they correlated well for the rest of the campaign. The three periods marked by stars in Fig. 2a are associated with elevated levels of nss-Ca, a tracer of dust aerosols. Since PSAP measurements were corrected for scat-tering as proposed by Bond et al. (1999), the rise in ab-sorbance during these dust periods is likely to be due to dust aerosols and the presence of Hematite (α-Fe2O3), the only known highly absorbing atmospheric species in the visible region apart from carbon (Bohren and Huffman, 1983). Sim-ilar aerosol absorption due to aerosols originating from North Africa, as well as anti-correlation between absorbance and CO measurements, have also been reported at Mace Head by Jennings et al. (1996).
J. Sciare et al.: Aerosols in the Eastern Mediterranean Sea during summertime 295
3.1.2 Gaseous SO2and particulate nss-SO4
SO2concentrations were shown in Fig. 2b and compared to nss-SO4levels in aerosols. Air masses passing over Athens, Izmir, Istanbul or Thessaloniki were identified and showed high SO2concentrations compared to nss-SO4, although it took 1–2 days for these air masses to reach Crete.
Neither RH nor wind speed could be identified as a driv-ing force in the conversion of SO2into particulate SO4. The observed nss-SO4/(nss-SO4+SO2) ratios of 0.4–0.5 were in agreement with the ratios reported by Luria et al. (1996) for the Israeli coast and are indicative of aged air masses.
Neutralization of nss-SO4from ammonium (NH+4), (e.g. the NH+4/nss-SO4molar ratio) was partial and averaged 1.49 (r2 =0.76; n = 268). This value is lower compared to the values reported for spring in Crete where neutralization is almost complete (Kouvarakis et al., 2002). As expected this molar ratio is the lowest for the marine sector (slope of 1.0) in agreement with previous studies (see for instance Sellegri et al., 2001 for the western Mediterranean).
3.1.3 Nss-Ca in aerosols
Six hourly averaged nss-Ca concentrations are shown in Fig. 2c. Three periods show important levels of nss-Ca and are marked by a star in the figure. Visible pictures from the Seawifs satellite and back trajectory analysis showed that the first period (12–13/07) corresponded to air masses originat-ing in Algeria and crossoriginat-ing Italy and Greece. The second (27–28/07) corresponded to air masses also originating in Al-geria and crossing Italy and Central Europe. The last period (1–5/08) corresponded to air masses originating in Central Turkey.
3.2 Influence of air mass sector on the chemical composi-tion of aerosols at Finokalia
The following discussion aims to characterize the contribu-tion of the four sectors described previously (sectors A to D) on the levels of different aerosol constituents at Finokalia Station. The proportion of each sector during the campaign is 33, 19, 29 and 19% for the sectors A to D, respectively (Fig. 4a). Based on this sector segregation, 6-h averaged concentrations of BC, nss-SO4, SO2, and MSA are shown in Fig. 4. Note that nss-Ca is not shown in this figure, since the air masses originating from Africa crossed several sectors before reaching Crete (namely sectors A, B, C).
3.2.1 BC/nss-SO4mass ratio
The BC distribution is very similar to the one obtained for non-sea-salt sulfate, with concentration levels 40% higher for sector C compared to the other continental sectors A and D, and almost a factor of 3 higher compared to the marine sector B. Since both air masses from sectors C and D passed over
Figure 4 : Time distribution for each air mass sector for the duration of the campaign (a). Average concentration of various gaseous and aerosol species for each sector (b). Estimation of biogenic nss-SO4is calculated from the
MSA/nss-SO4molar ratio relationship given by Bates et al. (1992).
0 1 2 3 4 5 6 7
sector B sector D sector A sector C Estimation Biogenic nss-SO4
BC x 8 nss-SO4 SO2 MSA x 100 Con centration in µg/m 3 Mediterranean (sector B) 19 % Turkey + Eastern Europe (sector D) 19 % Western Europe (sector A) 33 % Turkey + Central Europe (sector C) 29 % (a) (b)
Fig. 4. Average concentration of various gaseous and aerosol
species for each sector. Estimation of biogenic nss-SO4 is
cal-culated from the MSA/nss-SO4molar ratio relationship given by
Bates et al. (1992).
Turkey, we can assume a larger BC and nss-SO4contribution for Central Europe compared to Eastern and Western Europe. The (BC/nss-SO4) mass ratio has been used in model cal-culations to estimate radiative forcing of both components on a global scale (Schult et al., 1997). These authors cal-culated BC/nss-SO4 mass ratios of the order of 25% for Mediterranean and Europe, and estimated a corresponding solar forcing at the top of the atmosphere in the range −3 to −4 Wm−2for externally mixed aerosols in July, which is comparable but different in sign to that induced by the green-house gases. Similar aerosol forcing has been estimated by Jacobson (2001). Recent aerosol measurements performed by Kirvacsy et al. (2001) showed this ratio to be of the order of 25% in Western Europe while this ratio dropped to 15% for a remote site in Hungary (Central Europe). The mean (BC/nss-SO4) mass ratio calculated here is similar to the lat-ter case (on average 11.6 ± 3.8% for the non dusty periods). These values are a factor of two lower than the ratios reported by model studies. As a consequence, negative forcing in-duced by sulfate aerosols could be underestimated by models by at least a factor of two in the Eastern Mediterranean.
Important marine sulfur emissions (DMS origin) would in-crease the nss-SO4concentration in the atmosphere and con-sequently decrease the (BC/nss-SO4) mass ratios calculated in Crete. Several works have estimated the relative
contri-296 J. Sciare et al.: Aerosols in the Eastern Mediterranean Sea during summertime 30 35 40 45 50 0 5 10 15 20 25 30 35 40 > 0.65 0.55-0.650 0.45-0.55 0.45 < BC (µg/m3) :
Figure 5 : Average Finokalia BC (a), SO2(b), nss-SO4(c) concentrations according to the origin of air masses (defined by trajectory path). Grid cell sizes are 0.5° x 0.5° for BC and 1° x 1° for SO2and nss-SO4. The yellow and red squares correspond to cells of 50x50 km of SO2emissions of up to 25k T(S)/y and 250kT(S)/y respectively, as given by the EMEP 1999 emission inventory map.
Figure 5a
(a) Black Carbon
30
35
40
45
50
0
5
10
15
20
25
30
35
40
> 0.65
0.55-0.650
0.45-0.55
0.45 <
BC (µg/m
3) :
Figure 5 : Average Finokalia BC (a), SO
2(b), nss-SO
4(c) concentrations according to
the origin of air masses (defined by trajectory path). Grid cell sizes are 0.5° x 0.5° for
BC and 1° x 1° for SO
2and nss-SO
4. The yellow and red squares correspond to cells of
50x50 km of SO
2emissions of up to 25k T(S)/y and 250kT(S)/y respectively, as given
by the EMEP 1999 emission inventory map.
Figure 5a
(a) Black Carbon
30 35 40 45 50 0 5 10 15 20 25 30 35 40
Figure 5 : Average Finokalia BC (a), SO2(b), nss-SO4(c) concentrations according to the origin of air masses (defined by trajectory path). Grid cell sizes are 0.5° x 0.5° for BC and 1° x 1° for SO2and nss-SO4. The yellow and red squares correspond to cells of 50x50 km of SO2emissions of up to 25k T(S)/y and 250kT(S)/y respectively, as given by the EMEP 1999 emission map.
Figure 5b
(b) Sulfur dioxide > 1500 1250-1500 1000-1250 500-1000 SO2(pptv) :30
35
40
45
50
0
5
10
15
20
25
30
35
40
Figure 5 : Average Finokalia BC (a), SO
2(b), nss-SO
4(c) concentrations according to
the origin of air masses (defined by trajectory path). Grid cell sizes are 0.5° x 0.5° for
BC and 1° x 1° for SO
2and nss-SO
4. The yellow and red squares correspond to cells of
50x50 km of SO
2emissions of up to 25k T(S)/y and 250kT(S)/y respectively, as given
by the EMEP 1999 emission map.
Figure 5b
(b)
Sulfur dioxide
> 1500
1250-1500
1000-1250
500-1000
SO
2(pptv) :
30 35 40 45 50 0 5 10 15 20 25 30 35 40Figure 5 : Average Finokalia BC (a), SO2(b), nss-SO4(c) concentrations according to the origin of air masses (defined by trajectory path). Grid cell sizes are 0.5° x 0.5° for BC and 1° x 1° for SO2and nss-SO4. The yellow and red squares correspond to cells of 50x50 km of SO2emissions of up to 25k T(S)/y and 250kT(S)/y respectively, as given by the EMEP 1999 emission map.
Figure 5c
> 1500 1250-1500 1000-1250 500-1000 (c) Non-sea-salt sulfate nss-SO4(pptv) :30
35
40
45
50
0
5
10
15
20
25
30
35
40
Figure 5 : Average Finokalia BC (a), SO
2(b), nss-SO
4(c) concentrations according to
the origin of air masses (defined by trajectory path). Grid cell sizes are 0.5° x 0.5° for
BC and 1° x 1° for SO
2and nss-SO
4. The yellow and red squares correspond to cells of
50x50 km of SO
2emissions of up to 25k T(S)/y and 250kT(S)/y respectively, as given
by the EMEP 1999 emission map.
Figure 5c
> 1500
1250-1500
1000-1250
500-1000
(c)
Non-sea-salt sulfate
nss-SO
4(pptv) :
Fig. 5. Average Finokalia BC (a), SO2(b), nss-SO4(c) concentrations according to the origin of air masses (defined by trajectory path).
Grid cell sizes are 0.5◦×0.5◦for BC and 1◦×1◦for SO2and nss-SO4. The yellow and red squares correspond to cells of 50 × 50 km of
J. Sciare et al.: Aerosols in the Eastern Mediterranean Sea during summertime 297 0 0.25 0.5 0.75 11/07/00 15/07/00 19/07/00 23/07/00 27/07/00 31/07/00 04/08/00 0 2 4 6 8 Angstrom Exponent nss-SO4 (24h average)
African dust Turkish dust local Pollution
Figure 6
Figure 6 : Optical properties of aerosols calculated from Seawifs satellite observation. AOT
with daily (nss-Ca/Σ Ions) mass ratio (a); and Angstrom exponent with daily nss-SO4(b).
Angtröm E xponent ns s-SO 4 , µg/m 3 Aeros ol Optical Thicknes s (nss-Ca / Σ Ions) mas s ratio, %
(a)
(b)
0.04 0.1 0.16 0.22 0.28 0 10 20 30 AOTnss-Ca / Mass Ions (24h average)
Fig. 6. Optical properties of aerosols calculated from Seawifs satellite observation. AOT with daily (nss-Ca/6 Ions) mass ratio (a); and
Angstr¨om exponent with daily nss-SO4(b).
bution of biogenic sulfur (DMS origin) to be of the order 20–25% of the total sulfate burden in the Eastern Mediter-ranean for the months of July–August (Ganor et al., 2000 over Israel; Kouvarakis and Mihalopoulos, 2002 over Crete). This proportion will vary with changing residence time of air masses above the sea, and other parameters such as wind speed (higher emissions of DMS from the sea) and spatial distribution of seawater DMS. MSA, an exclusive DMS ox-idation product, is very often used as a tracer for DMS and is shown in Fig. 4. As expected, the DMS influence is the highest for the marine sector, although sector D (Turkey + Eastern Europe) is surprisingly high compared to sector C (Turkey + Central Europe). Comparison between these two sectors shows that air masses from sector D passed over the Black Sea before arriving in Crete. The Black Sea could act as a non negligible source for biogenic sulfur compounds in the Mediterranean area, which is in agreement with the
re-cent findings of Kubilay et al. (2002).
The contribution of biogenic nss-SO4 can be estimated from an equation given by Bates et al. (1992) linking at-mospheric temperature and (MSA/nss-SO4) molar ratio for the remote marine atmosphere. This equation was based on aerosol measurements with a cut-off diameter of 0.6 µm. During the major part of the campaign (10–31/7/2000) size-segregated samples were collected at Finokalia using Berner type low pressure cascade impactor (Bardouki et al., 2003). On average, during the ELCID campaign, 90.3% and 87.4% of nss-SO4 and MSA, respectively were found in the sub micron range and having the same distribution centered on 0.3 µm A.E.D. As in this study the MSA/nss-SO4 ratios are reported for bulk aerosol, the error by considering the MSA/nss-SO4ratio for bulk aerosol (instead of a diameter below 0.6 µm) is around 7% and thus insignificant. The Bates et al. (1992) equation has often been validated for low
298 J. Sciare et al.: Aerosols in the Eastern Mediterranean Sea during summertime
and mid latitudes (see for instance Sciare et al., 2001 and references herein). Using this equation for an average atmo-spheric temperature of 25◦C (as observed during the
cam-paign) we estimated this ratio to be of the order of 4%. Con-sidering all sectors, contribution of biogenic nss-SO4was es-timated to be 20%, which is comparable to the previous stud-ies. Taking into account MSA and nss-SO4distribution per sector, this biogenic contribution varies considerably from 9% for sector C, 15% for sector A, 24% for sector D and as high as 52% for the marine sector B. These percentages are also shown in Figure 4 to compare better with the total nss-SO4.
When the biogenic fraction of nss-SO4 is excluded the (BC/nss-SO4) mass ratio presents now a sectorised distri-bution. However, with the exception of the sector B, this ratio remains quite low (mean value around 15%) and does not compare well with model estimates. More studies are clearly needed to explain the reasons for such low (BC/nss-SO4) mass ratios.
3.2.2 SO2distribution
The results presented previously highlight the role of Cen-tral Europe as the most important anthropogenic source of aerosols in the MBL over the Aegean Sea. On the other hand, the SO2 distribution is different from those obtained for BC and nss-SO4, and does not show particularly high lev-els for the Central Europe sector. This result is unexpected, since several studies have reported that most of the SO2over Greece originates from the numerous power plants in Cen-tral Europe (SO2emissions map available from EMEP web site; http://www.emep.int). The additional biogenic source of SO2cannot explain this SO2distribution, since as shown for sulfate (Fig. 4), the biogenic influence for sector C is the lowest of all four sectors, and almost negligible compared to anthropogenic sources. One of the possible reasons could be an active oxidation of SO2 to SO4in the plumes of the power plants. Another explanation could be that numerous power plants in Central Europe S-containing lignite as fos-sil fuel inject SO2at up to several hundred meters altitude, even reaching the lower free troposphere. Evidence for this theory has recently been gathered in the form of SO2 max-ima frequently observed at the top of the PBL over northern Greece (Zerefos et al., 2000 and references herein; P. For-menti, personal communication). This phenomenon is likely to result in higher long-range transport of this compound. As a result, SO2inputs from Central Europe could be weak at ground level (e.g. Finokalia station in Crete Island), which might explain our moderate SO2levels in this sector (Fig. 4).
3.3 Source-receptor relationships influencing the chemical composition of aerosols at Finokalia Station
In order to examine the contribution of each sector on the measured levels of sulfur and BC, a simple source-receptor
relationship was established based on our present data set. This source-oriented methodology, developed by Seibert et al. (1994) provides maps of potential sources, which could be used to examine the quantitative relationship between at-mospheric concentrations and emissions. This type of model has been successfully used in the past to examine the source contributions of many atmospheric species (Charron et al., 2000 and references herein). Air mass back-trajectories used in the model were those calculated for Fig. 1. Each 1-h av-erage for BC and 6-h avav-erage for SO2and nss-SO4were as-sociated with a corresponding 72 h back trajectory starting at Finokalia station at 500 m asl. The choice of 72 h-back-trajectories is supported by reference to lifetimes of the dif-ferent species (see for instance Liousse et al., 1996 for BC; Wojcik and Chang, 1997 for S species) and the inaccuracy of the model far from the receptor site. It is worth noting how-ever, that a sensitivity test using 120 h instead of 72 h back-trajectories for the source-receptor model calculation gave similar results.
A total of 672 and 104 averages for BC and S species, respectively were used for the application of the source-receptor model. The geographical regions covered by the trajectories were divided into cells of 1◦×1◦for S species and 0.5 × 0.5◦for BC. Better spatial resolution can be ob-tained for BC due to the higher temporal resolution of the measurements. More details about the calculations can be found in Charron et al. (2000).
One must keep in mind that the limitations of such a model are numerous. By applying the same concentration through-out the entire back trajectory, the model does not take into account dispersion (horizontal and vertical); also the vertical component of the back trajectories is not taken into account. Finally, due to the time limitations of the campaign, such a map is representative only for a short period (1 month). Greater accuracy would be obtained concerning the location and the type of Central and Eastern Europe aerosol sources by applying this model calculation to a wide range of aerosol components at different sites and during different periods of the year.
3.3.1 BC sources
As expected, the Mediterranean does not act as a BC source, although some spot sources are found North of Algeria, in the Black Sea and in the Aegean Sea. Model limitations, such as the influence of intense sources on their surrounding cells, could be one reason for these point sources. This is the case for the Black Sea sector located downwind of Bul-garia, Romania and Moldavia and where high aerosol loads with considerable visible haze have been frequently observed from Seawifs satellite observations.
Four major sources of BC were identified from the re-sults of this source-receptor model corresponding to Alge-ria, Turkey, Central Europe, Moldavia; Western and Eastern Europe were found to be less important. This is in
agree-J. Sciare et al.: Aerosols in the Eastern Mediterranean Sea during summertime 299
ment with the previous findings of important BC sources in Central Europe (sector C) compared to Western and East-ern Europe (sectors A and D). This source-receptor model applied for BC highlights important sources over Central Al-geria and Turkey, which are probably due to absorbance by dust aerosols as mentioned before. However, even when pe-riods with high dust influence are excluded, the distribution of BC sources is still in poor agreement with the global dis-tribution of BC emissions on a 1◦×1◦scale calculated by Cooke et al. (1999). Although, these authors reported impor-tant sources of BC over Central Europe, they also reported important sources over Bulgaria and Hungaria, which are not seen in the present results.
3.3.2 SO2and nss-SO4sources
Maps of the SO2 and nss-SO4 sources as observed from Crete are shown in Figs. 5b and c, respectively. The weak-est sources are observed above the Mediterranean and the highest above the continent (Central Europe and to a less extent Turkey). Central Europe is identified as by far the most important emitting region for both SO2 and nss-SO4 measured in Crete. The Central Europe source strength of S compounds calculated here is in agreement with previous findings of Zerefos et al. (2000) who reported that 70% of SO2measured North of Greece (Thessaloniki) originates in Bulgaria and surrounding countries. Important sources were observed from Hungaria, Romania and Bulgaria, which is in agreement with SO2emission data for 1999 provided by UNECE/EMEP. Despite the limitation in time of our cam-paign, it is quite interesting to compare the output results of this model with data available in the literature (yearly av-eraged emissions from EMEP inventories) focusing on the location of the potential sources. Although this comparison is by no mean quantitative, it will qualitatively bring further insights on the potential location of the sources detected dur-ing the campaign. To compare with EMEP SO2inventories, we show in Fig. 5 the most important annually averaged SO2 sources (> 25 kT (S) y−1in yellow and > 250 kT (S) y−1 in red) as calculated by EMEP 1999 emission data. The only SO2source reported by EMEP which was not ‘seen’ by our model calculation, is Sicily and corresponds to volcanoes. Absence of activity of these volcanoes during the experiment explain this discrepancy. This one exception asides the distri-bution of S sources presented here is in quite good agreement with those reported in the EMEP inventory.
Comparison between BC and S sources in Central Eu-rope shows noticeable discrepancies. Only different kinds of combustible material can explain such a difference, with S-enriched combustion compared to BC (different coals, wood and fossil oil combustion).
3.4 Comparison with satellite observations
In the previous sections, it was noted that elevated levels of atmospheric constituents could possibly be transported at al-titude over the Aegean Sea. To check the representativity of our aerosol ground-based measurements for the marine boundary layer we compare them with a satellite product.
The Sea Wide Field-of-View Sensor (SEAWIFS) is ded-icated to ocean color, i.e. to the observation of marine bi-ological activity within surface waters. This sensor was launched in 1997 and is still operating. Because ocean color algorithms require accurate removal of any atmospheric per-turbation, aerosol optical thickness and Angstr¨om exponent are assessed during the SEAWIFS data processing. SEAW-IFS data are available on the NASA/GSFC/DAAC web site (http://daac.gsfc.nasa.gov/data/dataset/SEAWIFS/). For the present study daily global maps of the aerosol optical thick-ness at 865 nm and of the angstrom exponent computed be-tween 510 and 865 nm were downloaded. The latter parame-ter gives information about the aerosol size distribution, with low values for large particles (about 0–0.5 for sea salt and dust) and high values for smaller particles such as sulfate or BC particles (around 1–1.5). Both aerosol parameters were extracted over an area of 3 × 3 pixels (about 30 km × 30 km) north of Finokalia station and are shown in Fig. 6 together, with (nss-Ca/Sigma mass ions) mass ratio and nss-SO4 lev-els respectively.
Figure 6a compares daily SEAWIFS aerosol optical thick-ness with the daily averaged mass ratio (nss-Ca/Sigma mass ions) obtained from the field measurements. This mass ratio was chosen as a proxy of relative contribution of mineral dust to the total mass of aerosol measured at Finokalia. The trends in the two parameters are quantitatively similar, with a rela-tively high mass ratio before 15 July, between 26 and 29 July, and between 31 July and 3 August. During these three peri-ods, that correspond to mineral dust transports from Africa (first two events) and Turkey (third event), the aerosol opti-cal thickness is between 0.15 and 0.25, whereas it remained around 0.1 during the polluted period, between 15 and 25 July.
Sea-salt aerosols could affect significantly the AOT espe-cially in marine environment with important wind speed such as Crete Island during summer. However, one must keep in mind the very high nss-Ca levels recorded during the cam-paign (Fig. 2) highlighting the major role of dust aerosols. A calculation can be done to estimate the mass loading of sea-salt and dust aerosols during the campaign, assuming the following:
Sea-salt = Na++Cl−+ss-SO2−4 +ss-Ca2++Mg2++ss-K+
Nss-Ca2+=Dust × 0.1259 (1)
The Eq. (1) was obtained from PIXE analysis of Al, Fe, Ca at Finokalia and based on Al/dust = 7.7% and Fe/dust = 5%; Wedepolh, 1995). These ratios were also validated during
300 J. Sciare et al.: Aerosols in the Eastern Mediterranean Sea during summertime
another campaign conducted at Finokalia in summer 2001. On average during the ELCID campaign, dust aerosols are 4 times higher in mass concentration (µg m−3) compared to sea salt. Since the measurements were performed at sea level (e.g. where the sea salt concentration is the higher) and considering that dust loading is higher in altitude (see for instance Kouvarakis et al., 2000), this factor 4 can be con-sidered as a lower limit. In addition during the “dust events” associated with important AOT (Fig. 6a), the ratio dust/sea salt at sea level reached values of 10. Consequently, it is legitimate to assume that during this campaign the column integrated concentration of dust is at least an order of magni-tude higher compared to sea salt aerosols.
The similarity between the ground-based and satellite measurements is also shown in Fig. 6b, which compares the SEAWIFS Angstr¨om exponent to the nss-SO4levels at the sampling site. The nss-SO4 was chosen as a proxy of the proportion of small aerosols. The two parameters show simi-lar trends, except during the period of local pollution around 30 July. This correlation shows that, high concentrations of nss-SO4at ground level are always associated with “small” aerosols in the atmospheric column, whereas low concentra-tions of nss-SO4are always associated with “large” aerosols, suggesting that the Finokalia measurements are representa-tive of the aerosol properties in the whole troposphere. The good agreement between satellite-retrieved optical proper-ties of aerosols and the ground-based measurements confirms that Finokalia station is a useful site for the study of tropo-spheric aerosols in the eastern Mediterranean.
4 Conclusions
A detailed study of the temporal variability of some ma-jor components of aerosols and selected precursors was car-ried out during a one-month experiment performed during the summer at a background site on Crete, in the Eastern Mediterranean Sea. Several conclusions could be made from this dataset.
BC showed important sectorised distribution, with values 40% higher for Central Europe compared to Eastern and Western Europe. A simplified source-receptor model was used to better assess the regions contributing to the BC lev-els recorded in Crete during summer 2000. Central Europe was identified as the major source of BC over the Eastern Mediterranean. This model also highlighted a significant in-fluence of dust emissions on the calculation of BC in aerosols using a light absorbance technique. Considering the low dust inputs recorded during this campaign compared to the whole year, care should be taken in the future when estimating the BC content of aerosols over the Mediterranean from optical measurements. Finally, discrepancies between our distribu-tions of BC sources with literature inventories indicate the need for further work on emission factors, as well as for more
field measurements of BC in Central Europe, one of the most important emitting regions of BC in Europe.
Nss-SO4 and SO2 levels in Eastern Mediterranean were also strongly influenced by air mass origin, with the high-est levels observed above the continental sectors. Location of SO2 and nss-SO4 sources calculated from the source-receptor model was in quite good agreement with those re-ported in the EMEP SO2inventories. Comparison between BC and sulfur sources revealed potential sources over Mol-davia and possibly the Ukraine, which were not fully identi-fied by EMEP inventories.
Calculated (BC/nss-SO4) mass ratios for all sectors were quite similar and in quite good agreement with those re-ported in literature for Central Europe, although a factor of two lower compared to both Western Europe and liter-ature modeling results. These models were validated with Aerosol Optical Thickness retrieved from Satellites. Con-sequently, comparisons with SEAWIFS satellite measure-ments were performed in order to check whether the ground-based measurements may be checked as representative of the column-integrated measurements. Aerosol Optical Thick-ness showed an important sensitivity to a proxy of the min-eral dust aerosols measured at Finokalia. In addition the Angstr¨om Exponent correlated very well with the ground-level nss-SO4concentrations. This good agreement confirms at least that Finokalia station is a pertinent receptor site to study tropospheric aerosols in the eastern Mediterranean. On the other hand the use of AOT could not be used to estimate the influence of anthropogenic aerosols at Finokalia station during the campaign.
Further works is certainly required in the area to better evaluate the long-term levels of BC and nss-SO4, together with aerosol optical properties, and to better assess the ra-diative forcing induced by these components. Future studies in the region should focus on a better understanding of the vertical distribution of air pollutants, as well as the relative contributions of their various sources.
Acknowledgements. This program was funded by the EC Pro-gramme ENK2-CT-1999-00033 (El-CID). We gratefully thank M. Vrekoussis and G. Kouvarakis for their help during the campaign, H. Cachier, M. Kanakidou and G. Salisbury for their helpful com-ments.
References
Alpert, P., Neeman, B. U., and Shay-el, Y.: Climatological analysis of Mediterranean cyclones using ECMWF data, Tellus, 42A, 65– 77, 1990.
Bardouki, H., Liakakou, H., Economou, C., Sciare, J., Smol´ık, J., ˇ
Zd´ımal, V., Eleftheriadis, K., Lazaridis, M., and Mihalopoulos, N.: Chemical composition of size resolved atmospheric aerosols in the eastern Mediterranean during summer and winter, Atmos. Environ., 37, 195-208, 2003.
Bates T. S., Calhoun, J. A., and Quinn, P. K.: Variations in the methanesulfonate to sulfate molar ratio in submicrometer marine
J. Sciare et al.: Aerosols in the Eastern Mediterranean Sea during summertime 301
aerosol particles over the South Pacific Ocean, J. Geophys. Res., 97, 9859–9865, 1992.
Bohren, C. F. and Hoffman, D. R.: Absorption and scattering of light by small particles, 530 pp., John Wiley, New York, 1983. Bond, T. C., Anderson, T. L., and Campbell, D.: calibration and
intercomparison of filter-based measurements of visible light ab-sorption by aerosols, Aerosol Sci. Technol., 30, 582–600, 1999. Charron, A., Coddeville, P., Sauvage, S., Galloo, J. C., and
Guillermo, R.: Possible source areas and influential factors for sulphur compounds in Morvan, France, Atmos. Environ., 34, 1387–1393, 2000.
Cooke, W. F., Liousse, C., Cachier, H., and Feichter, J.: Con-struction of a 1◦×1◦fossil fuel emission data set for carbona-ceous aerosol and implementation and radiative impact in the ECHAM4 model, J. Geophys. Res., 104, 22 137–22 162, 1999. Dayan, U., Heffter, J., Miller, J., and Gutman, G.: Dust
intru-sion events into the Mediterranean basin, J. Appl. Meteorol., 30, 1185–1198, 1991.
Draxler, R. R. and Hess, G. D.: An overview of the HYSPLIT 4 modelling system for trajectories, dispersion and deposition, Aust. Met. Mag. 47, 295–308, 1998.
Ganor, E., Foner, H. A., Bingemer, H. G., Udisti, R., and Setter, I.: Biogenic sulphate generation in the Mediterranean Sea and its contribution to the sulphate anomaly in the aerosol over Israel and in the Eatern Mediterranean, Atmos. Environ., 34, 3453– 3462, 2000.
Hansen, A. D. A., Rosen, H., and Novakov, T.: The aethalometer – an instrument for the real-time measurement of optical absorp-tion by aerosol particles, Sci. Total Environ., 36, 191–196, 1984. Hovarth, H.: Spectral extinction coefficients for rural aerosol in southern Italy – A case study of cause and effect of variability of atmospheric aerosol, J. Aerosol Sci., 27(3), 437–453, 1996. Husar, R. B., Prospero, J. M., and Stowe, L. L.: Characterisation
of tropospheric aerosols over the oceans using the NOAA ad-vanced very high resolution radiometer optical thickness opera-tional product, J. Geophys. Res., 102, 16 899–16 909, 1997. IPCC: Climate Change 2001, The scientific basis, Summary for
pol-icy makers and technical summary of the working group 1 report, (Eds) Watson, R., et al., Cambridge University Press, Cambridge, 98p, 2001.
Jacobson, M. Z.: Global direct radiative forcing due to multicompo-nent anthropogenic and natural aerosols, J. Geophys. Res., 106, 1551–1568, 2001.
Jennings, S. G., Spain, T. G., Doddridge, B. G., Maring, H., Kelly, B. P., and Hansen, A. D. A.: Concurrent measurements of black carbon and carbon monoxide at Mace Head, J. Geophys. Res.,101, 19 447–19 454, 1996.
Kallos, G., Kotroni, V., Lagouvardos, K., and Papadopoulos, A.: On the long-range transport of air pollutants from Europe to Africa, Geophys. Res. Lett., 25, 619–622, 1998.
Kouvarakis G., Tsigaridis, K., Kanakidou, M., and Mihalopoulos, N.: Temporal variations of surface regional background ozone over Crete Island in southeast Mediterranean, J. Geophys. Res., 105, 4399–4407, 2000.
Kouvarakis, G., Mihalopoulos, N., Tselepides, T., and Stavrakakis, S.: On the importance of atmospheric nitrogen inputs on the pro-ductivity of Eastern Mediterranean, Global Biogeochemical cy-cles, 15, 4, 805–818, 2001.
Kouvarakis, G. and Mihalopoulos, N.: Seasonal variation of
dimethylsulfide in the gas phase and of methanesulfonate and non-sea-salt sulfate in the aerosol phase measured in the east-ern Mediterranean atmosphere, Atmos. Environ., 36, 6, 929–938, 2002.
Kouvarakis, G., Doukelis, Y., Mihalopoulos, N., Rapsomanikis, S., Sciare, J., and Blumthaler, M.: Chemical, physical and optical characterization of aerosol during PAUR II experiment, J. Geo-phys. Res., 107, D18, 8141, doi:10.1029/2000JD000291, 2002. Kubilay, N., Koc¸ak M., C¸ okacar, T., Oguz, T., Kouvarakis, G.,
and Mihalopoulos, N.: The Influence of Black Sea and Local Biogenic Activity on the Seasonal Variation of Aerosol Sulfur Species in the Eastern Mediterranean Atmosphere, Global Bio-geochemical cycles, 16, 4, 1079, doi:10.1029/2002GB001880, 2002.
Krivacsy, Z., Hoffer, A., Sarvari, Zs., Temesi, D., Baltensperger, U., Nyeki, S., Weingartner, E., Kleefeld, S., and Jennings, S. G.: Role of organic and black carbon in the chemical composition of atmospheric aerosol at European background sites, Atmos. Env-iron., 35, 6231–6244, 2001.
Lelieveld, J., Berresheim, H., Borrmann, S., Crutzen, P. J., Den-tener, F. J., Fischer, H., Feichter, J., Flatau, P. J., Heland, J., Holzinger, R., Korrmann, R., Lawrence, M. G., Levin, Z., Markowicz, K. M., Mihalopoulos, N., Minikin, A., Ramanathan, V., de Reus, M., Roelofs, G. J., Scheeren, H. A., Sciare, J., Schlager, H., Schultz, M., Siegmund, P., Steil, B., Stephanou, E. G., Stier, P., Traub, M., Warneke, C., Williams, J., and Ziereis, H.: Global Air Pollution Crossroads over the Mediterranean, Sci-ence, 298, 794–799, 2002.
Liousse, C., Cachier, H., and Jennings, S. G.: Optical and thermal measurements of black carbon aerosol content in different en-vironments: variation of the specific attenuation cross section, sigma (σ ), Atmos. Environ., 27A, 1203–1211, 1993.
Liousse, C., Penner, J. E., Chuang, C., Walton, J. J., Eddlman, H., and Cachier, H.: A global three dimensional model study of car-bonaceous aerosols, J. Geophys. Res., 101, 19 411–19 432, 1996. Luria M., Peleg, M., Sharf, G., Siman tov-Alper, D., Spitz, N., Ben Ami, Y., Gawii, Z., Lifschitz, B., Yitzchaki, A., and Seter, I.: At-mospheric sulfur over the eastern Mediterranean region, J. Geo-phys. Res., 101, 25 917–25 930, 1996.
Mihalopoulos N., Stephanou, E., Kanakidou, M., Pilitsidis, S., and Bousquet, P.: Tropospheric aerosol ionic composition above the Eastern Mediterranean Area, Tellus B, 314–326, 1997.
Moulin, C., Lambert, C. E., Dulac, F., and Dayan, U.: Control of at-mospheric export of dust from North Afica by the North Atlantic Oscillation, Nature, 387, 691–694, 1997.
Novelli, P.C., L.P. Steele, and P.P. Tans, Mixing ratios of car-bon monoxide in the troposphere, J. Geophys. Res.,97, 20,731-20,750, 1992
Quin, P. K., Bates, T. S., Coffman, D. J., Miler, T. L., Johnson, J. E., Covert, D. S., Putaud, J. P., Neus¨us, C., and Novakov, T.: A comparison of aerosol chemical and optical properties from the first and second Aerosol Characterisation Experiment, Tellus Ser. B 52(2), 239–257, 2000.
Ramanathan, V., Crutzen, P. J., Kiehl, J. T., and Rosenfeld, D.: At-mosphere – Aerosols, climate, and the hydrological cycle, Sci-ence, 294 (5549), 2119–2124, 2001.
Rosenfeld, D.: Suppression of rain and snow by urban and industrial air pollution, Science, 287, 1793–1796, 2000.
302 J. Sciare et al.: Aerosols in the Eastern Mediterranean Sea during summertime
and sulfate aerosols on the global radiation budget, J. Geophys. Res.,102, 30 107–30 117, 1997.
Sciare, J. and Mihalopoulos, N.: A new technique for sampling and analysis of atmospheric dimethylsulfoxide (DMSO), Atmos. En-vrion., 34, 151–156, 2000.
Seibert, P., Kromp-Kolb, H., Baltensperger, U., Jost, D. T., Schwikowski, M., Kasper, A., and Puxbaum, H.: Trajectory Analysis of aerosol measurements at high alpine sites, in: Pro-ceedings of EUROTRAC Symposium ‘94, (Eds) Borrel, P.M., et al., Academic Publishing BV, The Hague, 689–693, 1994. Sellegri, K., Gourdeau, J., Putaud, J. P., and Despiau, S.: Chemical
composition of marine aerosol in a Mediterranean coastal zone during the FETCH experiment, J. Geophys. Res.,106, 12 023– 12 037, 2001.
Wedepohl, K. H.: The composition of the continental crust. Geochimica et Cosmochimica Acta, 59, 1217–1232, 1995. Wojcik, G. S. and Chang, J. S.: A re-evaluation of sulfur budgets,
liftetimes and scavenging ratios for eastern North America, J. Atmos. Chem., 26, 109–145, 1997.
Zerefos, C., Ganev, K., Kourtidis, K., Tzortsiou, M., Vasaras, A., and Syrakov, E.: On the origin of SO2above Northern Greece, Geophys. Res. Lett., 27, 365–368, 2000.