HAL Id: hal-00747673
https://hal.archives-ouvertes.fr/hal-00747673
Submitted on 25 Nov 2020
HAL is a multi-disciplinary open access
archive for the deposit and dissemination of
sci-entific research documents, whether they are
pub-lished or not. The documents may come from
teaching and research institutions in France or
abroad, or from public or private research centers.
L’archive ouverte pluridisciplinaire HAL, est
destinée au dépôt et à la diffusion de documents
scientifiques de niveau recherche, publiés ou non,
émanant des établissements d’enseignement et de
recherche français ou étrangers, des laboratoires
publics ou privés.
3D modelling of the early martian climate under a
denser CO2 atmosphere: Temperatures and CO2 ice
clouds.
François Forget, R. Wordsworth, Ehouarn Millour, Jean-Baptiste Madeleine,
Laura Kerber, Jérémy Leconte, Emmanuel Marcq, R. M. Haberle
To cite this version:
François Forget, R. Wordsworth, Ehouarn Millour, Jean-Baptiste Madeleine, Laura Kerber, et al.. 3D
modelling of the early martian climate under a denser CO2 atmosphere: Temperatures and CO2 ice
clouds.. Icarus, Elsevier, 2013, 222 (1), pp.81-99. �10.1016/j.icarus.2012.10.019�. �hal-00747673�
arXiv:1210.4216v1 [astro-ph.EP] 15 Oct 2012
3D modelling of the early Martian Climate under a denser CO
2atmosphere: Temperatures
and CO
2ice clouds.
F. Forgeta,∗, R. Wordswortha, E. Milloura, J-B. Madeleinea, L. Kerbera, J. Lecontea, E. Marcqb, R.M. Haberlec
aLMD, Institut Pierre-Simon Laplace, Universit P. et M. Curie BP99, 75005 Paris , France bLATMOS, Institut Pierre-Simon Laplace, 78280 Guyancourt, France
cNASA Ames Research Center, Space Science Division, MS 245-3, Moffett Field, CA, 94035-1000, USA.
Abstract
On the basis of geological evidence, it is often stated that the early martian climate was warm enough for liquid water to flow on the surface thanks to the greenhouse effect of a thick atmosphere. We present 3D global climate simulations of the early martian climate performed assuming a faint young sun and a CO2 atmosphere with surface pressure between 0.1 and 7 bars. The
model includes a detailed representation of radiative transfer using revised CO2 gas collision induced absorption properties, and
a parameterisation of CO2 ice cloud microphysical and radiative properties. A wide range of possible climates is explored using various values of obliquities, orbital parameters, cloud microphysic parameters, atmospheric dust loading, and surface properties.
Unlike on present-day Mars, for pressures higher than a fraction of a bar surface temperatures vary with altitude because of adiabatic cooling / warming of the atmosphere. In most simulations, CO2 ice clouds cover a major part of the planet. Previous
studies suggested that they could have warmed the planet thanks to their scattering greenhouse effect. However, even assuming parameters that maximize this effect, it does not exceed +15 K. Combined with the revised CO2spectroscopy and the impact of
surface CO2ice on the planetary albedo, we find that a CO2 atmosphere could not have raised the annual mean temperature above
0◦
C anywhere on the planet. The collapse of the atmosphere into permanent CO2ice caps is predicted for pressures higher than 3 bar,
or conversely at pressure lower than one bar if the obliquity is low enough. Summertime diurnal mean surface temperatures above 0◦C (a condition which could have allowed rivers and lakes to form) are predicted for obliquity larger than 40◦at high latitudes
but not in locations where most valley networks or layered sedimentary units are observed. In the absence of other warming mechanisms, our climate model results are thus consistent with a cold early Mars scenario in which non climatic mechanisms must occur to explain the evidence for liquid water. In a companion paper by Wordsworth et al., we simulate the hydrological cycle on such a planet and discuss how this could have happened in more detail.
Keywords:
Mars, Atmospheres, evolution, Mars, climate, Mars, polar caps, Mars, surface
1. Introduction
Spacecraft sent to Mars in recent years have revealed new evidence suggesting that the environmental conditions on early Mars were very different than those today, with liquid water flowing on the surface at least episodically. Geomorpholog-ical evidence of past water flow in ancient terrains includes valley networks (remnant of widespread fluvial activity) (Carr, 1996), extensive sedimentary layered deposits (including delta-like landforms)(Malin and Edgett, 2000, 2003) and erosion rate much higher than today affecting the most ancient landforms (Craddock and Maxwell, 1993). Satellite remote sensing and in-situ analysis of the surface mineralogy have also revealed the local presence of minerals that require liquid water for their formation: clay/phyllosilicates (Poulet et al. 2005, Bibring et al. 2006, Ehlmann et al. 2011), sulfates (Gendrin et al. 2005, Squyres et al. 2004), opaline silica (Squyres et al. 2008), car-bonate (Ehlmann et al. 2008, Boynton et al. 2009, Morris et al.
∗Corresponding author. E-mail: forget@lmd.jussieu.fr
2010) and chloride (Osterloo et al., 2008).
All these observations have provided a wealth of information about early Mars. In particular, they suggest that the condi-tions strongly varied throughout the Noachian and Hesperian era. Nevertheless, we still do not know if the conditions suit-able for liquid water were stsuit-able on long timescales, or if they were the consequence of episodic, possibly catastrophic events. What is clear is that the conditions which allowed such exten-sive alteration by liquid water occurred early in the history of Mars and not later. In particular, the fact that some alteration minerals can still be observed today, although they formed sev-eral billion years ago and are easily transformed into other ma-terials by, e.g., diagenesis, suggests that water has been very limited on the martian surface from soon after their formation until today (Tosca and Knoll, 2009)). Similarly the majority of the valley networks are found almost exclusively in the highly cratered ancient southern highlands, which date back from the end of the heavy bombardment period some 3.5-3.8 Gyr ago (Fasset and Head, 2008).
vol-canism or impacts) with respect to atmospheric induced pro-cesses is not clear, climate conditions were certainly different on early Mars. It is possible that the atmosphere could have been thicker than today, providing an environment more suit-able for liquid water thanks to a surface pressure well above the triple point of water, and possibly a greenhouse effect capable of warming the surface closer to the melting points at 0◦C. In
analogy with Earth and Venus, even after taking into account the differences in size, it can be estimated that the initial in-ventory of volatiles on Mars included at least several bars of atmospheric gases, mostly CO2(see Haberle et al. 1998). On
this basis, since the 1980s many studies have been performed to characterize the possible climate on early Mars assuming a CO2
atmosphere thicker than today, and taking into account the fact that according to stellar evolution models the Sun’s luminosity at 3.8 Ga was 75% of its present value (e.g., Gough, 1981). Al-most all of these studies were performed using one-dimensional (1-D) radiative convective models (see Section 2). Characteri-zation has been challenging however, because of the complex CO2 gas spectroscopy, the likely formation of CO2 ice clouds
in the atmosphere, and the four-dimensional aspects of plane-tary climate. The primary goal of the present paper is to update these calculations using a full 3-D climate model including a parameterization of CO2ice clouds and state of the art
spectro-scopic data. In a companion paper (Wordsworth et al., 2012) we extend these calculations by including a model of the pos-sible water cycle that takes into account the radiative effects of water vapor and clouds, and can predict precipitation and the formation of lakes and glaciers on early Mars. To start with, in Section 2 and 3 we review previous work on modelling early Mars climate, and briefly discuss the possible early Mars at-mosphere composition and thickness. Section 4 describes our Global Climate Model (GCM). The simulated climates for var-ious pressures, cloud microphysics parameters, obliquity val-ues, orbital parameters, and possible atmospheric dust loading scenarios are analysed in Section 5. Finally, in Section 6, we discuss and summarise our results.
2. Previous Modelling Studies
The climate modelling studies of early Mars performed be-fore 1998 are reviewed in detail in Haberle (1998). By the end of the 1980s, the paradigm for early Martian climate was based on the results of Pollack et al. (1987). Using a 1-D radiative convective model, they had shown that a 5-bar gaseous CO2
at-mosphere would raise the global mean surface temperature to 0◦
C, allowing “warm and wet” conditions (though large, 5 bars of CO2 was still consistent with contempory estimates of the
available inventory). This scenario was later challenged when Kasting (1991) published his reanalysis of the Pollack et al. (1987) greenhouse calculations. Kasting used the same model, but took into account the fact that at higher pressures CO2can
condense in the middle atmosphere. This seriously decreases the greenhouse effect because of the latent heat warming of the middle atmosphere. Furthermore Kasting suggested that the resulting CO2 ice clouds would probably raise the
plane-tary albedo and further cool the planet. However, still working
with the same model, Forget and Pierrehumbert (1997) later showed that the inclusion of the CO2ice cloud radiative effect at
both solar and thermal infrared wavelengths led to a net warm-ing of the surface rather than a coolwarm-ing. Indeed, assumwarm-ing that the CO2 ice cloud particles are larger than a few micrometers,
they can readily scatter infrared radiation and reflect outgoing thermal radiation back to the surface. The resulting warming effect more than compensates for the albedo increase due to the clouds. These calculations were later confirmed by Mis-chna et al. (2000), who used a more sophisticated and accurate 1-D radiative-convective transfer model based on correlated k-distribution methods. They noted that CO2 ice clouds could
also cool the surface if they are low and optically thick, and con-cluded that “estimating the actual effect of CO2clouds on early
martian climate will require three-dimensional models in which cloud location, height, and optical depth, as well as surface tem-perature and pressure, are determined self-consistently”. Nev-ertheless, the physics of carbon dioxide clouds in a dense CO2
atmosphere was further explored by Colaprete and Toon (2003) still using a 1-D atmospheric model, but including a detailed microphysical cloud model. They took into account laboratory studies by Glandorf et al. (2002) showing that high critical su-persaturations are required for CO2 cloud particle nucleation
and that surface kinetic growth is not limited. Under such con-ditions, Colaprete and Toon (2003) predicted large carbon diox-ide ice particles with radii greater than 500 µm, and thus low cloud opacities. Because of this, and because of the warming of the atmosphere associated with cloud formation, they esti-mated that the greenhouse effect of CO2clouds would probably
be limited to 5-10 K surface warming.
All these studies took into account the radiative effect of CO2
and water vapor. Postawko and Kuhn (1986) also explored the possible greenhouse effect of SO2. Yung et al. (1997) resumed
this investigation, and studied the radiative effect of a very small amount (0.1 ppmv) of SO2in a 2 bar CO2 atmosphere in a 1D
model. They showed that it would raise the temperature of the middle atmosphere by approximately 10 K, so that the upper at-mosphere would globally remain above the condensation tem-perature of CO2. Exploration of the impact of SO2was further
motivated by the discovery of sulfate sediments in Mars’ an-cient terrains (Gendrin et al. 2005, Squyres et al. 2005, Halevy et al. 2007). Johnson et al. (2008) investigated the impact of larger amount of sulfur volatiles (H2S and SO2 mixing
ra-tios of 1 to 1000 ppmv) in a martian atmosphere of 50 and 500 mbar of CO2 (with H2O). For this purpose they used the
3D Mars Weather Research and Forecasting (MarsWRF) GCM (Richardson et al., 2007). Their control simulations, achieved with a pure CO2atmosphere or with CO2+ H2O (but neglecting
the radiative effects of CO2clouds or H2O clouds) are of
inter-est in the present paper for comparison. Calculations performed including the sulfur volatile influxes suggested that these gases could have been responsible for greenhouse warming up to 25 K above that caused by CO2. However, Tian et al. (2010) showed
that such large amounts of SO2would inevitably lead to the
for-mation of sulfate and large reduced sulfur aerosols (S8). They
concluded that these aerosols would have raised the planetary albedo and that the resulting cooling would more than outweigh
the gaseous greenhouse effect.
In this paper, we do not include the effect of sulfur volatiles or aerosols. Our goal is to investigate the details of the cli-mate induced by a CO2atmosphere as simulated by a 3D GCM
in which CO2 cloud location, height, and optical depth, as
well as surface temperature and pressure, are determined self-consistently for the first time. In comparison to the previous studies mentioned above, we also benefit from an improved pa-rameterization of the collision-induced absorption of CO2
(im-portant for pressure larger than a fraction of a bar) that we have developed for this project, as described in Wordsworth et al. (2010) (see details in Section 4.2). To calculate the collision-induced opacity in a CO2atmosphere, all the studies mentioned
above relied without modification on a parameterization origi-nally derived for the Venus atmosphere by James Pollack (Pol-lack et al., 1980; see detailed description in Kasting et al. 1984). It was based on the measurements of Ho et al. (1971) from 7 to 250 cm−1, and on a simple parameterization of collision
induced opacity in the other spectral domains described in an unpublished PhD thesis by John F. Moore (Moore ,1971), still available as a NASA report). This parameterization included significant opacities between 526 and 295 cm−1resulting from
the pressure induced wings of the strong 15 µm bands. Un-fortunately, this feature was kept in subsequent models, despite the fact that these opacities were probably overestimated and, in most cases, already accounted for in the codes chosen to cal-culate the radiative transfer in the 15 µm band. As a result, most previous studies probably overestimated the greenhouse warming of CO2by several Kelvins.
3. Which atmosphere for early Mars?
By scaling the Earth or Venus volatile inventory, one can es-timate that the amount of CO2brought to Mars during accretion
was probably larger than 10 bars. However, Tian et al. (2009) showed that the extreme ultraviolet flux from the young sun was so high that it would have strongly warmed the thermosphere and induced thermal escape of a primordial CO2-dominated
martian atmosphere. In their calculation, a CO2 atmosphere
could not have been maintained until about 4.1 billion years ago. Under such conditions, how much atmosphere could have been degassed late enough after 4.1 Ga during the mid to late Noachian? Phillips et al. (2001) estimated that the total re-lease of gases from the magmas that formed Tharsis during the Noachian era could have produced the integrated equivalent of a 1.5-bar CO2atmosphere. However, they assumed a magmatic
CO2 content of 0.65 weight percent, consistent with Hawaiian
basaltic lavas. Since then, several authors have suggested that this was probably overestimated. In particular, Hirschmann and Withers (2008) calculated that post-4.5 Ga magmatism could have provided only 0.1 to at most 1 bar of CO2. To refine these
conclusions, Grott et al. (2011) combined the Hirschmann and Withers (2008) model for the solubility of CO2with a
thermo-chemical evolution model to self consistently calculate the dis-solved amount of CO2in martian magmas. They estimated that
during Noachian, about 250 mbar of CO2 were outgassed
be-tween 4.1 and 3.7 Ga.
In spite of these studies, if one assumes that more than one bar of atmospheric CO2 was present during the Noachian era,
where did it go? Estimating the amount of atmosphere that could have escaped to space in the last 4 Gyr is difficult be-cause many different processes may have been involved, in-cluding photochemical escape, ions dragged by the solar wind field, sputtering, and impact erosion (Chassefiere and Leblanc, 2004). Up to now, only the present-day Mars ion loss by solar wind interaction has been measured, and found to be very small (Barabash et al., 2007). The possible loss of volatiles resulting from large impacts (Melosh and Vickery 1989) is also difficult to model and constrain, but recent studies suggest that it must have been small (Pham et al., 2011). Altogether, the most re-cent estimations of the amount of CO2lost to space in the past
3.5 Gyr are below a few hundreds of millibars (Leblanc and Johnson, 2002, Lammer et al. 2008, 2010).
Alternatively, one classical hypothesis is to assume that, as on Earth, large amounts of CO2 could be stored in form of
carbonates in the martian crust after chemical precipitation. However, almost no carbonates were initially detected by the OMEGA imaging spectrometer in spite of its high sensitivity to the spectral signature of carbonates (Bibring et al., 2005). Recently, several observations from orbiters (Ehlmann et al., 2008) and landers (Boynton et al. 2009, Morris et al. 2010) have revived the carbonate hypothesis and reasserted the im-portance of carbon dioxide in martian climate history (Harvey, 2010).
In this paper, we have chosen to explore the possible climate on early Mars for a wide range of surface pressures, up to 7 bars, as assumed in previous works on the same topic. However, when interpreting our model results, it is important to keep in mind that atmospheres thicker than one bar may be unlikely.
Another issue for an early Mars CO2atmosphere is its
pho-tochemical stability. Using a 1-D phopho-tochemical model of the martian atmosphere, Zahnle et al. (2008) showed that in a thick, cold and dry CO2 atmosphere in which a surface sink is
as-sumed for reactive oxidized gases (like H2O2 and O3), CO2
would tend to be reduced into CO. They noted that the pro-cess is very slow, and that “CO2 atmospheres can be unstable
but persistent simply because there isn’t time enough to destroy them”.
Finally, in this work we did not take into account the pres-ence of other possible greenhouse gases. Such gases are not expected to be photochemically stable since they should have been photodissociated or oxydized, but they may be present if geochemical sources were active enough. This is further dis-cussed in section 6.3.
4. Global Climate Model description
4.1. Generalities
We have used a new “generic” version of the LMD Global Climate Model recently developed to simulate any kind of at-mosphere with the goal of studying early climates in the solar system (this paper) as well as possible climates on extrasolar planets (e.g. Wordsworth et al. 2011b). In practice, the model
is derived from the LMD present-day Mars GCM (Forget et al. 1999), with several new parameterizations (see below and Wordsworth et al. (2012)). This Mars GCM has been used successfully to simulate Mars meteorology (e.g. Forget et al. 1998, Montmessin et al. 2004, Madeleine et al. 2011) and pho-tochemistry (Lefevre et al. 2004, 2008) from the surface to the thermosphere, and to simulate recent climate changes induced by the oscillations of Mars’ rotational and orbital parameters (Levrard et al. 2004, Forget et al. 2006, Montmessin et al. 2007a, Madeleine et al. 2009). The LMD GCM solves the primitive equations of meteorology using a finite difference dy-namical core on an Arakawa C grid. This dydy-namical core has been used and tested successfully in many kind of atmospheres thicker than present-day Mars such as the Earth (e.g. Hourdin et al. 2004), Venus (Lebonnois et al. 2010), and Titan (Hourdin et al. 1995, Lebonnois et al. 2012).
In this paper, simulations were performed with two horizon-tal resolutions: 32×24 (corresponding to resolutions of 7.5◦
lat-itude by 11.25◦longitude) and 64×48 (3.75◦latitude by 5.625◦
longitude). In the vertical, the model uses hybrid coordinates, that is, a terrain-following σ coordinate system near the sur-face and lower atmosphere (σ is pressure divided by sursur-face pressure), and pressure levels in the upper atmosphere. In this work, with the exception of one sensitivity study described in section 5.2, we used 15 layers with the lowest mid-layer levels at about 18 m, 60 m, 150 m, 330 m, 640 m etc., and the top level at 0.3% of the surface pressure, that is about 5.3 scale heights (>50 km) above the zero datum.
Nonlinear interactions between explicitly resolved scales and subgrid-scale processes are parameterized by applying a scale-selective horizontal dissipation operator based on an n time iterated Laplacian ∆n. This can be written ∂q/∂t = ([−1]n/τdiss)(δx)2n∆nq where δx is the smallest horizontal
dis-tance represented in the model, τdissis the dissipation timescale
for a structure of scale δx, and q a variable like temperature, meridional wind, or zonal wind. As in most GCMs, this dissi-pation operator is necessary to ensure the numerical stability of the dynamical core. However, it must be used with moderation (i.e. the dissipation timescales must be kept as high as possi-ble). In particular, during this study we found that, when used with large topography variations and with atmospheric pressure larger than about one bar, our dissipation scheme tended to ar-tificially produce some heat in the lower atmosphere. This pro-duction is usually completely negligible, but with high pressure and a strong greenhouse effect like in some of our simulations we found that the impact on surface temperatures could be non-negligible if the dissipation timescale were chosen smaller than necessary. This meant that our initial results overestimated the warming possible due to CO2clouds in the early martian
atmo-sphere, and hence the likelihood of warm, wet conditions under a pure CO2atmosphere (Wordsworth et al. 2011a). Fortunately,
we have been able to identify this issue, reduce the dissipation, and demonstrate that this problem does not affect the energy balance of the results presented in this paper.
Subgrid-scale dynamical processes including turbulent mix-ing and convection are parameterized as in Forget et al. (1999). In practice, the boundary layer dynamics are accounted for
by Mellor and Yamada’s (1982) unstationary 2.5-level closure scheme plus a “convective adjustment” which rapidly mixes the atmosphere in the case of unstable temperature profiles. Turbu-lence and convection mixes energy (potential temperature), mo-mentum (wind), and tracers (gases and aerosols). The subgrid-scale orography and gravity wave drag schemes of the present-day Mars GCM (Forget et al. 1999) were not applied.
Surface temperature evolution is governed by the balance be-tween radiative and sensible heat fluxes (direct solar insolation, thermal radiation from the atmosphere and the surface, and tur-bulent fluxes) and thermal conduction in the soil. The param-eterization of this last process was based on an 18-layer soil model solving the heat diffusion equation using finite differ-ences. The depth of the layers were chosen to capture diurnal thermal waves as well as the deeper annual thermal wave. Ver-tically homogeneous soil was assumed. For most simulations, the thermal inertia was set to 250 J s−1/2m−2K−1everywhere (a
value slightly higher than the mean value on present-day Mars, to account for the higher gaseous pressure in the pore space, which increases the soil conductivity). For the ground albedo, as well as for the topography, we chose to keep the same dis-tributions as observed on Mars today. Both fields may have been quite different three billion years ago, but we assume that the present-day values can be representative of the range and variability of the Noachian-Hesperian eras. In Section 5.1, the sensitivity of our results to surface thermal inertia and albedo is discussed.
4.2. Radiative transfer in a thick CO2atmosphere
Our radiative scheme is based on the correlated-k model, with the absorption data calculated directly from high resolu-tion spectra computed by a line-by-line model from the HI-TRAN 2008 database (Rothman et al., 2009). These were then converted to correlated-k coeficients for use in the radiative transfer calculations.
In practice, at a given pressure and temperature, correlated-k coefficients in the GCM are interpolated from a matrix of co-efficients stored in a 6 × 9 temperature and log-pressure grid:
T = 100, 150, 200, 250, 300, 350 K, p = 10−1, 100, 101, ....,
107Pa. We used 32 spectral bands in the thermal infrared and
36 at solar wavelengths. Sixteen points were used for the g-space integration, where g is the cumulated distribution func-tion of the absorpfunc-tion data for each band. Rayleigh scattering by CO2molecules was included using the method described in
Hansen and Travis (1974), and using the Toon et al. (1989) scheme to compute the radiative transfer.
As mentioned in Section 2, a key improvement of our ra-diative transfer model compared to previous models is the use of an improved parameterization for the CO2collision-induced
absorption (CIA). It was specially developed for the present study using the results of Baranov et al. (2004) and Gruszka and Borysow (1998). The method is described and justified in Wordsworth et al. (2010). The sublorentzian profiles of Perrin and Hartmann (1989) were used for the CO2far line absorption.
4.3. CO2ice condensation and clouds
The model includes a parameterization to account for the possible condensation of CO2when temperatures fall below the
condensation temperature Tc. To compute Tcas a function of pressure p (Pa), we used the expression provided by Fanale et al. (1982):
Tc= −3167.8/[ln(0.01p) − 23.23] (1)
for p < 518000 Pa,
Tc= 684.2 − 92.3 ln(p) + 4.32 ln(p)2 (2)
for p > 518000 Pa (518000 Pa is the pressure of the triple point of CO2).
As on Mars today, CO2 can directly form on the ground.
When the surface temperature falls below the condensation temperature, CO2condenses, releasing the latent heat required
to keep the solid-gas interface at the condensation temperature. Conversely, when CO2 ice is heated, it partially sublimates to
keep its temperature at the frost point. When CO2ice is present,
the surface albedo and emissivity are set to 0.5 and 0.85 respec-tively. On present-day Mars, this albedo varies a lot in space and time. 0.5 is consistent with the various estimations of the average CO2 ice cap albedo used to fit the seasonal pressure
variations induced by the condensation and sublimation in the polar caps (Forget et al. 1998, Haberle et al. 2008)
In our simulations, CO2 ice clouds also form in the
atmo-sphere. Such clouds have been observed on present-day Mars during the polar night in the lower atmosphere (see e.g. Pet-tengill and Ford, 2000, Tobie et al. 2003) and in the equato-rial mesosphere around 60-80 km (Montmessin et al. 2007b, M¨a¨att¨anen et al. 2010). These mesospheric CO2ice clouds may
share some similarities with those predicted in our early Mars simulations. However they form more rarely (probably because the atmosphere is not often below the frost point (Gonzalez-Galindo 2010, Forget et al. 2009)) and at significantly lower pressures (0.1 to 0.01 Pa). In spite of this, the observed opti-cal depths and particle radii are large (typiopti-cally around 0.2 and 3 µm, respectively), suggesting that the growth of CO2ice
par-ticles in a CO2gas atmosphere is a very efficient process.
In theory, to properly model the formation of such clouds, one must take into account various microphysical processes such as supersaturation, nucleation and crystal growth (Wood 1999, Colaprete and Toon 2003). In most of our simulations, however, we assumed that condensation would occur as soon as the temperature T∗predicted from the dynamical and
radia-tive cooling rates dropped below Tc. In section 5.3, we also present results from a test case in which a 30% supersaturation is required before condensing.
At each timestep, the mass mixing ratio m (kg/kg) of con-densed ice in a model box (or its evolution δm if ice is al-ready present) is simply deduced from the amount of latent heat needed to keep T = Tc:
δm = cp
L(Tc−T
∗
) (3)
with δm the mass mixing ratio of ice that has condensed or sublimated (>0 when condensing), cpthe specific heat at con-stant pressure (we took 735.9 J kg−1K−1) and L the latent heat
of CO2(5.9 × 10⁵J kg−1).
CO2ice is transported by the large-scale circulation and by
turbulent and convective mixing. The transport scheme used in our GCM is a “Van-Leer I” finite volume scheme (Hourdin and Armengaud, 1999).
To estimate the size of the cloud particles, we assumed that the number mixing ratio of cloud condensation nuclei [CCN] (kg−1) is constant throughout the atmosphere. Assuming that
the cloud particle size distribution is monodisperse in each box, the cloud particle radius r is then given by:
r = ( 3m
4πρ [CCN])
1/3 (4)
with ρ the CO2ice density, set to 1620 kg m−3in our model.
Once r is known, the cloud particle sedimentation velocity
w is calculated using Stokes law (Rossow, 1978).
Sedimenta-tion is then computed separately from the transport, but using a similar Van-Leer I transport scheme in the vertical.
Sedimentation and condensation are strongly coupled. Within one physical timestep (1/48 of a sol, or 1850 s in our model), we found that a significant part of the ice that forms within a cloud can sediment to the layers below, where it can condense at a different rate or even sublimate. For these rea-sons, in the model, condensation and sedimentation schemes are coupled together and integrated with a sub-timestep equal to 1/20 of the physical timestep.
The cloud particle sizes are also used to calculate the cloud radiative effect. Refractive indices for CO2ice are taken from
Hansen (2005) and Mie theory is assumed to retrieve the single scattering properties. Scattering and absorption are computed at both solar and thermal infrared wavelengths using the Toon et al. (1989) scheme.
[CCN] is clearly a key parameter which directly controls the properties and the impact of the modeled clouds. Exploring the sensitivity of the results to this poorly known parameter allows us to account for most of the uncertainties related to the CO2
ice clouds microphysics and particles size distribution. What is the possible range of [CCN]? On the Earth, the number mix-ing ratio of cloud condensation nuclei in the troposphere ranges between 106 kg−1 (for low saturation in clean polar air) and
1010kg−1(polluted air mass)(Hudson and Yun, 2002,Andreae,
2009). It is significantly lower for icy cirrus clouds (<104kg−1)
(e.g. Demott et al. 2003) . Even in the absence of surface or chemical sources, a minimum number of nuclei would be provided by meteoritic dust and smoke particles, which have been suggested to be possible condensation nuclei for terres-trial Polar Mesospheric Clouds (Gumbel and Megner, 2009). Such particles must have been abundant four billion years ago. In this paper, we explore [CCN] values ranging from 102kg−1
to 108kg−1, with a baseline value of 105kg−1.
4.4. Atmospheric dust
Early Mars winds were probably able to lift and transport mineral dust from the surface. If the planet was dry enough,
and in the absence of oceanic sinks as on the Earth, we must take into account the possibility that the atmosphere was laden with mineral aerosols, as on Mars today. To explore the impact of atmospheric dust on the early Mars climate, we added a sec-ond type of aerosol in addition to the CO2ice clouds particles.
We assume that the dust is similar to that observed on present-day Mars and use Wolff et al. (2009) optical properties, with a constant effective radius of 1.5 µm. Instead of simulating the lifting and transport of dust by the winds, we prescribe the dust mixing ratio in the atmosphere and assume that it does not vary with time. The column averaged dust optical depth at the mean pressure level is horizontally uniform. In the vertical, the dust mixing ratio q is taken to be constant in the lower atmosphere up to a level above which it rapidly declines, as in Forget et al. (1999): q = q0exp n 0.007h1 − (p0/p)(70 km/zmax) io p ≤ p0 (5) q = q0 p > p0 (6)
where q0 is a constant determined by the prescribed optical
depth at the global average surface pressure p0, and zmaxthe
al-titude (km) of the top of the dust layer. In this paper simulations were performed with zmax= 30 and 100 km (see Section 5.5).
5. Results
To explore the range of climates that may have occurred on a planet like early Mars with a thick CO2 atmosphere, we have
performed multiple simulations with different values of key model parameters : 1) mean surface pressure, 2) cloud micro-physics parameters (i.e. cloud condensation nuclei density), 3) obliquity and eccentricity, 4) surface properties, 5) atmospheric dust loading. The impact of water vapor is also discussed. Solar luminosity is set to 75% of the present value (see Section 6.2 for a discussion of this assumption). The solar spectrum was assumed to be the same as today. All results correspond to the last year of a 10-year simulation. In all cases, the mod-elled planet has reached equilibrium by this time (results are repeatable from year to year), except in the case of permanent CO2condensation, which induces a slow decrease of the
atmo-spheric mass and pressure (atmoatmo-spheric collapse; see below).
5.1. Surface temperatures and CO2ice caps.
In this section, we describe simulations performed assum-ing a circular orbit, 25◦
obliquity as on present-day Mars, no dust, and a constant cloud condensation nuclei number density [CCN] set to 105kg−1.
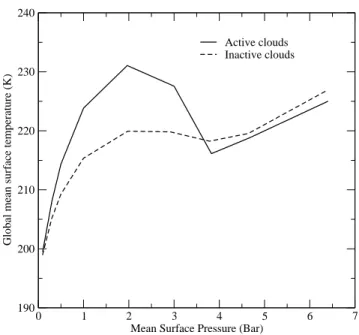
Figure 1 presents global/annual mean surface temperature (K) as a function of mean surface pressure Ps. Results ob-tained without taking into account the radiative effects of CO2
ice clouds (the clouds are assumed to be “transparent” at all wavelengths) are in agreement with previous 1D model calcu-lations performed with the same radiative transfer parameteri-zation (Wordsworth et al. 2010). Surface temperature increases up to Ps = 2 bar. Above 2-3 bar Rayleigh scattering by CO2
gas more than compensates for the increased thermal infrared
0 1 2 3 4 5 6 7
Mean Surface Pressure (Bar) 190 200 210 220 230 240
Global mean surface temperature (K)
Active clouds Inactive clouds
Figure 1: Global mean annual mean surface temperature (K) as a function of surface pressure in our baseline simulations (obliquity = 25◦, [CCN]=105kg−1,
circular orbit) with and without radiatively active CO2ice clouds.
0 1 2 3 4 5 6 7
Mean Surface Pressure (Bar) 30 40 50 60 70 80 Radiative flux (W/m²)
Absorbed solar radiation (global mean) (W/m²) Outgoing longwave radiation (global mean) (W/m²)
Inactive clouds
Active clouds
Figure 2: Global mean annual mean radiative budget for the same simulations as in Figure 1 with or without radiatively active clouds. After 10 years, simula-tions with surface pressure higher than 3 bars are out of equilibrium because of atmospheric collapse and the constant release of latent heat at the surface.
opacity of the atmosphere. Increasing the atmospheric thick-ness does not result in an increase of the mean surface tem-perature. Taking into account the radiative effect of CO2 ice
clouds results in a global warming of the surface by more than 10 K resulting from the CO2 ice cloud scattering greenhouse
effect (Forget and Pierrehumbert, 1997). In the GCM, this ef-fect is significant, but not as much as it could have potentially been according to the estimation by Forget and Pierrehumbert (1997). This is mostly because the cloud opacities remain rel-atively low compared to what was assumed in that study (see below). Figure 2 shows the radiative budget corresponding to Figure 1 simulations. One can see that the clouds strongly raise the planetary albedo and thus decrease the absorbed solar radia-tion. On this plot, one can verify that the absorbed solar energy is equal to the emitted infrared energy (i.e. the simulated planet is in radiative equilibrium as expected), except at high pressure when the atmosphere collapses on the surface and releases la-tent heat, as detailed below.
Figure 3 presents the seasonal and latitudinal variation of zonal mean surface temperature and surface CO2 ice for the
different surface pressure experiments. The maximum accumu-lation of CO2ice is not found exactly at the poles because CO2
ice clouds are predicted to be especially thick there, and their effect on the incident thermal infrared flux tend to limit the sur-face cooling and thus the sursur-face condensation.
With 0.5 ≤ Ps ≤ 2 bar, seasonal CO2 ice caps are predicted
to form at high latitudes during fall, winter and spring as in the Mars northern hemisphere today. For Ps ≤ 0.3 bar, how-ever, permanent surface CO2ice glaciers are predicted to form
at high latitudes in both the radiatively active and inactive cloud cases. In these simulations, the atmosphere is collapsing and the results after 10 years may not represent a realistic long-term solution. Many more years would be required to reach a steady state in which the permanent CO2ice caps would be in
solid-gas equilibrium with the atmosphere, with a significant part of the atmosphere trapped on the surface.
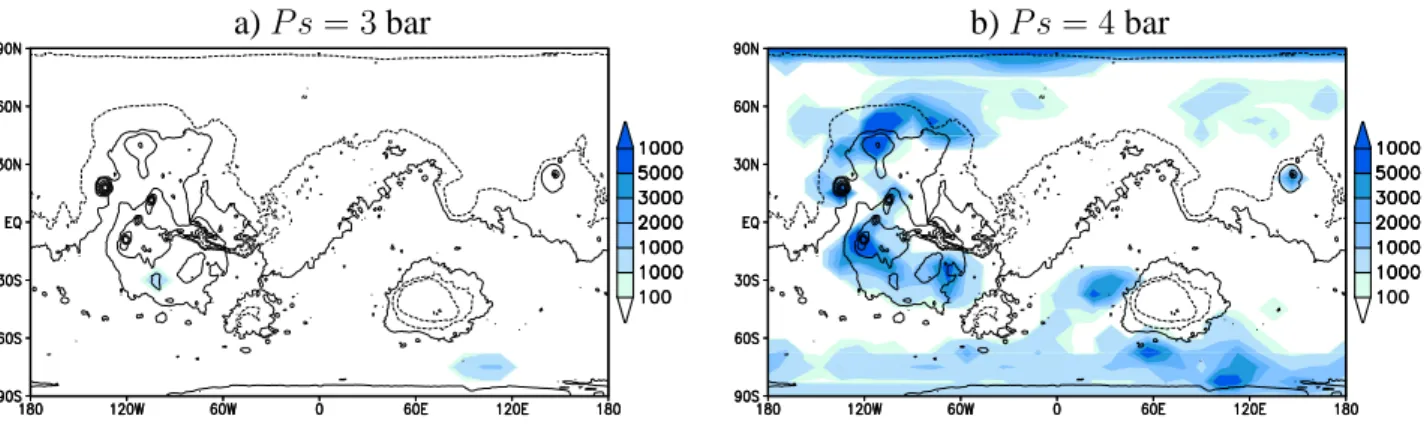
Figure 4 show maps of the extension of the permanent CO2
caps after 10 and 25 years. Between 1 and 25 years, the atmo-spheric mass collapses by 1% per year in the (initially) 0.1-bar simulations, whereas the pressure drops by only 0.032% per year in the 0.3-bar case. To properly simulate an equilibrated atmosphere/permanent CO2 ice cap system, it would also be
necessary to take into account the ability of CO2 ice glaciers
to flow and spread (CO2ice is known to be much softer than
H2O ice at the same temperature (Kreslavsky and Head, 2011,
Durham et al. 1999)), and probably to include the effect of slopes and roughness (Kreslavsky and Head, 2005).
The formation of permanent polar caps at low pressure is also very dependent on obliquity. This is discussed in detail in sec-tion 5.4.
For Ps ≥ 3 bar, permanent surface CO2ice glaciers are also
predicted to form on the surface in both the radiatively active and inactive cloud cases. CO2 ice tends to condense
perma-nently in the colder areas at high altitudes and latitude. In the Ps = 3 bar case, the permanent CO2 ice glaciers are
re-stricted to a couple of locations on the Tharsis bulge near 30◦
S-100◦W, and in the southern high latitudes around 75◦S-100◦E
0 0.5 1 1.5 2 2.5 3
Mean surface pressure (bar) -3 -2.5 -2 -1.5 -1 -0.5 0
Mean surface temperature lapse rate (K/km)
Figure 7: Mean surface temperature variation with topography (K/km) as a function of mean surface pressure (bar). This lapse rate is obtained by perform-ing a linear regression between the annual mean surface temperature obtained below 30◦
latitude (to avoid the influence of the polar caps) and the local topog-raphy in our baseline cases (obliquity = 25◦, [CCN]=105kg−1, circular orbit).
(Figure 5a). For Ps = 4 bar and more, the permanent CO2
ice sheets are much more extensive, covering high latitudes and most of the Tharsis bulge (Figure 5b).
The fact that permanent CO2 ice cap form at either low or
high pressure can be interpreted as follows : At low pressures, the greenhouse effect and heat transport are weak and thus tem-peratures easily reach the frost point. At high pressures the increase in the frost point temperature overcomes the increased greenhouse effect and CO2 also condense easily. In addition,
heat transport is then so efficient that horizontal temperature gradients are small. Consequently, CO2 ice can form in
non-polar regions.
The formation of extensive permanent and seasonal polar caps at high pressures buffers the surface temperature and ex-plains the increase of global mean surface temperature for
Ps ≥4 bar in Figure 1. In these simulations, thick CO2 ice
clouds form just above the surface. Such clouds tend to cool the surface (Mischna et al., 2000) because they reflect solar ra-diation throughout their entire depth (the planetary albedo is increased) whereas only the upper layers can contribute to re-flect the thermal infrared flux emitted by the atmosphere be-low them. As a result, the radiatively active clouds simula-tions show mean surface temperatures even lower than when the clouds are assumed to be transparent.
Figures 6a and 6b present annual mean surface temperature maps in the more realistic Ps =0.5 and 2 bar cases. One can no-tice that surface temperatures strongly depend on the local to-pography, especially in the 2 bar simulations in which the low-est plains are the warmlow-est places on Mars. This is not due to a stronger greenhouse warming where the atmosphere is thicker. As illustrated on Figure 1, the increase of surface temperature with CO2 pressure due to the greenhouse effect is weaker at
high pressure and negligible above 2 bars. The opposite is found in our maps.
a) P s = 0.1 bar
b) P s = 0.3 bar
c) P s = 0.5 bar
d) P s = 1 bar
e) P s = 2 bar
f) P s = 3 bar
g) P s = 4 bar
h) P s = 5 bar
Figure 3: Zonal mean surface temperatures (contours, K) and surface CO2 ice (kg m−2) as a function of solar longitude Ls (degree) for various mean surface pressures Ps (obliquity=25◦, [CCN]=105kg−1, circular orbit).
a) P s = 0.1 bar, after 10 years
b) P s = 0.3 bar, after 10 years
a) P s = 0.1 bar, after 25 years
b) P s = 0.3 bar, after 25 years
Figure 4: Maps of the permanent surface CO2ice deposits (kg m−2) for the Ps = 0.1 and Ps = 0.3 bar simulations, also shown in Figure 3. In practice, these
maps show the yearly minimum CO2ice mass recorded during the 10th and 25th simulated years, to show where the ice never sublimates during the year. Contours
illustrate topography (contours below zero elevation are dotted)
a) P s = 3 bar
b) P s = 4 bar
Figure 5: Same as Figure 4, but for the Ps =3 and 4 bar simulations (also shown in Figure 3). These show the yearly minimum CO2ice mass (kg m−2) recorded
Ps=0.5 bars
Ps=2 bars
a) Annual mean temperatures (K)
b) Annual mean temperatures (K)
c) Max daily mean temperatures (K)
d) Max daily mean temperatures (K)
e) Maximum temperatures (K)
f) Maximum temperatures (K)
Figure 6: Surface temperatures (K) in our baseline simulations (obliquity=25◦
, [CCN]=105 kg−1, circular orbit) for mean surface pressure 0.5 bar and 2 bar.
In fact, Earthlings are familiar with this situation, which re-sults from adiabatic cooling and warming of the atmosphere when it moves vertically and the fact that the atmosphere can influence the surface temperature when it is dense enough. On present-day Mars, the atmosphere is too thin to affect the sur-face temperature. The local topography has no significant ef-fect on surface temperature. At which atmospheric pressure does the transition between a “present-day Mars regime” and an “Earth-like regime” occur? To address this question, we have computed the mean surface temperature lapse rate as a function of mean surface pressure (Figure 7). The lapse rate is simply es-timated by performing a linear regression between annual mean surface temperatures and ground altitude at every grid point for latitudes lower than 30◦, to avoid the influence of seasonal CO
2
ice condensation. We can see that the surface temperature lapse rate quickly decreases with increasing pressure. The effect is already significant (-1.5 K/km) for Ps = 0.5 bar, and reaches an asymptotic value (-2.5 K/km) above about 2 bars. This is half the theoretical dry atmospheric lapse rate equal to -5.05 K/km in our model. This can be compared to the Earth case, where surface temperature lapse rates ranging between around -3 and -6.5 K/km have been reported (See Minder et al., 2010, and ref-erences therein), while the reference dry atmospheric lapse rate is -9.8 K/km. However, on the Earth water condensation can decrease the lapse rate by a factor of two.
In our simulations, annual mean surface temperatures are al-ways significantly below 0◦C. In theory, this means that
po-tential oceans and near-surface groundwater should be perma-nently frozen in ice sheets and permafrost. Could surface lakes and rivers form? To investigate this possibility, a better crite-rion is the average temperature in summer. On the Earth, for instance, intense fluvial activity takes place in Northern Siberia in the summertime, despite annual mean surface temperatures below -15◦
C (258 K). Maps of peak summertime daily mean temperatures are shown in Figures 6c and 6d. It appears that, unlike those in Siberia, these temperatures never reach the melt-ing point of pure water in our baseline simulations. In fact, the climate predicted by our model should be, at best, analo-gous to Antarctica’s upper Dry Valleys (Marchant and Head, 2007). Water may melt, but only for a few hours during a few afternoons in summer (as on Mars today). The locations where above-freezing temperatures are predicted are shown in Figures 6e and 6f, which presents the maximum surface tem-peratures in the Ps =0.5 and 2 bar cases. Melting would be possible in many areas below 60◦
latitude. Although the mean temperatures are lower in the 0.5 bar than in the 2 bar simula-tion, the diurnal amplitude is larger and the maximum tempera-tures are not very dependent on pressure. The amount of water which can melt during such short episodes should be limited (see Wordsworth et al., 2012). One can speculate that the melt-water could create supraglacial channels below the glaciers, maintain perennially ice-covered lakes (notably by bringing en-ergy in the form of the latent heat of fusion; McKay et al. 1985), or that brines may play a major role. However, one must keep in mind that in our baseline simulations we modeled a dry, desertic planet Mars. First, we do not take into account the latent heat losses which tend to cool the surface if ice were present.
Sec-ond, surface ice could possibly have higher albedo and thermal inertia than bare ground. To assess the sensitivity of our results to surface properties and the presence of ice, we performed ad-ditional simulations with a global albedo of 0.4 (instead of the present day Mars ground albedo which is near 0.22 on average) and a global thermal inertia of 1000 J s−1/2 m−2 K−1 (instead
of 250 J s−1/2m−2 K−1assumed for dry ground). As shown in
Figure 8, annual mean temperatures are lowered by about 8 and 12 K at 0.5 and 2 bar respectively. This reflects the effect of lowering the albedo, since thermal inertia has little effect on an-nual mean temperatures. However, increasing the thermal iner-tia dampens the maximum temperatures, which are lowered by about 30 K. This suggests that extensive ice deposits would not reach 0◦C, and that, as in Antarctica upper Dry Valleys today,
only ice lying on dark rocks may sometimes melt (Marchant and Head, 2007).
5.2. Atmospheric temperatures and CO2ice clouds
Figure 9 presents cross-sections of zonal mean temperatures and zonal winds in northern summer and winter in the 2 bar baseline simulation. At this pressure, the atmospheric ther-mal structure is relatively homogeneous, with little latitudinal and seasonal variations compared to present-day Mars or even the Earth. Temperatures decrease monotonically with altitude, even near the surface, as discussed above. The small latitudinal gradients nevertheless induce a meridional circulation. Plotting the mass streamfunction (not shown) reveals that it is character-ized by Earth-like overturning Hadley cells between 30◦S and
30◦N, and which extend up to about 15 km. In a given
sea-son, the cross-equatorial cell with rising motion in the spring-summer hemisphere and descending motion in the fall-winter hemisphere dominates. The corresponding zonal wind struc-ture is characterized by an Earth-like subtropical prograde jet in the winter hemisphere. The summer hemisphere retrograde jet is much more Mars-like. In the northern hemisphere, the large longitudinal variations in topography induce a strong stationary wave which modulates the zonal wind.
In this 2-bar simulation, temperatures below the CO2
con-densation point are predicted above about 11 km, and CO2ice
clouds form at all seasons and latitudes (Figure 10). However, at any given time, CO2ice clouds typically cover about half of
the planet (when counting visible opacity above 0.2), as illus-trated in Figure 11. The locations of the clouds evolve con-stantly, with a combination of transient cloud condensed and transported by travelling waves, and stationary clouds forming above topography features (such as Tharsis, the edge of Hellas or Arabia Terra). This most likely results from resolved gravity waves. Is topography a key driver of clouds and climate? To address this question, we performed a similar simulation, but with topography removed. We found that the cloud coverage is relatively similar, with a global mean visible opacity of 6 com-pared to 4.5 with topography. The mean surface temperature is almost identical (231.5 K compared to 231.0 K).
Figures 10a and c show the annual mean section of the cloud density and cloud particles radii in our 2-bar baseline simula-tion with topography. The average particle radius is well above
Ps=0.5 bars
Ps=2 bars
a) Annual mean temperatures (K)
b) Annual mean temperatures (K)
c) Max daily mean temperatures (K)
d) Max daily mean temperatures (K)
e) Maximum temperatures (K)
f) Maximum temperatures (K)
Northern Summer
(L
s= 90
◦− 120
◦)
Northern Winter
(L
s= 270
◦− 300
◦)
a) Zonal mean temperatures (K)
b) Zonal mean temperatures (K)
c) Zonal mean zonal wind (m s
−1)
d) Zonal mean zonal wind (m s
−1)
Figure 9: Time-mean section of zonal-mean temperature (K) and zonal wind (m s−1) for two opposite seasons in our baseline simulation with mean surface pressure
2 bar (obliquity=25◦, [CCN]=105kg−1, circular orbit). The white areas represent grid points below the surface.
10 µm, the minimum size to readily scatter thermal infrared ra-diation and induce the scattering greenhouse effect (Forget and Pierrehumbert, 1997). However, with a mean optical depth near 4.5 and fractional cloud cover most of the time, the clouds only induce a 10 K greenhouse warming, as discussed above.
Because modeled clouds properties can be expected to be sensitive to model resolution, we performed an additional 2-bar simulation with doubled resolution in latitude and longi-tude. Results are compared in Figures 10, 11, and 12e and f. In the high-resolution simulation, the impact of topography and gravity waves seems to be stronger. The cloud distribution (Fig-ure 12f) exhibits more struct(Fig-ure in relation to local topography. Nevertheless, the mean cloud cover, optical depth, and particle sizes are about the same on average (average visible opacity of 4.6 vs 4.5 in the baseline simulation). The mean surface tem-perature is only 1 K warmer, which is not significant. Similarly, we explored the sensitivity to the model vertical resolution by doubling the number of layers and thus the resolution above the boundary layer (reaching a vertical resolution of about 2.5 km between 5 and 25 km), and found very similar results.
Figure 12 presents the annual mean coverage in optical depth at other pressures in the baseline cases. The average cloud vis-ible optical depth τ growths with mean pressure Ps, but at the same time the altitude of the bottom of the cloud layer z de-creases. For instance, τ=0.7 and z ≃14 km for Ps=0.5 bar;
τ=1.8 and z ≃11 km for Ps=1 bar; τ=4.5 and z ≃8 km for
Ps=2 bar; τ=9 and z ≃5 km for Ps=3 bar; and τ=16 and z ≃0 km for Ps=4 bar. As mentioned above, the scattering
greenhouse effect for low lying clouds is reduced. Above 4 bars, the clouds cool the planet rather than warming it.
5.3. Sensitivity to CO2ice cloud microphysics
5.3.1. Number of particles and particle sizes.
As explained in Section 4.3, we consider that many of the un-certainties related to the CO2ice clouds microphysics and
parti-cle sizes can be accounted for by varying the prescribed number mixing ratio of cloud condensation nuclei [CCN]. We explored the sensitivity of the model to this parameter in the Ps =0.5 and 2 bar cases by performing 7 simulations with [CCN] set to 102,
103,..., 107, 108 kg−1(see Section 4.3). The primary effect of
decreasing [CCN] is to increase the size of the cloud particles when they form. On the one hand, this enhances the sedimen-tation rate and thus decreases the mass of the cloud (and thus its opacity). On the other hand, for a given cloud mass, this af-fects the cloud opacity by changing the number of particles and their single scattering properties. We found that the first effect dominates: almost no clouds are present with [CCN]=102kg−1.
With higher [CCN], the average cloud mass increased by a fac-tor of about 3 for each order of magnitude increase in [CCN]. Meanwhile, the mean cloud particle sizes (computed by tak-ing into account sedimentation and sublimation below the con-densation level) remains near 10 to 20 µm. As a result, with
Low resolution 32 × 24
High resolution 64 × 48
a) Zonal mean CO
2ice density (10
−6kg m
−3)
b) Zonal mean CO
2ice density (10
−6kg m
−3)
c) Mean Cloud particles effective radius (µm)
d) Mean Cloud particles effective radius (µm)
Figure 10: Annual-mean section of zonal-mean CO2ice cloud density and particle radius, for two simulations with different horizontal resolution (mean surface
pressure 2 bar, obliquity=25◦
, [CCN]=105kg−1, circular orbit). Particle radii are averaged with a relative weight proportional to the CO
2ice mixing ratio.
CO
2ice clouds visible opacity, L
s= 270
◦, noon at 0
◦E
Low resolution 32 × 24
High resolution 64 × 48
Figure 11: An example of the instantaneous CO2 ice clouds coverage for two simulations with different horizontal resolution (mean surface pressure 2 bar,
obliquity=25◦
a) P s = 0.1 bar
b) P s = 0.3 bar
c) P s = 0.5 bar
d) P s = 1 bar
e) P s = 2 bar
f) P s = 2 bar (high resolution)
g) P s = 3 bar
h) P s = 4 bar
2 3 4 5 6 7 8 Log ([CCN]) (kg-1) 200 205 210 215 220 225 230 235
Global mean Surface Temperature (K)
2, bar, No supersaturation 2 bar, Supersaturation 35% 0.5 bar, No supersaturation
Obliquity = 25°
Figure 13: Global annual averaged surface temperature (K) as a function of cloud condensation nuclei number mixing ratio (kg−1) in the 2 bar mean
sur-face pressure cases (obliquity = 25◦
, circular orbit), and assuming either no supersaturation or a 35 % supersaturation to form CO2ice clouds (see text).
Ps =2 bar, the mean cloud optical depth reaches 16, 67 and
156 for [CCN]=106, 107and 108kg−1, respectively. In the last
two cases, the cloud optical depth is too thick to allow the scat-tering greenhouse effect to take place (Forget and Pierrehum-bert, 1997). The clouds are so thick in the visible that albedo increases outweigh the scattering of upwelling IR. The clouds reflect most of the incoming solar radiation, and their net effect is to cool the surface as seen in Figure 13. With Ps =0.5 bar, the mass of CO2ice clouds is lower and the cloud warming is
maximized with more nuclei, up to 107kg−1(Figure 13)
5.3.2. Supersaturation.
As mentioned in Section 2, based on the measured con-straints on the critical saturation level and the microphysical properties of the formation of carbon dioxide cloud particles (Glandorf et al., 2002), Colaprete and Toon (2003) pointed out that, since nucleation efficiency decreases when the size of the nucleating particles decreases, only the biggest particles are ef-ficiently nucleated and are able to condensate CO2. They
con-cluded that, as a result, CO2clouds on early Mars should
con-tain few, large particles with average radii greater than 500 µm. In addition, they showed that a supersaturation of nearly 35% is needed to allow for such an efficient nucleation.
While the first effect could be well mimicked by reducing [CCN] as done above, we have run another set of simulations to quantify the impact of the critical supersaturation needed to form clouds in a cloud free medium. In these simulations, the number density of CCN is prescribed as above. However, in a grid cell where no significant amount of carbon dioxide ice is present at the beginning of a timestep, CO2 is allowed to
condensate only if the saturation s = p/psat reaches a critical
value scrit = 1.35, i.e. if the temperature in the cell is below the nucleation temperature Tnuc(p) = Tc(p/scrit), where Tc(p) is the equilibrium condensation temperature for a CO2 partial
pressure p.
The average temperatures reached in these simulations are also shown in Figure 13 as a function of [CCN]. As can be seen, the need for supersaturation decreases the warming effect of CO2 clouds by a few degrees. However, this variation is
weaker than the one obtained by varying the density of CCN.
5.4. Impact of obliquity and orbital parameters
The obliquity and the eccentricity of Mars have strongly var-ied throughout its existence. As the evolution of these param-eters is strongly chaotic, it is not possible to know their values before a few million years ago (Laskar et al. 2004). Neverthe-less, Laskar et al. (2004) showed that the obliquity could have varied between less than 5◦
and up to more than 60◦
or even 70◦. In fact, the average value of the obliquity over 5 Gyr was
estimated to be 37.625◦ with a standard deviation of 13.82◦.
The average eccentricity was 0.0690, with standard deviation 0.0299. More recently, Brasser and Walsh (2011) reanalysed the stability of the martian obliquity for the Noachian era, tak-ing into account the fact that before the late heavy bombard-ment the giant planets may have been on drastically different orbits than today, according to Gomes et al. (2005). For such conditions, they found that the martian obliquity would have remained chaotic for its most probable mean values, between about 30◦and 60◦, but more stable for the less probable mean
obliquities below 30◦(with oscillation amplitude still as high as
20◦) and above 60◦(with amplitude of 9◦)
Varying the obliquity or the season of perihelion in models of the present-day Mars climate system has a profound impact on the surface temperatures and the water cycle (e.g. Haberle et al. 2003, Forget et al. 2006, Montmessin et al. 2007a). The impact is especially strong at high latitudes, with the average insolation at the pole proportional to the sine of the obliquity. The permanent polar caps predicted to form for Ps = 0.1 and
Ps = 0.3 bar in the baseline case (25◦obliquity) and discussed
in Section 5.1 do not form at 35◦ obliquity. Conversely, we
found that a southern permanent polar cap forms when running with Ps =0.5 bar and 10◦obliquity (whereas there is no such
cap in the baseline case with 25◦obliquity shown in Figure 3c).
With Ps = 2 bar, the thick atmosphere prevents the formation of permanent polar caps even in the 10◦obliquity case. In fact,
in that simulation CO2does not condense on the surface at all!
Figure 14 summarizes the range of mean surface pressures and obliquities for which permanent CO2ice caps are predicted to
form, possibly leadingto atmospheric collapse.
In general, a higher obliquity corresponds to a stronger sea-sonal cycle, with a warmer summer and a colder winter at mid and high latitudes. Could this significantly increase maximum temperatures and allow seasonal melting? Figure 15 shows the global mean, maximum daily mean and planetary maximum temperatures in the Ps = 0.5 and 2 bar cases for various obliq-uities between 10◦ and 60◦. In both cases, the global mean
temperature slightly decreases with obliquity. This is due to the raising of the albedo resulting from the seasonal polar caps
No permanent No permanent CO2ice cap Collapse in Collapse in i 0 1 0 3 0 5 1 2 3 4
CO2ice caps CO2ice caps
0.1 0.3 0.5 1 2 3 4
Figure 14: Schematic drawing illustrating the range of mean surface pressures and obliquities for which permanent CO2ice caps are predicted to form after 10
years of simulations. It is based on model runs performed combining pressure values of 0.1, 0.3, 0.5, 1, 2, 3, 4 bars and obliquities of 10◦, 25◦, 35◦ and
45◦to explore the parameters space. The sensitivity to other model parameters
is not shown. In particular, as in all simulations in this paper, the CO2 ice
albedo and emissivity were set to 0.5 and 0.85 respectively, but one can expect that the figure would be different assuming other CO2ice radiative properties.
The arrows illustrate the fact that when permanent CO2ice forms, part of the
atmosphere may collapse and cause the pressure to decrease below the initial value. 0 10 20 30 40 50 60 70 Obliquity (°) 200 220 240 260 280 300 Temperature (K)
2 bar Global mean 2 bar, max daily mean 2 bar, global max 0.5 bar, global mean 0.5 bar, max daily mean 0.5 bar, global max Surface Temperature
Figure 15: Surface temperature statistics (K) as a function of obliquity in the 0.5 and in the 2 bar mean surface pressure cases (circular orbit).
0 2 4 6 8 10 12
Dust optical depth 210
220 230 240 250
Global mean surface temperature (K)
Dust top at 100km Dust top at 30 km
Ps = 2 bar
Ps = 0.5 bar
Figure 17: Global mean surface temperature (K) as a function of dust opacity in the 0.5 and in the 2 bar mean surface pressure cases (circular orbit).
which are more and more extensive when obliquity increases. As expected, the maximum daily mean temperature strongly in-creases with obliquity, especially in the Ps = 0.5 bar case for which temperature above 0◦C are predicted at very high
obliq-uity. Looking at temperature maps (not shown), we can see that such high temperatures are reached in both hemisphere (more in the north), above about 70◦
latitude.
Insolation can be further increased near perihelion in the case of an eccentric orbit. To explore this effect, and in order to create a realistic “optimum case” we performed two additional simulations with Ps = 0.5 and 2 bar, assuming an eccentric-ity of 0.1, a perihelion during northern summer solstice, and an obliquity set to 41.8◦ (the most likely obliquity for Mars
according to Laskar et al. (2004)). The corresponding maxi-mum daily mean temperatures are shown in Figure 16. In the 0.5 bar case, seasonal temperatures above 0◦
C are predicted ev-erywhere above 70◦
latitude. If valley networks and layered deposits were mostly observed at such high latitudes, it would be interesting to relate their formation to this type of orbital configurations. Of course, this is not the case.
5.5. Impact of atmospheric dust
To explore the radiative effects of airborne mineral aerosols, we have used the dust parameterization described in Section 4.4 and performed a series of simulations with various amount of dust in the Ps = 0.5 and 2 bar cases. The impact of dust opac-ity on the global averaged surface temperature is shown in Fig-ure 17. Two vertical distributions are employed. When the“dust top” is set to 100 km, the dust mixing ratio decreases slowly
Ps=0.5 bars
Ps=2 bars
a) Max daily mean temperatures (K)
b) Max daily mean temperatures (K)
Figure 16: Maximum daily mean surface temperatures (K) obtained with simulations with a 41.8◦obliquity, eccentricity of 0.1, and Mars closest to the Sun
in Northern summer (Ls = 90◦at perihelion). This illustrates the warmest daily mean surface temperatures that can be obtained in our simulations with surface pressure of 0.5 and 2 bars.
160 180 200 220 240 260
Global mean temperature (K) 0 5 10 15 20 25 30 35 40 Altitude (km) No dust
Dust opacity = 5; top = 30 km Dust opacity = 5; top = 100km Dust opacity = 10; top = 100 km Ps = 2 bar Obliquity = 25°
Figure 18: Global average temperature profile in the 2 bar mean surface pres-sure case, and with varying dust loading and vertical distribution
in the lower 50 km (80% of the surface value at 50 km) and more steadily above, up to 100 km. Similarly, with a dust top at 30 km, most of the dust is confined below 20 km.
In most cases, it is found that dust can slightly warm the sur-face. With a dust visible opacity τ set to τ =5, surface temper-atures are increased by a couple of Kelvins in the Ps = 0.5 bar case, and by more than 10 K with Ps = 2 bar. With dust opac-ity τ =10, the impact is reduced. To interpret these results, we can note that airborne dust modifies the energy balance in four ways: 1) Dust absorbs solar radiation and thus warms the at-mosphere, 2) as a result, it decreases the CO2 ice clouds
opac-ity 3) Dust decreases the planetary albedo, 4) Dust increases the atmospheric infrared opacity. The first two effects tend to reduce the atmospheric greenhouse surface warming and thus the mean surface temperatures. However, the other two effects work in the opposite direction and actually dominate. Figure 18 illustrates the impact of dust on the temperature profiles in the
Ps = 2 bar case. Temperatures above 10 km are warmed by
15 K with an opacity τ =5 and by more than 20 K with τ =10. This should decrease the greenhouse effect by increasing the outgoing infrared radiation, but this is more than compensated by the fact that the dust infrared opacity allows the mean in-frared emission to take place at higher and colder altitude. The dominant efect is thus an increase in surface temperature to keep the energy budget in balance. This is less true with τ =10, and one can see that the surface temperature is then lower than with τ =5. In the τ =5 case, the CO2ice cloud mean opacity is
reduced from about 5 with no dust down to about 1.5 and 0.17 with the dust top at 30 and 100 km, respectively. The colder upper atmosphere temperatures and the thicker clouds explain why surface temperatures are a few kelvins warmer when the dust is confined in the lower atmosphere.
5.6. Role of water
In this paper we have assumed that Mars was mostly dry, and neglected the additional greenhouse effect of water vapor. However, even in the case of a water-covered Mars, this effect is limited because our predicted atmospheric temperatures are

![Figure 3: Zonal mean surface temperatures (contours, K) and surface CO 2 ice (kg m −2 ) as a function of solar longitude L s (degree) for various mean surface pressures Ps (obliquity=25 ◦ , [CCN]=10 5 kg −1 , circular orbit).](https://thumb-eu.123doks.com/thumbv2/123doknet/13042030.382488/9.892.95.806.202.994/figure-temperatures-contours-function-longitude-pressures-obliquity-circular.webp)
![Figure 6: Surface temperatures (K) in our baseline simulations (obliquity=25 ◦ , [CCN]=10 5 kg −1 , circular orbit) for mean surface pressure 0.5 bar and 2 bar.](https://thumb-eu.123doks.com/thumbv2/123doknet/13042030.382488/11.892.100.809.273.920/figure-surface-temperatures-baseline-simulations-obliquity-circular-pressure.webp)

![Figure 9: Time-mean section of zonal-mean temperature (K) and zonal wind (m s −1 ) for two opposite seasons in our baseline simulation with mean surface pressure 2 bar (obliquity=25 ◦ , [CCN]=10 5 kg −1 , circular orbit)](https://thumb-eu.123doks.com/thumbv2/123doknet/13042030.382488/14.892.92.808.112.573/figure-temperature-opposite-baseline-simulation-pressure-obliquity-circular.webp)
![Figure 11: An example of the instantaneous CO 2 ice clouds coverage for two simulations with different horizontal resolution (mean surface pressure 2 bar, obliquity=25 ◦ , [CCN]=10 5 kg −1 , circular orbit)](https://thumb-eu.123doks.com/thumbv2/123doknet/13042030.382488/15.892.99.804.793.1034/instantaneous-coverage-simulations-different-horizontal-resolution-pressure-obliquity.webp)
![Figure 12: Map of annual mean CO 2 ice cloud optical depth for various mean surface pressure Ps (obliquity=25 ◦ , [CCN]=10 5 kg −1 , circular orbit).](https://thumb-eu.123doks.com/thumbv2/123doknet/13042030.382488/16.892.100.803.174.1027/figure-annual-optical-various-surface-pressure-obliquity-circular.webp)

