HAL Id: hal-01598081
https://hal.archives-ouvertes.fr/hal-01598081
Submitted on 29 Sep 2017HAL is a multi-disciplinary open access archive for the deposit and dissemination of sci-entific research documents, whether they are pub-lished or not. The documents may come from teaching and research institutions in France or abroad, or from public or private research centers.
L’archive ouverte pluridisciplinaire HAL, est destinée au dépôt et à la diffusion de documents scientifiques de niveau recherche, publiés ou non, émanant des établissements d’enseignement et de recherche français ou étrangers, des laboratoires publics ou privés.
and health studies
Julie Vallée, Guillaume Le Roux, Basile Chaix, Yan Kestens, Pierre Chauvin
To cite this version:
Julie Vallée, Guillaume Le Roux, Basile Chaix, Yan Kestens, Pierre Chauvin. The ‘constant size neighbourhood trap’ in accessibility and health studies. Urban Studies, SAGE Publications, 2014, 52 (2), pp.338 - 357. �10.1177/0042098014528393�. �hal-01598081�
1
THE
“
CONSTANT SIZE NEIGHBOURHOOD TRAP”
IN ACCESSIBILITY AND HEALTH STUDIES
Julie Vallée, Guillaume Le Roux, Basile Chaix, Yan Kestens, Pierre Chauvin
Julie Vallée, CNRS, UMR Géographie-Cités, Paris, France & CHUM Research Centre (CRCHUM), Montreal, Canada &
Université de Montréal Public Health Research Institute (IRSPUM), Montreal, Canada
Guillaume Le Roux, Université de Poitiers, UMR Migrinter, Poitiers, France
Basile Chaix, INSERM, U707, Paris, France & Université Pierre et Marie Curie, UMRS 707, Paris, France
Yan Kestens, Department of Social and Preventive Medicine, Université de Montréal, Canada & CHUM Research Centre
(CRCHUM), Montreal, Canada & CHUM Research Centre (CRCHUM), Montreal, Canada
Pierre Chauvin, INSERM, U707, Paris, France & Université Pierre et Marie Curie, UMRS 707, Paris, France
A
BSTRACTIn literature on neighbourhood effects and on resources accessibility, number of neighbourhood resources to which residents may have access are often estimated from spatial units whose constant size fails to account for unique ways residents experience their neighbourhoods. To investigate this "constant size neighbourhood trap", we compared numbers of health-care resources included in Constant Size Buffers (CSBs) and in Perceived Neighbourhood Polygons (PNPs) from cognitive neighbourhood data collected among 653 residents of the Paris metropolitan area,.
We observed that residents of deprived and peripheral areas had smaller PNPs than their counterparts. Studying residents assessments of the quantity of neighbourhood practitioners, we then assessed the validity of using PNPs rather than CSBs to estimate number of neighbourhood resources. Lastly, resource inequalities across the Paris metropolitan area were found to be far wider when considering PNPs rather than CSBs.
Using constant neighbourhood delineation can lead to inaccurately measure individual accessibility to neighbourhood resources and to downplay the extent of inequalities in urban resources.
KEYWORDS
2
I
NTRODUCTIONIn recent years, there have been greater efforts to build the evidence base for the role of neighbourhood resources in health-related behaviours in order to guide interventions and reduce health inequalities. In such studies, spatial accessibility to neighbourhood resources has been alternately defined from number (or ratios) of resources, distance to nearest resources, or gravity-based accessibility measures (Guagliardo 2004). When computing numbers of neighbourhood resources, it is very common to consider spatial units of similar size (e.g. circular buffers of constant radius) or of roughly similar population size (e.g. census tracts). However, many authors have noted that associations between numbers of neighbourhood resources and individual health-related behaviours may differ according to the way neighbourhoods are delineated (Flowerdew, Manley and Sabel 2008; Apparicio et al. 2008). Such sensitive results refer not only to the zoning scheme or geographic scale of the spatial units in reference to the well-known Modifiable Areal Unit Problem (MAUP) defined by Openshaw (1984), but also to the spatial discrepancy between a uniform neighbourhood definition and the unique way people experience and perceive their neighbourhoods. This discrepancy (i.e. the extent to which spatial units used to compute neighbourhood measures deviate from the "true" neighbourhood as it is experienced) may lead to inconsistent results and inferential errors when analyzing neighbourhood effects on individual behaviours. It is connected with the Uncertain Geographic Context Problem (UGCoP), as recently defined by Kwan (2012).
To select the most relevant neighbourhood units, some sensitivity analyses have recently been conducted to find the optimal buffer radius around individuals' home that would maximize the effects between number of neighbourhood resources and health indicators (Leal et al. 2011; Spielman and Yoo 2009; Vallée and Chauvin 2012). However, it would be incorrect to consider model fit the only reliable criterion for determining the relevance of neighbourhood delineation (Vallée and Shareck In press). Moreover, it may be too simplistic to use one single neighbourhood delineation for every neighbourhood within a large metropolitan area. Measuring the number of neighbourhood resources requires choosing adequate spatial units which can differ widely, depending on the profile and location of people in the city (Bissonnette et al. 2012). As noted by Paez et al. (2010), accessibility measures frequently assume a fixed distance threshold and therefore provide measures that depend exclusively on the spatial distribution of resources, but are insensitive to location and personal factors.
When measuring spatial accessibility to neighbourhood resources and more largely when investigating neighbourhood effects, it would be useful to define neighbourhood boundaries corresponding to the “true” neighbourhood as it is experienced and to use adaptive areas that fit people’s neighbourhood experiences. The question of neighbourhood definition based on people’s place experiences has a rich history in neighbourhood and community studies, especially in the U.S. literature. Several studies have shown that people have unique neighbourhood experiences and locate their residential neighbourhood boundaries differently, even when living in close proximity (Coulton et al. 2001; Lee and Campbell 1997; Sastry, Pebley and Zonta 2002; Orford and Leigh 2013).
The principal objective of this paper is to highlight the “constant size neighbourhood trap,” i.e. the bias that occurs when neighbourhoods are operationalized as spatial units of constant size. To empirically investigate this bias, we propose to compare the actual number of resources included in areas of constant size with those included in areas that coincide with inhabitants’ perceived neighbourhoods.
Since the “local trap” and the “residential trap” were noted by Cummins (2007) and Chaix (2009), there has been growing recognition of the need to integrate non-residential areas to truly define individual place-exposure (Inagami, Cohen and Finch 2007; Zenk et al. 2011; Vallée et al. 2010; Vallée et al. 2011; Kestens et al. 2012; Perchoux et al. 2013; Rainham et al. 2010; Vallée and Chauvin 2012). By introducing the “constant size neighbourhood trap” here, our aim is to pinpoint the importance of also accounting for variability in ways people experience and perceive their neighbourhood of residence to sufficiently evaluate resource accessibility in
residential areas (Cf. horizontal axis in Figure 1). Residential area does indeed remain one essential anchor space
in personal daily organization, notably for people with limited daily mobility (such as the elderly) and/or for activities requiring proximity to home (such as doctors’ visits and purchase of drugs for those who are sick and confined to bed, or last-minute grocery shopping). In our view, the “local trap” and the “constant size neighbourhood trap” refer to two distinct traps when we seek to define the “true” context in which people may access to health-related resources.
3
Figure 1. Crossing residential and non-residential areas to measure individual accessibility level to resources
In this research field, major innovations have come from time-geography, where individual “potential path areas” have been developed to stress the fact that potential accessibility to resources should reflect individual space and time constraints (Hägerstrand 1970). In this way, some authors strongly recommend the use of people-based accessibility measures rather than place-people-based accessibility measures alone (Kwan 2009; Miller 2007) because accessibility to resources is at least as much about people as it is about places (Farrington 2007). Following this people-based paradigm, some authors have suggested including individual cognitive filters, which may have an impact on how people know about and use local resources (Banos et al. 2005). Therefore, considering people’s neighbourhood experiences to study resource accessibility also draws upon behavioural geography, which makes it clear, frequently through the use of cognitive mapping procedures, how distances experienced by people are not the same as distances on the map (Golledge and Stimson 1997; Lynch 1960; Couclelis 1992).
In this paper we propose to empirically investigate how neglecting variability in inhabitants’ perceived neighbourhoods may bias measures of health resource inequalities in the Paris metropolitan area and lead to a “constant size neighbourhood trap”. Our empirical analysis is based on survey data collected among 653 respondents of the SIRS cohort survey and localization data on health-care resources. As a preliminary step, we explore the spatial variability in size of residents’ Perceived Neighbourhood Polygons (PNPs). In a second step, we aim to assess the validity of using perceived neighbourhood delineation to estimate the actual number of health resources to which residents have access in their neighbourhood. For that, we compare the strength of the correlation between the number of general practitioners either included in residents’ Perceived Neighbourhood Polygons (PNPs) or in Constant Size Buffers (CSBs), and respondents’ assessments of the quantity of neighbourhood practitioners. We hypothesize that respondents’ assessments are actually more closely associated with the number of practitioners in PNPs than in CSBs. In a last step, we investigate the effects of "the constant size neighbourhood trap" on measures of health resource inequalities based. When focusing on inequalities in the quantity of neighbourhood resources to which residents have access, the emphasis has often been placed on level of social deprivation (Pearce et al. 2007; Macintyre, Macdonald and Ellaway 2008; Gordon et al. 2011) and urban spatial structures, which is connected to Christaller’s central place theory (Kearns and Moon 2002). In this paper, we hypothesize that the number of neighbourhood health resources is lower in deprived and peripheral areas than in affluent and central populated areas and that the extent of these inequalities are wider when considering PNPs rather than CSBs. To summarize, this paper will (1) explore spatial variability in PNP size according to social population profile and population size, (2) assess the validity of using perceived neighbourhood delineation to estimate number of neighbourhood health resources, and (3) investigate the effects of "constant size neighbourhood trap" on measures of neighbourhood resources inequalities. Following this three-step approach, this paper aims to show how neglecting the constant size neighbourhood trap can lead to inaccurate interpretations of individual accessibility to neighbourhood resources and minimizing gaps between over- and underserved areas.
4
D
ATA1. Respondent's perceived neighbourhoods
SIRS survey
The SIRS (a French acronym for health, inequalities and social ruptures) cohort study is a social and epidemiological longitudinal survey carried out in the Paris metropolitan area in 2005 and 2010 among a representative sample of the adult French-speaking population (Chauvin and Parizot 2009; Chauvin, Parizot and Vallée 2013). Here, the Paris metropolitan area is defined as the Paris department and the three surrounding departments (Hauts-de-Seine, Seine-Saint-Denis and Val-de-Marne).
The SIRS cohort employed a stratified, multistage cluster sampling procedure. The primary sampling units were census tracts called “IRISs” (“IRIS” is a French acronym for blocks that incorporate statistical information). To date, the 2,595 residential census tracts in the Paris metropolitan area have a mean population of 2,500 inhabitants. Census tracts were divided into three groups according to population occupational and employment status (Préteceille, 2003). In every three groups, census tracts were randomly selected to get a final sample of 50 census tracts with an overrepresentation of more deprived census tracts (Préteceille 2003). The mean area of these 50 census tracts was 31 ha, ranging from 4 ha in one census tract located in inner-city Paris to 180 ha in one census tract located in the peripheral municipality of Villeneuve-St-Georges. Then, 60 households were randomly chosen from a complete list of households in each selected census tract, and one adult was randomly selected from each household, using the next- birthday method (i.e., selecting the adult in the household who has the next birthday). In 2010, people who could not be re-interviewed were randomly replaced by other residents of the same census tract. The refusal rate was 29% in both 2010 and 2005. In 2010, the sample included 3,006 adults. A questionnaire containing a large number of social and health-related questions was administered face-to-face during home visits.
Creation of Perceived Neighbourhood Polygons (PNPs)
In 2010, respondents were asked to name streets or places delineating their neighbourhood. From these data, we developed a GIS algorithm to build polygonal areas, defined here as Perceived Neighbourhood Polygons (PNPs). We decided to restrict the sample to respondents who reported streets only (1,203 respondents, i.e. 40% of the total sample). Heterogeneous limits would indeed have required GIS algorithm rules to build polygonal areas that were only slightly comparable. Using only street names to generate PNPs lead us to exclude respondents who had reported some points, such as a metro station or a monument, or polygonal places, such as a park (687 respondents reported only punctual or polygonal places and 1,116 reported punctual or polygonal places in addition to streets).
Of those who reported street limits only, 1,105 respondents who had mentioned two streets or more were kept. A road geodatabase from the National Geographic Institute (IGN) was used to localize streets. This first step excluded 60 respondents for whom one of the mentioned streets was absent from the geodatabase. Then we developed an algorithm in VBA language to give each respondent his/her own PNP by connecting every mentioned street. In the case of non-intersecting streets, we extended streets by one kilometre. If the extended street crossed another mentioned street (or its extension), the extended street was kept for the final polygon (Figure 2, polygon 1, a). Otherwise, extensions were removed and non-intersecting streets were connected by the shortest path “as the crow flies” (Figure 2, polygon 1, b). In the case of intersecting streets, we kept the segment that had the most intersections with other mentioned streets (Figure 2, polygon 2, c). If some segments of the same street were found to have an equal number of intersections, we kept the street segment closest to the respondent’s place of residence (Figure 2, polygon 2, d). Lastly, we excluded PNPs that were highly fragmented (with a ratio between the perimeter of the largest ring and the total circumference superior to 50%) or PNPs where the place of residence was far beyond the polygon limits (>500 meters). The final studied sample consisted of 653 PNPs.
5
Figure 2. Various ways to construct Perceived Neighbourhood Polygons (PNPs) based on spatial configuration of streets mentioned by respondents
2. Quantity of neighbourhood resources
Focusing on primary health-care resources, the numbers of neighbourhood health resources were obtained from two different datasets: (i) the current location of health-care resources (objective measure); and (ii) respondents’ assessments in the SIRS survey of the quantity of neighbourhood practitioners (self-reported measure).
Objective measure of current number of health resources
According to the French organization for primary health care, we selected three types of health-care resources for the purpose of our study: general practitioners, pharmacies and dentists. Their locations were obtained from the Institute of Development and Urban Planning of the Paris Region (IAURIF) GIS, which uses data from the Regional Union of Health Insurance Funds (URCAM), collected in 2006 (for pharmacies) and 2009 (for general practitioners and dentists). We computed the number of each resource in PNPs and in Constant Size Buffers (CSBs). CSBs were defined as circular buffers with a constant size radius corresponding to the mean size of the 653 PNPs (i.e. with a 367 meter radius, see results section) centred on places of residence. Figure 3 illustrates the procedure with two participants residing in two contrasting urban settings.
Figure 3. Use of Perceived Neighbourhood Polygons (PNPs) and Constant Size Buffers (CSBs) to compute number of general practitioners per two residents in Paris metropolitan area
Self-reported measure of number of practitioners
SIRS respondents were asked about their assessment of the quantity of practitioners in their neighbourhood, using the following question: “Do you agree that the number of neighbourhood practitioners is sufficient?” on a four-point response scale (strongly agree; somewhat agree; somewhat disagree; strongly disagree).
6
3. Area characteristics
As is often done in health resource accessibility literature, we decided to study inequalities in the number of health-care resources based on social area deprivation and urban spatial structure. These two area characteristics were then used to study spatial variability in PNP size and then to compare inequalities in the number of health-care resources when using PNPs or CSBs.
Area social deprivation has been observed at the census tract level and measured in terms of median annual household income per consumer unit. Data were obtained from the 2007 income tax database (available from the French Department of National Revenue), ranging from 6,120 to 42,870 € and dichotomized as the upper income tertile (identified as “affluent areas”) versus other tertiles (“more deprived areas”). This means that 15 and 35 of the census tracts and 246 and 407 of the respondents in the study belong to affluent and more deprived areas, respectively.
To define the urban spatial structure in the Paris metropolitan area, we compared municipality population sizes from 2008 census data. Three groups of municipalities were defined: the Paris municipality, with a population of 2.2 million inhabitants, was on the top of the hierarchy (including 13 surveyed census tracts and 196 respondents). Some 31 peripheral municipalities (including 17 surveyed census tracts and 157 respondents) with a population of 50,000 to 200,000 inhabitants were classified as “large municipalities.” Finally, 92 peripheral municipalities (including 20 surveyed census tracts and 300 respondents) with a population of fewer than 50,000 inhabitants were considered to be “small municipalities.”
S
TATISTICAL METHODS1. Explore spatial variability in PNP size
Differences in the size of PNPs based on census tract population income and municipality population size were assessed using univariate analysis (ANOVA test) and multilevel linear regression models (using the ‘‘xtmixed’’ command in Stata10 software). The crude between-area variance was computed in a null model to observe whether some spatial variability in PNP size existed between the 50 surveyed census tracts. By adding census tract population income and municipality population size to the model, we then evaluated changes in the between-area variance. The Intraclass Correlation Coefficient (ICC), corresponding to the percentage variance of PNP size at census tract level, was computed in every model.
2. Assess the validity of using perceived neighbourhood delineation to estimate number of neighbourhood health resources
We computed the T-Test with paired data to test differences between health resource numbers in PNPs and CSBs. A non-parametric Spearman’s rank correlation test was used to compare the strength of the correlation between the number of general practitioners in either the PNP or the CSB, and respondents’ assessments of the quantity of neighbourhood practitioners.
3. Investigate the "constant size neighbourhood trap" in measures of resources inequalities
Inequalities in the quantity of neighbourhood resources in relation to census tract population income and municipality population size were compared, based on the way neighbourhoods were delineated (PNP or CSB). The extent of the inequalities was assessed using the following aggregate dispersion measures: (1) ratio between extreme values; and (2) variation coefficient, expressing standard deviation as a percentage of the sample mean. Both measures are dimensionless and allow for comparison between datasets with widely different means.
F
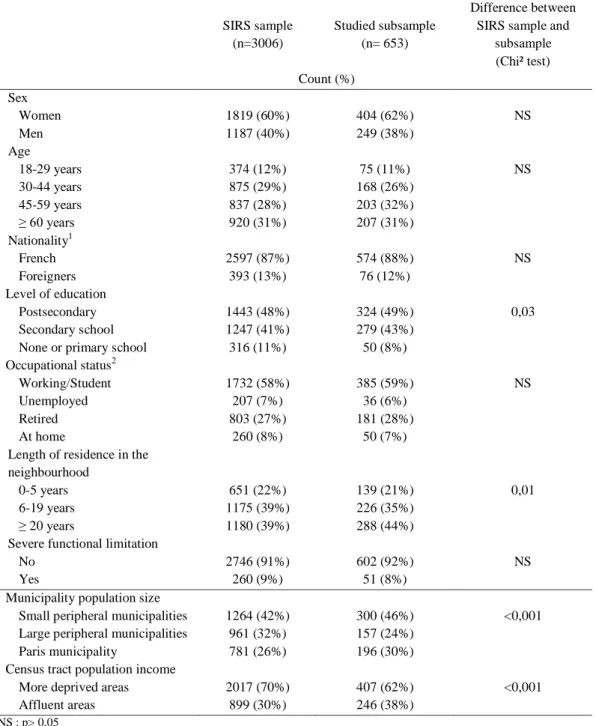
INDINGSThe studied subsample consisted of 653 respondents with a mean of 13.1 per census tracts (range: 1 to 38). Their mean age was 51 years. Respondents were predominantly female (62%), French (88%), with a postsecondary education (49%) and working or studying (59%). More than 40% lived in their neighbourhood for more than 20 years and 8% reported a severe limitation in performing activities (Table 1). No significant differences between
7
the studied subsample and the total SIRS sample of 3,006 were observed in terms of age, sex, nationality, current occupational status or functional limitation. However, we noticed that residents with a low level of education, who moved more recently in the neighbourhood, who lived in large peripheral municipalities or in low income census tracts were underrepresented in our subsample (Table 1).
Table 1. Descriptive summary of respondents' characteristics SIRS sample
(n=3006)
Studied subsample (n= 653)
Difference between SIRS sample and
subsample (Chi² test) Count (%) Sex Women 1819 (60%) 404 (62%) NS Men 1187 (40%) 249 (38%) Age 18-29 years 374 (12%) 75 (11%) NS 30-44 years 875 (29%) 168 (26%) 45-59 years 837 (28%) 203 (32%) ≥ 60 years 920 (31%) 207 (31%) Nationality1 French 2597 (87%) 574 (88%) NS Foreigners 393 (13%) 76 (12%) Level of education Postsecondary 1443 (48%) 324 (49%) 0,03 Secondary school 1247 (41%) 279 (43%)
None or primary school 316 (11%) 50 (8%) Occupational status2
Working/Student 1732 (58%) 385 (59%) NS Unemployed 207 (7%) 36 (6%)
Retired 803 (27%) 181 (28%) At home 260 (8%) 50 (7%) Length of residence in the
neighbourhood
0-5 years 651 (22%) 139 (21%) 0,01 6-19 years 1175 (39%) 226 (35%)
≥ 20 years 1180 (39%) 288 (44%) Severe functional limitation
No 2746 (91%) 602 (92%) NS
Yes 260 (9%) 51 (8%)
Municipality population size
Small peripheral municipalities 1264 (42%) 300 (46%) <0,001 Large peripheral municipalities 961 (32%) 157 (24%)
Paris municipality 781 (26%) 196 (30%) Census tract population income
More deprived areas 2017 (70%) 407 (62%) <0,001 Affluent areas 899 (30%) 246 (38%)
NS : p> 0,05
1
With 16 missing data; 2 With 4 missing data
1. Spatial variability in PNP size
The mean size of the 653 PNPs was 42 ha, corresponding to a circle of 367 meters radius if assuming circular shape. PNPs were significantly larger in affluent areas than in more deprived areas (61.1 versus 30.8 ha). In Paris, municipality PNPs were nearly twice as large as in large municipalities (74.5 ha versus 41.9 ha) and more than three times as large as in small peripheral municipalities (21.3 ha). Crossing census tract population income and municipality population size yielded a mean PNP size of 92.9 ha in the affluent areas of the Paris
8
municipality and a mean PNP size of 16.5 ha in the more deprived areas of the small peripheral municipalities, to mention only the extreme values (Table 2).
Table 2. Variability in size of Perceived Neighbourhood Polygons (PNPs) based on urban and social area characteristics, as determined from univariate analysis
Variables N Mean area (ha) ANOVA test Radius of corresponding buffer (m) Municipality population size
Small peripheral municipalities 300 21.3 260 Large peripheral municipalities 157 41.9 365 Paris municipality 196 74.5 <0.001 487 Census tract population income
More deprived areas 407 30.8 313
Affluent areas 246 61.1 <0.001 455 Municipality population size x Census tract population income
Small peripheral municipalities More deprived areas 184 16.5 229 Affluent areas 116 28.9 303 Large peripheral municipalities More deprived areas 132 35.3 335 Affluent areas 25 76.5 494 Paris municipality More deprived areas 91 53.2 411 Affluent areas 105 92.9 <0.001 544
Source: SIRS Cohort 2010 (INSERM/CNRS); Population census (2008); Income tax database (2007)
When computing the mean size of PNPs in each of the 50 surveyed census tracts, we noticed that the extreme mean area values ranged from 6 ha in Bonneuil-sur-Marne to 121 ha in the 14th arrondissement of Paris (mean sizes respectively computed from 31 and 21 SIRS respondents). PNPs were on average larger than census tracts in 27 of the 50 surveyed census tracts (Figure 4). In these 27 census tracts (mainly located in the Paris municipality), the mean difference was equal to 41 ha (ranging from 1.5 ha to 132 ha), while in the 23 census tracts where PNP size was on average smaller than census tract size, the mean difference was equal to 29 ha (ranging from 0.2 ha to 161 ha).
Figure 4. Spatial variability of size of Perceived Neighbourhood Polygons (PNPs) in 50 surveyed census tracts in Paris metropolitan area
9
When studying variance components of PNP size in multilevel linear regression models, we observed a strong and significant variability between the 50 surveyed census tracts, with a between-area variance representing 25.7% of the total sample variation in the initial model (cf. ICC value in Model null, Table 3). This result means that there was a relatively high agreement in PNP size among residents living in the same census tract and a significant difference in PNP size among residents living in different census tracts. When census tract population income and municipality population size were accounted for, between-area variance radically decreased to 8.4% of the total sample variation (cf. ICC in Model 3, Table 3). Census tract population income and municipality population size explained 73.3% of the initial between-area variance (cf. the proportion reduction in initial variance in Model 3, Table 3).
Table 3. Variability in size of Perceived Neighbourhood Polygons (PNP) based on urban and social area characteristics, as determined from multilevel linear regression models
Model Null Model 1 Model 2 Model 3 Coef. (Std. Err.)
Intercept 41.0 (4.7)** 31.1 (5.2)** 20.5 (5.5)** 12.3 (5.1)* Census tract population income
More deprived areas - Ref. - Ref.
Affluent areas - 31.7 (9.2)** - 26.2 (6.7)** Municipality population size
Small peripheral municipalities - - Ref. Ref Large peripheral municipalities - - 20.5 (8.7)** 24.3 (7.5)** Paris municipality - - 52.5 (8.7)** 48.0 (7.4)**
VARIANCE COMPONENTS:
Between respondents: Var (rij) 2463 2463 2464 2473
Between census tracts: Var(u0j) 852 647 396 228
Proportion reduction in initial variance Var(u0j)
1
- 31.7% 53.6% 73.3%
Intraclass Correlation Coefficient (ICC)2 25.7% 20.8% 13.8% 8.4%
OVERALL:
Log restricted-likelihood -3512 -3503 -3493 -3483
** p <0.001; * p <0.05
1
[Initial Var(u0j) – Actual Var(u0j)] / Initial Var(u0j). This corresponds to the percentage of initial variance in PNP size at census tract level,
which is accounted for in the model.
2
ICC=Var(u0j)/ [Var (u0j)+ Var(rij)]. This corresponds to the percentage of variance in PNP size at census tract level
Source: SIRS Cohort 2010 (INSERM/CNRS)
2. The validity of using perceived neighbourhood delineation to estimate number of neighbourhood health resources
The mean number of neighbourhood health-care resources (general practitioners, pharmacies and dentists) was significantly larger when using PNPs rather than CSBs: 11.1 vs. 7.0 for general practitioners, 4.8 vs. 3.2 for pharmacies, and 7.7 vs. 3.7 for dentists (Table 4).
Table 4. Number of health resources in Perceived Neighbourhood Polygons (PNPs) and Constant Size Buffers (CSBs) in selected sample (n=653)
Mean Number (Standard deviation)
Difference (T Test with paired data) General practitioners in PNP 11.1 (23.7) General practitioners in CSB1 7.0 (12.0) p <0.001 Pharmacies in PNP 4.8 (9.0) Pharmacies in CSB1 3.2 (3.3) p <0.001 Dentists in PNP 7.7 (15.9) Dentists in CSB1 3.7 (4.2) p <0.001 1
Buffer around place of residence with constant radius of 367m Source: SIRS Cohort 2010 (INSERM/CNRS)
10
Numbers of general practitioners, pharmacies and dentists were found to systematically co-vary. Correlation coefficients were stronger in PNPs (with correlation coefficients ranged from 0.873 to 0.914) than in CSBs (with correlation coefficients ranged from 0.447 to 0.746).
When studying respondents’ agreement with the “number of practitioners in the neighbourhood being sufficient,” 225 strongly agreed (34%), 241 somewhat agreed (38%), 60 somewhat disagreed (9%), 68 strongly disagreed (10%), and 53 did not answer (8%). A significant decrease in mean numbers of general practitioners according to these four assessment categories was observed, whatever the “neighbourhood” delineation. It ranged from 15.6 to 3.7 (with intermediate mean values of 9.4 and 6.8) with PNPs and from 8.7 to 4.5 (with intermediate mean values of 6.7 and 4.9) with CSBs. Negative correlations between respondents’ assessments and the current number of general practitioners were actually stronger when using PNPs rather than CSBs, since correlation coefficients were equal to -0.321 and -0.265 respectively (Table 5). To date, similar correlation values have also been observed when CSBs were constructed from other radii. Instead of using a radius corresponding to the mean PNP size of the entire sample (i.e. 367 meters), we also computed CSBs from a radius of 150 meters (corresponding to the first quartile value of PNP size) and we noticed that the correlation between respondents’ assessments and the number of health resources in CSBs was equal to -0.259. When CSBs were computed from a radius of 414 meters (corresponding to the third quartile value of PNP size), the correlation between respondents’ assessments and the number of health resources in CSBs was equal to -0.269 (Table 5). Regardless of the radius selected to construct CSBs, respondents’ assessments were more closely associated with the actual number of practitioners in PNPs than in CSBs.
Table 5. Correlation between respondents’ assessment of quantity of practitioners in neighbourhood and number of health resources in Perceived Neighbourhood Polygons (PNPs) and Constant Size Buffers (CSBs)
Do you agree that the number of neighbourhood practitioners is sufficient? (n=600)4 Spearman’s rank order correlation Strongly agree (n=225) Somewhat agree (n=247) Somewhat disagree (n=60) Strongly disagree (n=68) rho p Mean number of general practitioners …
... in PNP 15.6 9.4 6.8 3.7 -0.321 <0.001 ... in CSB1 8.7 6.7 4.9 4.5 -0.265 <0.001 ... in smaller CSB2 1.5 1.0 0.8 0.4 -0.259 <0.001 ... in larger CSB3 10.5 8.1 7.0 5.2 -0.269 <0.001
1
Buffer around place of residence with constant radius of 367m
2
Buffer around place of residence with constant radius of 150m
3
Buffer around place of residence with constant radius of 414m
4
Excluding the 53 missing data
Source: SIRS Cohort 2010 (INSERM/CNRS)
3. The constant size neighbourhood trap in measures of resources inequalities
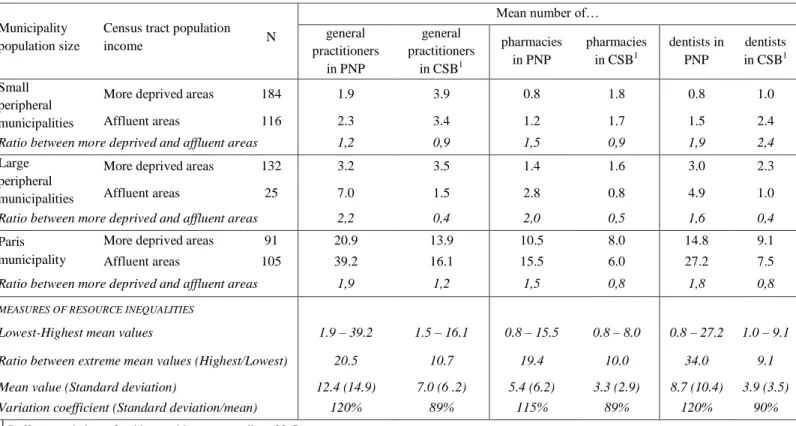
Observing aggregate measures of resource inequalities based on area social deprivation and municipality population size, the ratio difference between the less and more underserved areas was found to be nearly 10 for the three health resources when using CSBs (10.7, 10.0 and 9.1 for general practitioners, pharmacies and dentists respectively). Variation coefficients also indicated strong inequalities within the Paris metropolitan area, since variation coefficients were found to be close to 90% for the three health resources. However, the extent of these inequalities was markedly stronger when using PNPs. In this case, the ratio difference between the two extreme areas was nearly 20 for general practitioners and pharmacies and 34 for dentists, and variation coefficient values were close to 120% for the three health resources. Spatial inequalities in neighbourhood health resource volumes were notably wider within the Paris metropolitan area when using PNPs rather than CSBs.
When comparing the number of neighbourhood resources between the affluent areas and the more deprived areas of municipalities with similar population sizes (Table 6), we observed that using CSBs led us to consider that more deprived areas were very often better supplied with resources than the affluent areas (cf. ratio difference
11
values less than 1 in seven out of nine cases). However, using PNPs led to the opposite conclusion, since affluent areas were found in this case to be better supplied with local health resources than more deprived areas (cf. ratio values more than 1 in each of the nine cases). Therefore, the way “neighbourhood” is delineated seems to affect the direction and extent of inequalities in the quantity of neighbourhood health resources between more and less deprived areas.
Table 6. Spatial inequalities in mean number of neighbourhood health resources when using Perceived Neighbourhood Polygons (PNPs) instead of Constant Size Buffers (CSBs)
Municipality population size
Census tract population
income N
Mean number of… general practitioners in PNP general practitioners in CSB1 pharmacies in PNP pharmacies in CSB1 dentists in PNP dentists in CSB1 Small peripheral municipalities
More deprived areas 184 1.9 3.9 0.8 1.8 0.8 1.0 Affluent areas 116 2.3 3.4 1.2 1.7 1.5 2.4
Ratio between more deprived and affluent areas 1,2 0,9 1,5 0,9 1,9 2,4
Large peripheral municipalities
More deprived areas 132 3.2 3.5 1.4 1.6 3.0 2.3 Affluent areas 25 7.0 1.5 2.8 0.8 4.9 1.0
Ratio between more deprived and affluent areas 2,2 0,4 2,0 0,5 1,6 0,4
Paris municipality
More deprived areas 91 20.9 13.9 10.5 8.0 14.8 9.1 Affluent areas 105 39.2 16.1 15.5 6.0 27.2 7.5
Ratio between more deprived and affluent areas 1,9 1,2 1,5 0,8 1,8 0,8
MEASURES OF RESOURCE INEQUALITIES
Lowest-Highest mean values 1.9 – 39.2 1.5 – 16.1 0.8 – 15.5 0.8 – 8.0 0.8 – 27.2 1.0 – 9.1
Ratio between extreme mean values (Highest/Lowest) 20.5 10.7 19.4 10.0 34.0 9.1
Mean value (Standard deviation) 12.4 (14.9) 7.0 (6 .2) 5.4 (6.2) 3.3 (2.9) 8.7 (10.4) 3.9 (3.5)
Variation coefficient (Standard deviation/mean) 120% 89% 115% 89% 120% 90%
1
Buffer around place of residence with constant radius of 367m Source: SIRS Cohort 2010 (INSERM/CNRS)
D
ISCUSSIONSummary of findings
This paper provides evidence of a high spatial variability in the size of individual perceived neighbourhoods. While the mean PNP size was found to be 42 ha in the Paris metropolitan area - corresponding to a 367-meter radius, which was under the commonly used threshold radius value of 500 meters or 0.5 miles (i.e. 805 meters) around the place of residence, we showed that PNPs were significantly larger in affluent areas than in more deprived areas. Similar relationships between area social deprivation and size of perceived neighbourhood have been observed in Los Angeles where residents in tracts with a higher level of poverty were significantly more likely to report smaller neighbourhood size (Sastry, Pebley and Zonta 2002). We also observed that the size of perceived neighbourhoods gets smaller with the size of municipalities. Interestingly, PNPs were nearly four times larger in the Paris municipality than in small peripheral municipalities. This spatial variability may be linked with the higher density of housing and services and higher street connectivity in urban areas, which make areas more walkable and may help urban residents to experience and perceive the neighbourhoods of residence as a larger area. Differences in perceptions of neighbourhood size between urban and suburban residents has rarely been noted in European literature. In the U.S. literature, suburban residents of the mid-sized city of Green Bay, Wisconsin, were found to draw neighbourhoods that were eight times larger than those drawn by inner-city residents (Haney and Knowles 1978), while in Los Angeles, perceived neighbourhood size was not found to be related to location within the city (Sastry, Pebley and Zonta 2002). The larger size of perceived neighbourhoods in inner-city Paris compared to peripheral municipalities could be seen as an argument for using road network
12
buffers rather than circular buffers, since road network buffers specifically tend to be larger in urban than in peripheral areas (Oliver, Schuurman and Hall 2007).
We also observed a relatively strong agreement on PNP size among SIRS residents living in the same census tracts, since between-area variance was found to represent 25.7% of the total sample variation in the initial multilevel linear regression model. This means that people living in close proximity perceive their neighbourhood as an area with a relatively similar size. It would thus make sense to create spatial units of similar sizes for residents of the same census blocks, even if these adaptive spatial units cannot account for full individual variability in PNP size. As shown by analyses of variance components in multilevel linear regression models, 73% of variability in PNP size between census tracts could be modelled in the Paris metropolitan area by using only two spatial characteristics: census tract population income and municipality population size. In future research in the Paris metropolitan area, it could be useful to account for these two factors to create adaptive neighbourhoods and estimate the number of resources included.
As a consequence of the high spatial variability in PNP size, this paper points to the relative inaccuracy of using spatial units of constant size to estimate the actual number of health-care resources in neighbourhoods. We observed significant differences between the number of health resources included in PNPs and CSBs. These differences assumed full significance when they were connected with respondents’ assessment of the quantity of neighbourhood practitioners. Respondents’ assessments did have a closer correlation with the number of health resources in PNPs than those in CSBs. These observations held true regardless of the radius selected to construct CSBs, either with a radius corresponding to the mean PNP size of the entire sample (i.e. 367 meters) or with a smaller or larger radius corresponding to the first and third quartile values of PNP size (i.e. 150 or 414 meters, respectively). Actually it was not surprising - but it needed to be shown - that respondent's resources assessments correlated more strongly with number of resources in PNPs than in CSBs. . Combined with observed significant differences between the number of resources included in PNPs and CSBs, this finding justify the effort to consider perceived neighbourhoods in accessibility and health studies.
The present analysis also puts into perspective the relevance of using spatial units of roughly similar population size, such as census tract units, when we seek to define the “true” residential neighbourhood where people may access resources. We did indeed observe a strong discrepancy between the mean size of PNPs in each of the 50 surveyed census tracts and the census tract size. Depending on the location within the metropolitan Paris area, mean PNPs were found to be either larger (mainly in the city of Paris) or smaller than census tract size. This spatial discrepancy points to the usefulness of considering different administrative delineations in accessibility studies carried out in the Paris metropolitan area. It could then be relevant to group adjacent census tracts in inner-city Paris and subdivide census tracts in peripheral areas.
Another major finding was related to differences in the number of health-care resources based on area social deprivation and municipality population size. Interestingly, we observed that more deprived areas were better supplied in terms of resources than affluent areas when using CSBs. As noted by Pearce (2007), a deprivation gradient in local health resource accessibility is often assumed, while no clear evidence appears when comparing resource density values between less and more deprived areas. However, resource gradients reversed when using PNPs: populations of deprived areas were found to have access to a radically lower number of neighbourhood health-care resources than the population of more affluent areas when using PNPs. To see whether neighbourhood health resources are equitably accessible according to area social deprivation, we urge researchers to account for variability in perceived neighbourhoods. Neglecting that variability would indeed lead to an inaccurate estimate of the extent of inequalities between over- and underserved areas.
From a more theoretical point of view, these empirical findings lead us to re-examine inequalities in resource accessibility as resulting from overlapping spatial distribution of resources (a first source of inequality) and inhabitants’ neighbourhood experiences (a second source of inequality). Spatial injustice in access to urban resources needs to consider people’s capabilities to experience the neighbourhoods of residence in order to consider residential resource accessibility as a hybrid notion combining both place characteristics and people’s experiences. While neighbourhood effects literature often tends to view individual and neighbourhood characteristics as two independent dimensions, we have noted how these two dimensions should be combined from a relational place-people based approach (Cummins et al. 2007).
13
Limitations
As stated in our introduction, we have focused here only on residential areas to estimate accessibility measures to health-care resources. Although place of residence is one essential anchor point that imposes its own set of spatial and temporal constraints in personal daily organization, residential scale is - at least for mobile populations - just one piece of the puzzle. Further research is needed to combine accessibility at the residential level with accessibility at the non-residential level in order to propose a single complete estimate of geographical accessibility to resources that could account for variability in people's residential and non-residential area experiences.
We have focused our empirical study on primary health-care resources. It would definitely be useful to extend the analysis to all urban resources (such as shops, public services, green spaces) whose accessibility is often measured without reflecting the way people experience and perceive their neighbourhoods of residence.
Another point of discussion concerns the elastic delineation of perceived neighbourhoods for the same individual (Coulton et al. 2001). Individual neighbourhood delineations may vary when people consider their neighbourhood as a social space with social interactions or as an opportunity space where they perform their domestic daily activities, to take just two examples. In the SIRS questionnaire, respondents were asked to delineate their perceived neighbourhood after being interviewed about neighbourhood attachment, neighbourhood social interactions, neighbourhood daily activities and assessments of the quantity of neighbourhood resources. These questions were always asked in the same order for every SIRS respondent, so that everyone who was interviewed was referring to a similar neighbourhood definition.
The cognitive neighbourhood mapping procedure enabled us to observe quantitatively neighbourhood experiences from the perspective of the inhabitants (Lupton 2003). However, this challenging approach can be debatable. We have indeed chosen to focus on inhabitants’ spatial cognition. Recent research has paid attention to activity locations, notably from household travel surveys or GPS data. Such an approach requires making sensitive choices to rule out intervening spaces (i.e. corridors and areas where people only pass through) and to turn the initial plot of activity locations into a network of areas as actually experienced. From our point of view, inhabitants’ spatial cognition and spatial practices would yet certainly benefit from being more often combined in future research on inhabitants’ neighbourhood experiences. Actually, inhabitants’ spatial cognition and spatial practices are closely and dynamically linked, since people’s travels - particularly when they are frequently repeated – shape spatial cognition, which in turn affects their travels (Golledge and Stimson 1997). It could be then helpful to complement our quantitative cognitive neighbourhood data with qualitative information about people’s neighbourhood cognition and experiences. Qualitative approach could be also interesting to capture people's assessment of the quantity of practitioners in their neighbourhood (Hawthorne and Kwan 2013).
Some criteria that have guided the construction of PNPs should also be discussed: (1) When asked to delineate their perceived neighbourhood, reporting the names of boundaries, some inhabitants may have also problems due to their lack of awareness of place names. We observed that inhabitants who had recently arrived in the neighbourhood encountered more problems with knowing and naming place names in their surroundings, and more of them mentioned inconsistent neighbourhood boundaries (such as three parallel streets). Consequently, recent inhabitants were more likely to be excluded from the PNP subsample. (2) Using only street names to generate PNPs lead us to exclude 60% of the SIRS respondents. Even if no significant differences between the selected subsample and the total SIRS sample of 3,006 were observed in terms of age, sex, nationality, current occupational status or functional limitation, it would be interesting to consider people who had reported some points or polygonal places to delineate their neighbourhood in future analysis. (3) Further, the GIS algorithm used to create PNPs from the streets respondents mentioned did not require their place of residence to be located inside the polygons. We postulated that some inhabitants may deliberately exclude the location of their home from their perceived residential neighbourhood. Actually, among our subsample of 653 polygons, 74 (11%) lived between 100 and 300 meters outside polygons and 12 (2%) lived between 300 and 500 meters outside polygons. Beyond an arbitrary threshold of 500 meters, we considered that computed polygons would more probably result from inconsistently reported street names. It would be interesting to validate this threshold with a more qualitative approach and explore the reasons why some people exclude their home location from their perceived neighbourhood. (4) Lastly, criteria defined in the GIS algorithm to connect streets that were mentioned and close the polygon may also have led to distortions in inhabitants’ spatial cognition. In the case of non-intersecting streets, variations in street length could have resulted in great variations in PNPs size. To mitigate some issues
14
concerning construction of PNPs, future research may benefit from using interactive mapping questionnaires allowing respondents to self-draw the limits of their perceived neighbourhood. Such innovative questionnaire tools may represent a significant step (Chaix et al. 2012) if they do not require too many computer skills. Another potential methodological limitation lies in the fact that the sample design of the SIRS cohort was not originally drawn up to be representative of the municipality population size. However, we observed a good balance between the 50 surveyed census tracts, since 13 belong to the Paris municipality, 17 to large peripheral municipalities and 20 to small peripheral municipalities. Besides, the SIRS sampling gave us an opportunity to explore gradients in area social deprivation since the SIRS cohort was designed to over-represent deprived census tracts.
Political implications and perspectives
We recommend that researchers working on large surveys select a subsample to collect information on residents’ perceived neighbourhood delimitations and derive estimated information on variability in perceived neighbourhood size. We admit that collection and analyze of residents’ perceived neighbourhood delimitations may be time-consuming. However present research emphasized that the results are worth it since using constant neighbourhood delineation would result in wrongly targeted areas where there is a crucial lack of “local” health resources, and would downplay the extent of inequalities in urban resources.
As recently noted, quantitative variations of perceived neighbourhood size have been explored in a handful of studies, mainly in U.S. cities (Sastry, Pebley and Zonta 2002). Our study within the Paris metropolitan area provided an unusual look at the variability of perceived neighbourhood size in a large European city. It could be used to compare differences in inhabitants’ neighbourhood experiences between European and American cities. Such a comparison could provide new insights into the role of metropolitan area organization, street connectivity and urban population densities in people’s neighbourhood experiences and in neighbourhood resource inequalities within and across European and North American cities.
When focusing on inequalities in neighbourhood resource accessibility, it would be also interesting to analyze how perception of neighbourhood can vary according to some social and demographic characteristics. To take gender as an example, current data reveal that women in the Paris metropolitan area perceive their residential neighbourhood as a significantly larger area than men, which should be considered when analyzing gender inequalities in local resources accessibility.
In urban and health planning, it might be advisable to pay close attention to inhabitants’ variability in neighbourhood experiences. To improve geographical accessibility to primary health-care resources, this paper also shows that some interventions could not only promote the establishment of health-care resources in some underserved areas, but also adapt local environments to offer more opportunities for appropriation of spaces in the neighbourhood.
C
ONCLUSIONFrom a cognitive mapping procedure, we have empirically highlighted some limitations of using constant neighbourhood spatial definitions in accessibility and health studies. Neglecting spatial variability in perceived neighbourhoods may have led to inaccurate estimations of: (i) the number of resources people may have access to in the neighbourhoods of residence and (ii) the extent of resource inequalities across the Paris metropolitan area. This type of error refers to what we have called here the “Constant Size Neighbourhood Trap”. To avoid falling into this trap, there is a crucial need to develop a more relational conception of accessibility, combining spatial resource distribution and people’s neighbourhood experiences. This place-and-people-based approach would benefit from research studies connecting social and health behaviours with resource accessibility and urban planning policies targeting underserved areas and population.
15 ACKNOWLEDGEMENTS
We thank the Centre National de la Recherche Scientifique (CNRS), the Collège International des Sciences du Territoire (CIST), the Institut de Recherche en Santé Publique de l'Université de Montréal (IRSPUM) and the CHUM Research Centre (CRCHUM) for their support.
We thank all the members of the Research Team on the Social Determinants of Health and Healthcare (U707) working on the SIRS cohort study.
R
EFERENCESApparicio, P., Abdelmajid, M., Riva, M. and Shearmur, R. (2008). Comparing alternative approaches to measuring the geographical accessibility of urban health services: Distance types and aggregation-error issues. International Journal of Health Geographics 7:7.
Banos, A., Chardonnel, S., Lang, C., Marilleau, N. and Thevenin, T. (2005). Simulating the swarming city : a MAS approach In Proceedings of the 9th International Conference on Computers in Urban
Planning and Urban Management. London.
Bissonnette, L., Wilson, K., Bell, S. and Shah, T.I. (2012). Neighbourhoods and potential access to health care: the role of spatial and aspatial factors. Health & Place 18:841-853.
Chaix, B. (2009). Geographic Life Environments and Coronary Heart Disease: A Literature Review, Theoretical Contributions, Methodological Updates, and a Research Agenda. Annual Review of
Public Health 30:81–105.
Chaix, B., Kestens, Y., Perchoux, C., Karusisi, N., Merlo, J. and Labadi, K. (2012). An interactive mapping tool to assess individual mobility patterns in neighborhood studies. American Journal of
Preventive Medicine 43:440-450.
Chauvin, P. and Parizot, I. (2009). Les inégalités sociales et territoriales de santé dans l’agglomération
parisienne : une analyse de la cohorte SIRS. Paris: Editions de la DIV. Les documents de
l’ONZUS.
Chauvin, P., Parizot, I. and Vallée, J. (2013). Les inégalités sociales et territoriales de santé en milie u urbain : enseignements de la cohorte SIRS. Actualité et dossier en santé publique, mars 2013, n°82, pp. 29-32. Actualité et Dossier en Santé Publique (ADSP) 82:29-32.
Couclelis, H. (1992). Location, place, region, and space. In Geography's Inner Worlds, ed. R.F. Abler; M.G. Marcus; and J.M. Olson: Rutgers University Press.
Coulton, C.J., Korbin, J., Chan, T. and Su, M. (2001). Mapping residents' perceptions of neighborhood boundaries: a methodological note. American Journal of Community Psychology 29:371-383. Cummins, S. (2007). Commentary: investigating neighbourhood effects on health-avoiding the 'local trap'.
International Journal of Epidemiology 36:355-357.
Cummins, S., Curtis, S., Diez-Roux, A.V. and Macintyre, S. (2007). Understanding and representing 'place' in health research: A relational approach. Social Science & Medicine 65:1825-1838. Farrington, J.H. (2007). The new narrative of accessibility: its potential contribution to discourses in
(transport) geography. Journal of Transport Geography 15:319-330.
Flowerdew, R., Manley, D.J. and Sabel, C.E. (2008). Neighbourhood effects on health: Does it matter where you draw the boundaries? Social Science & Medicine 66:1241-1255.
Golledge, R.G. and Stimson, R.J. (1997). Spatial Behaviour - A geographic perspective. New York: Guilford Press.
Gordon, C., Purciel-Hill, M., Ghai, N.R., Kaufman, L., Graham, R. and Van Wye, G. (2011). Measuring food deserts in New York City's low-income neighborhoods. Health & Place 17:696-700.
16
Guagliardo, M.F. (2004). Spatial accessibility of primary care: concepts, methods and challenges.
International Journal of Health Geographics 3.
Hägerstrand, T. (1970). What about people in regional science? Papers of Regional Science Association 24:7-21.
Haney, W. and Knowles, E. (1978). Perception of neighborhoods by city and suburban residents. Human
Ecology 6:201-214.
Hawthorne, T. and Kwan, M.P. (2013). Exploring the unequal landscapes of healthcare accessibility in lower-income urban neighborhoods through qualitative inquiry. Geoforum 50:97-106.
Inagami, S., Cohen, D.A. and Finch, B.K. (2007). Non-residential neighborhood exposures suppress neighborhood effects on self-rated health. Social Science & Medicine 65:1779–1791.
Kearns, R. and Moon, G. (2002). From medical to health geography: novelty, place and theory after a decade of change. Progress in Human Geography 26:605–625.
Kestens, Y., Lebel, A., Chaix, B., Clary, C., Daniel, M., Pampalon, R., Theriault, M. and Subramanian, S. (2012). Association between Activity Space Exposure to Food Establishments and Individual Risk of Overweight. PLoS ONE 7.
Kwan, M.-P. (2012). The uncertain geographic context problem. Annals of the Association of American
Geographers 102:958-968.
Kwan, M.P. (2009). From place-based to people-based exposure measures. Social Science & Medicine 69:1311-1313.
Leal, C., Bean, K., Thomas, F. and Chaix, B. (2011). Are Associations Between Neighborhood Socioeconomic Characteristics and Body Mass Index or Waist Circumference Based on Model Extrapolations? Epidemiology 22:694-703.
Lee, B.A. and Campbell, K.E. (1997). Common ground ? Urban neighborhoods as survey respondents see them. Social science quarterly 78:922-936
Lupton, R. (2003). 'Neighbourhood effects': can we measure them and does it matter? London, UK.: Centre for Analysis of Social Exclusion, London School of Economics and Political Science. Lynch, K. (1960). The Image of the City. Cambridge MA: MIT Press.
Macintyre, S., Macdonald, L. and Ellaway, A. (2008). Do poorer people have poorer access to local resources and facilities? The distribution of local resources by area deprivation in Glasgow, Scotland. Soc Sci Med 67:900-914.
Miller, H. (2007). Place-Based versus People-Based Geographic Information Science. Geography
Compass 1:503-535.
Oliver, L.N., Schuurman, N. and Hall, A.W. (2007). Comparing circular and network buffers to examine the influence of land use on walking for leisure and errands. Int J Health Geogr 6:41.
Openshaw, S. (1984). The Modifiable Areal Unit Problem.
Orford, S. and Leigh, C. (2013). The Relationship between Self-reported Definitions of Urban Neighbourhood and Respondent Characteristics: A Study of Cardiff, UK. Urban Studies In press. Paez, A., Mercado, R.G., Farber, S., Morency, C. and Roorda, M. (2010). Accessibility to health care
facilities in Montreal Island: an application of relative accessibility indicators from the perspective of senior and non-senior residents. International Journal of Health Geographics 9:52. Pearce, J., Witten, K., Hiscock, R. and Blakely, T. (2007). Are sociall y disadvantaged neighbourhoods deprived of health-related community resources? International Journal of Epidemiology 36:348-355.
17
Perchoux, C., Chaix, B., Cummins, S. and Kestens, Y. (2013). Conceptualization and measurement of environmental exposure in epidemiology: Accounting for activity space related to daily mobility.
Health & Place 21:86-93.
Préteceille, E. (2003). La division sociale de l’espace francilien. Typologie socioprofessionnelle 1999 et
transformations de l’espace résidentiel 1990-99. Observatoire sociologique du changement.
Rainham, D., McDowell, I., Krewski, D. and Sawada, M. (2010). Conceptualizing the healthscape: contributions of time geography, location technologies and spatial ecology to place and health research. Social Science & Medicine 70:668-676.
Sastry, N., Pebley, A.R. and Zonta, M. (2002). Neighborhood Definitions and the Spatial Dimension of Daily Life in Los Angeles: UC Los Angeles: California Center for Population Research.
Spielman, S.E. and Yoo, E.H. (2009). The spatial dime nsions of neighborhood effects. Social Science &
Medicine 68:1098-1105.
Vallée, J., Cadot, E., Grillo, F., Parizot, I. and Chauvin, P. (2010). The combined effects of activity space and neighbourhood of residence on participation in preventive health-care activities: The case of cervical screening in the Paris metropolitan area (France). Health & Place 16:838-852.
Vallée, J., Cadot, E., Roustit, C., Parizot, I. and Chauvin, P. (2011). The role of daily mobility in mental health inequalities: The interactive influence of activity space and neighbourhood of residence on depression. Social Science & Medicine 73:1133-1144.
Vallée, J. and Chauvin, P. (2012). Investigating the effects of medical density on health-seeking behaviours using a multiscale approach to residential and activity spaces: results from a prospective cohort study in the Paris metropolitan area, France. International Journal of Health
Geographics 11:54.
Vallée, J. and Shareck, M. (In press). Can we claim spatial misclassification of neighborhood exposures without any reference to people? A response to "Examination of How Neighborhood Definition Influences Measurements of Youths’ Access to Tobacco Retailers: A Methodological Note on Spatial Misclassification". American Journal of Epidemiology.
Zenk, S.N., Schulz, A.J., Matthews, S.A., Odoms-Young, A., Wilbur, J., Wegrzyn, L., Gibbs, K., Braunschweig, C. and Stokes, C. (2011). Activity space environment and dietary and physical activity behaviors: a pilot study. Health & Place 17:1150-1161.