HAL Id: halshs-01483963
https://halshs.archives-ouvertes.fr/halshs-01483963
Submitted on 6 Mar 2017HAL is a multi-disciplinary open access archive for the deposit and dissemination of sci-entific research documents, whether they are pub-lished or not. The documents may come from teaching and research institutions in France or abroad, or from public or private research centers.
L’archive ouverte pluridisciplinaire HAL, est destinée au dépôt et à la diffusion de documents scientifiques de niveau recherche, publiés ou non, émanant des établissements d’enseignement et de recherche français ou étrangers, des laboratoires publics ou privés.
A network-based approach to technology transfers in the
context of climate policy
Solmaria Halleck Vega, Antoine Mandel
To cite this version:
Solmaria Halleck Vega, Antoine Mandel. A network-based approach to technology transfers in the context of climate policy. 2017. �halshs-01483963�
Documents de Travail du
Centre d’Economie de la Sorbonne
A network-based approach to technology transfers in the context of climate policy
Solmaria HALLECK VEGA, Antoine MANDEL
A network-based approach to technology transfers in the context of climate policy
Solmaria Halleck Vega† and Antoine Mandel† November 2016
Abstract
In light of the urgency of climate change, there is a growing literature on the role of technology transfers and how policy can foster diffusion of climate-mitigation technologies. An important challenge is that the diffusion network is generally unknown. To address this key issue, we propose a systemic method building on the network inference literature. We then apply this approach using data on global diffusion patterns of wind energy technologies since the 1980s. Results show that the network’s evolution has been remarkable, consistent with the colossal growth and technological progress in wind power over the past decades and the leading role of European firms and other advanced economies in its development. In the context of climate policy and given the multipolar nature and structural inefficiencies in the network, we also appraise strategies to maximize diffusion of new technologies within developing regions and the potential to build bridges through new modes of cooperation.
Key words: Technology transfers, climate policy, diffusion networks, wind energy JEL codes: O33, Q54, Q55, C61, C63
________________________________
†Paris School of Economics, Centre d'économie de la Sorbonne, Université Paris 1 Panthéon-Sorbonne,
solmaria.halleck@univ-paris1.fr, antoine.mandel@univ-paris1.fr.
We thank Jochen Hinkel, Diana Mangalagiu, Katrin Millock, and participants of the Advances in the Modelling of Innovation and Finance workshop, October 13-14, 2016 at MINES ParisTech for useful discussions and comments. Both authors acknowledge the support of H2020 project GREEN-WIN.
1
Introduction
Technology transfers are put forward prominently, both in the Intended Nationally Determined Contributions (INDCs) and in the text of the COP21 Paris Agreement, as necessary conditions for the implementation of an effective mitigation policy at the global scale. Explicitly,
technology1 and capacity-building support by developed country Parties, in a predictable
manner, to enable enhanced pre-2020 action by developing country Parties.” The adoption of
new technology can also be an important driver of economic development for adopting countries, such as through the rise of new industries and growth of productivity or technological spillovers. Hence, technology transfers represent a key opportunity to link climate change mitigation and economic development.
The proactivity apparent in the Paris Agreement suggests that technology transfers could be heavily influenced or even controlled by national governments through bi- or multi-lateral agreements. This might be true in some very specific industries such as defense and aerospace. Yet, for most of the technologies, including “green” ones, the diffusion process is the outcome of interactions between private firms (though governments might be involved). Moreover, transfers can take many forms such as machinery, human experts, property rights, and employ a variety of vehicles such as foreign direct investment (FDI), purchase of equipment, license agreements, joint ventures, and government aid (see Haug, 1992 for an extensive discussion). In this complex landscape, it is much less clear what policy can do and how it can operate.
In order to shed light on these issues, this paper proposes a methodology to infer the network of technology diffusion between countries from adoption data and then investigates how this network could be used by international climate policy in order to foster mitigation via technology diffusion. Hence, our contributions are threefold: (i) to provide a map of the existing routes of technological diffusion and how it has changed over time, (ii) to better understand structural properties of the network and identify key players/groups, and (iii) to characterize efficient technology transfer policies and anticipate structural changes that could be brought about by new modes of international cooperation such as the development of climate clubs (see e.g., Nordhaus, 2015 in this respect).
Adopting a network-based approach allows us to provide a systemic perspective that accounts for the impact of each country not only on its direct connections, but also on the global diffusion process. Indeed, a country might be quantitatively neither the most important source nor the most important adopter of a technology, but still play an important role as a hub in its diffusion. The fundamental role of such network effects has been identified in a wide range of contexts such as epidemics (see e.g., Pastor-Satorras and Vespignani, 2001), social dynamics (see e.g., Castellano et al., 2009), spatial econometrics (see e.g., LeSage and Pace, 2009; Elhorst, 2014), and the diffusion of innovations (see e.g., Rogers, 1983).
From the methodological point of view, an important difficulty is that technology diffusion networks are generally not directly observed. To address this key issue, we build on the independent cascade model of Gomez-Rodriguez et al. (2010, 2011, 2014) and infer the structure of the network by maximizing the likelihood of the observed patterns of technology adoption using a parametric model of diffusion. To illustrate this approach, we infer the network of diffusion of wind energy technologies using a detailed database on wind turbines installed globally from 1983 onwards. The substantial additions to renewable energy capacity and technological advancements in wind power makes it an interesting case to analyze structural properties of the network. Given the network, efficient seeding strategies can then be appraised, i.e. strategies that pick up initial inception in order to maximize the diffusion of a new generation of technology.
The remainder of this paper is organized as follows. Section 2 reviews the related literature. Section 3 outlines the methodology and section 4 its application to the diffusion of wind energy, followed by quantitative analyses of the network. Section 5 then aims at appraising efficient strategies for technological diffusion and the potential to build bridges in view of climate policy. Section 6 concludes and raises ideas for further research.
2
Related literature
The importance of technological diffusion processes for the achievement of climate policy objectives has been emphasized at least since the Kyoto Protocol (see e.g., Blackman, 1999). Within the scientific community, the Intergovernmental Panel on Climate Change (IPCC) has repeatedly put forward its central role for climate policy and sustainable development (e.g., see
IPCC, 2014). In the policy debate, technology transfers are strongly emphasized in the Intended Nationally Determined Contributions (INDCs) prepared for the COP21 and their key role is recognized in the Paris Agreement which puts forward in its preamble “the urgent need to
enhance the provision of finance, technology and capacity-building” and devotes a full section to
its decisions on “technology development and transfer,” hence putting it on an equal footing with mitigation and adaptation.2
Three main market channels of technology transfer have been distinguished in the literature (cf. Glachant et al., 2013): (i) international trade in intermediate goods (e.g., export and import of capital goods such as machines and equipment), (ii) foreign direct investments including joint ventures, and (iii) licensing (e.g. of patents). Accordingly, the existing literature has mainly focused on the characterization of bilateral technological flows using measures such as international trade data, FDI, and patents (see e.g., Popp, 2005; Popp et al., 2011; Glachant et al., 2013, Dechezleprêtre et al., 2013). In the specific context of climate change mitigation, technology transfers through the clean development mechanism (CDM) and its determinants has also been investigated (see Dechezleprêtre et al., 2008, 2009; Rahman et al., 2016; and references therein). The data from the project design documents of the CDM is detailed, but a significant limitation, also mentioned by the former authors, is that data of projects are usually registered during a very short period (around 2 years), thereby not allowing to analyze the
dynamic aspects of diffusion. More generally, an important challenge for research on
technological diffusion put forward in Comin et al. (2013) is the lack of comprehensive datasets that directly document the diffusion of specific technologies across countries. Consequently, most empirical studies on technology adoption and transfer have treated adoption units as independent entities or have taken a bilateral approach as in the CDM literature (cf. Comin and Mestieri, 2014).
This focus on bilateral transfers or assuming units are independent of one another does not allow to take into account the role of interconnections (both direct and indirect) in the global diffusion of technologies. Yet, as emphasized in a recent survey on the diffusion of green technology, networks play a fundamental role in the spread of technologies (Allan et al., 2014).3 In the theoretical literature, recently developed network-based models of innovation and
technology diffusion (e.g. Centola et al., 2007; Montanari and Saberi, 2010; Acemoglu et al., 2011) provide insights on the influence of the network’s topology on its dynamics. These models consider a wide range of possible diffusion processes ranging from epidemic-like contagion to strategic adoption (see e.g. Montanari and Saberi, 2010) and linear threshold models (see e.g. Centola et al., 2007). Though conclusions on what facilitates diffusion is far from clear-cut, typically the literature suggests that innovations spread further across networks with a higher degree of clustering. In principle, clusters can promote diffusion where a seed node exists inside them, but they are more difficult to penetrate when not targeted during the initial seeding phase.
In the context of green technologies, a major challenge is that the diffusion network is usually unknown. As a solution, we use recently consolidated databases on global deployment of green technologies (the Wind Power database as far as this paper is concerned), and build on the growing network inference literature (Saito et al., 2009; Rodriguez et al., 2010; Gomez-Rodriguez et al., 2011; Daneshmand et al., 2014). The latter literature has led to the development of parametric models of diffusion that can be used to infer the structure of the network by maximizing the likelihood of the observed diffusion patterns. The application of network-based methods to international technology transfer has no precedent to our knowledge, though it is strongly inspired by the work of Hidalgo and Hausmann (2009) on economic development in the global network of countries and products.
3
Network inference method
The cornerstone of our approach is to use the independent cascade model of Gomez-Rodriguez et al. (2010) to infer a network of technological diffusion from a time-series of observations of the adoption/installation of subsequent generations of a technology within a country. The weights of the resulting network are interpreted as the rates at which an instance of the technology is likely to be transferred between countries. These weights summarize the effects of a number of latent variables that govern the bilateral diffusion between countries (e.g. the export strategy of firms, the flow of FDI or the existing trade and/or cooperation agreements between countries), and the systemic role that countries can play by serving as intermediaries in the global diffusion process. More formally, we consider that we are given series of observations of the diffusion of subsequent vintages of a technology. Each vintage c is characterized by a cascade of adoptions
!" = (&
'", … , &*"), which is an ,-dimensional vector of observed activation times. More
precisely, for each node i, &-" is an element in &
.", &." + 0 ∪ {∞}, which is equal to the time at
which country i adopted the technological vintage c if finite and is infinite if the country did not adopt the technology during a time interval of length 0 starting with the first adoption at time &.".
Note that the fact that a node is assigned ∞ as activation time does not mean stricto-sensu that the node did not get activated, but rather that his activation was discarded given the time-window considered as relevant. The data can then be represented by a set 5 of cascades, one cascade for every vintage, and denoted as 5 ≔ {!', … , !|8|}.
Our aim then is to infer from this data a diffusion network consisting in a pair (9, :) where 9 = (;, <) is a graph (i.e. a set of nodes V and a set of edges E) representing the potential diffusion paths of the technology and : = [>?,-] is a matrix of transmission rates, i.e. >?,- > 0
quantifies how likely it is that a technology spreads from node j to node i if (C, D) ∈ < (and >?,- = 0 if (C, D) ∉ <). The principle of the independent cascade model is to infer the maximum likelihood network under the assumption that each cascade is an independent instance of a diffusion process drawn from a parametric model in which the probability of diffusion from node
j to node i is parameterized by the transmission rate >?,- (that is to be determined).
More precisely, the building block of our approach is the probability G(&-|&?; >?,-) that node i gets activated by node j at time &-, given node j was activated at time &? and assuming a
transmission rate >?,- between nodes j and i. One then says that node j is the parent of node i. The functional form of G conveys the structural assumptions about the diffusion process. In the following, we shall consider the exponential model for which G &- &?; >?,- = >?,-IJKL,M(NMJNL) (if
&? < &- and zero otherwise). This corresponds to a setting where the rate of diffusion from an activated node to its neighbors is constant over time, i.e. the diffusion process follows a Poisson process. We shall also consider the power-law model as an alternative, for which G &- &?; >?,- = >?,-(&- − &?)J'JKL,M (if &
? < &- and zero otherwise). As emphasized by Barabási (2005), this model
can be seen as the outcome of a queuing process in which a decision-maker intervenes to set priorities. It leads to much fatter tails in the temporal distribution of events than the exponential distribution, consistently with empirical data about the timing of human-driven events. In our setting, it amounts to considering that most diffusion events are clustered near the activation time
interpretation of this pattern is that countries generally adopt the latest vintage of a technology so that the bulk of adoptions should happen in a relatively short time-window after its inception before the technology becomes obsolete.
Now, given the conditional density G &- &?; >?,- , one can infer the likelihood of a set of cascades {!', … , !|8|} given a network : = [>
?,-] as follows (see Gomez-Rodriguez et al., 2011
for a comprehensive discussion).
• First, given a cascade !" = (&'", … , &*"), the likelihood of node i being activated by node j
is given by: G &- &', … &*∖ &-; : = ?:NLWNMG &- &?; >?,- × ?TU,NVWNMS &- &U; >U,- (1) where S &- &?; >?,- is the survival (anti-cumulative distribution) function of edge D → C,
that is the probability that j does not cause i to activate by time &-. Indeed, assuming a node gets activated only once, one shall consider it is activated by node j only if it has not been activated before by another node in the cascade.
• One can then compute the likelihood of the activations in a cascade before time 0 as: G(!WZ" ; :) = G &
- &?; >?,- × U:NV[NM,UT?S &- &U; >
U,-?:NLWNM
NMWZ (2)
• Further, the likelihood of a cascade accounts for the fact that some nodes did not get activated (we consider that nodes not activated before time 0 never get activated). It is therefore given by: G(!" ; :) =
S(0|
N\]Z &-; >-,^) NMWZ ?:NLWNMG &- &?; >?,- U:NV[NM,UT?S &- &U; >
U,-NMWZ (3)
• Finally, the likelihood of a set of cascades 5 = {!', … , !|8|}, assuming each cascade is independent, is the product of the likelihoods of the individual cascades given by equation (3), that is: G !', … , !|8| ; : = G(
N_∈8 !"; :)
(4)
The objective is ultimately to find : = [>?,-] such that the likelihood of the observed set of
cascades 5 = {!', … , !|8|} is maximized. The solution of the network inference problem can thus
be stated as solving the following maximum likelihood (ML) optimization problem: minimize A − log G(!"; :)
"∈8
subject to >?,- ≥ 0, C, D = 1, … , ,, C ≠ D (5) In practice, we solve equation (5) using CVX, which is a general purpose package in MATLAB for specifying and solving convex programs (Grant and Boyd, 2015) and the algorithm
NETRATE, which are publicly released open source implementations. This continuous time model of diffusion has a resemblance to the additive regression model used in survival theory analysis (see e.g., Aalen et al., 2008), which has also interestingly been used for link prediction in social network data by Vu et al. (2011), relating to the network formation literature.
The inferred network provides two main types of information. First, the adjacency structure of the network indicates which routes technologies are likely to follow in their diffusion. Second, the weight of an edge gives an estimate of the speed at which diffusion is likely to occur between nodes. Note that this interpretation does not presuppose that diffusion is the outcome of a (rational) decision of countries, consistently with the epidemiological roots of the model. Similar to the reproduction and the diffusion of viruses, which are the outcome of micro-level phenomena beyond the control of the central nervous system, the diffusion of technologies is the outcome of the decisions of firms and households, which are for the most part beyond the control of the state. This does not imply that the state cannot influence the diffusion process through policy. However, in the following, we shall consider the national policy setting is fixed and rather consider policy interventions at the international level such as the exogenous inception of a technology in a country, for example through CDM like projects.
4
The wind energy network
4.1 Context and data
Wind energy is currently the most important source of renewable energy and has been growing exponentially in the last decades (see Figure 1 as well as GWEC, 2015 and IEA, 2015). Therefore, it is expected to play a key role in mitigation policy globally. From this perspective, a prerequisite is to ensure that new generations of wind turbines can be diffused rapidly at the global scale. A key empirical macro-level observation in this respect is that the geographical pattern of deployment is changing. Whereas OECD countries led early wind development, from 2010 non-OECD countries installed more wind turbines, and using scenario-based analysis it is predicted that after 2030 this will rise to more than 50% of global installed capacity (see OECD/IEA, 2013). This further emphasizes the need of efficient technological diffusion to
Indeed, technological improvements of wind turbines since the 1980s has largely contributed to growth in wind power capacity. The general trend has been an overall growth in size, with an increase in the height of the tower, the length of the rotor blades and greater power capacity (see the Wind Energy Technology Roadmap report in OECD/IEA, 2013 for details).4
Figure 1. Wind power capacity
Source: Global Wind Energy Council statistics
The Wind Power database provides detailed technological and industrial information, as well as almost comprehensive coverage on the wind turbines installed worldwide from 1983 onwards5. Hence, it can be used to construct the cascades of successive technology vintages and therefrom infer the network of diffusion of wind energy corresponding to the methodology introduced above. Table A1 in the appendix provides details on the country, wind farm, and power capacity coverage for the 94 countries in the database. These include wind farms that have been installed and are in operation, as well as under construction, approved or planned within each country. As can be seen in the sample of the data provided in Table A2 in the appendix, for wind farms with the status operating, there is information on the commissioning date. These are
4Klaassen et al. (2005) also provide more details on the impact of public R&D expenditures in promoting progress
of wind turbine technology in their case study on Denmark, Germany, and the United Kingdom.
time series observations spanning the period from 1983 to 2016. The database also contains entries corresponding to wind farms “under construction”, “approved” and “planned”. In order to account for this data, which conveys essential information on recent diffusion patterns, we assign to the corresponding wind farms an “expected” commissioning date of 2017, 2018, and 2019 respectively.
The uniqueness of the dataset is that in addition to the space and time information coverage of the wind farms, there is also precise data on power capacity and manufacturers of the wind turbines of the wind farms. This allows us to identify 240 vintages of technologies, which are mainly characterized by the size of the turbine and the manufacturer (e.g. as shown in Table A2, the Samsung 2500, the Vestas 2600 and so forth). One can then define one cascade per technology vintage as follows. We consider countries as our nodes and set the activation time of a given technology vintage for a country as the commissioning date of the first wind farm in the country using the vintage. By convention, the activation time of a country not using the vintage is set to infinity. After excluding some countries of the dataset because of unavailable data6, we hence construct the cascades spanning 94 countries over a period of 37 years.
4.2 Statistical analysis of the network
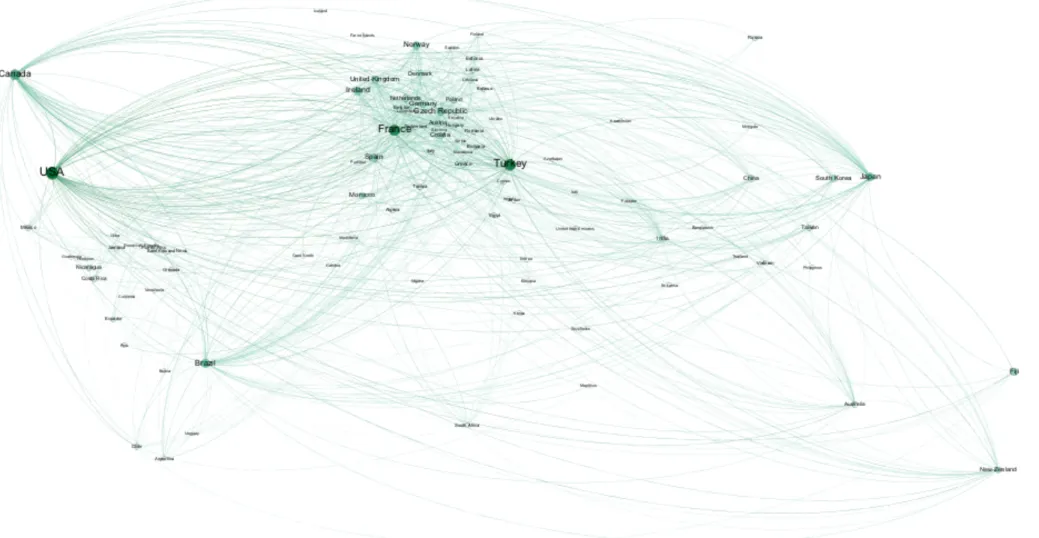
As illustrated in Figure 2, the inferred network first provides a map of existing diffusion routes and hence a much broader view than obtained from the sole consideration of bilateral transfers.7 For example, in our setting, it can be the case that countries x and y are not linked by a direct transfer, but that there exists a very short path from x to y through z, hence diffusion shall nevertheless occur relatively rapidly from x to y. On the contrary, the path from x to w could be relatively long (going through a,b,c,d,e, and so forth), which suggests a relatively long lag in the diffusion from x to w. Figure 2 (and 2.1) also puts forward the existence of a well-connected core mainly formed by the most advanced European countries surrounded by a periphery organized in geographical clusters, with large economies such as the United States prominent as
6In particular, these are Albania, Chad, Curacao, Mozambique, Namibia, Panama, Tanzania, and Vanuatu. Also,
there is no data altogether for Guyana and Indonesia.
well. This is consistent with the leading role played by firms and these countries in wind energy development over the past decades. Other countries such as China are coming more to the forefront, and these relatively more recent developments could result in a greater role in the network in the upcoming years. This also relates to the changing panorama of wind development made in the recent OECD/IEA (2013) report discussed above.
From a quantitative perspective, structural properties of the diffusion process can be characterized via a statistical analysis of the network. In this respect, key features of the network are reported in Table 1.
Table 1. General properties of the network
Overall network characteristics exponential model power-law model
Number of nodes 94 94
Number of links 596 752
Network density 0.068 0.086
Mean degree 12.681 16
Mean path length 2.905 2.548
Network diameter 8 6
Mean clustering coefficient 0.146 0.299
First, the basic measure of importance of a node is the degree, which measures its number of connections. In a directed network, one distinguishes the in-degree (number of incoming links) and the out-degree (number of outgoing links). In the context of technological diffusion, they respectively measure the direct potential to adopt or spread a technology. The inferred network has 596 edges, i.e. 596 links among the 94 countries. In other words, the average degree is approximately 12.6 and the network density, i.e. the ratio between actual and total potential number of links is 0.07. These values are in line with those generally observed in socio-economic networks (see Chandrasekhar, 2015 or Albert and Barabási, 2002). The power-law model infers more links than the exponential one, consistently with the fact that the diffusion process decays more rapidly in the former case. Indeed, more links are then necessary to explain the same “volume” of observed diffusion.
Then, the basic measure of distance between two nodes is the shortest path, also known as the geodesic distance, which corresponds to the length of the path that connects them with the smaller number of edges. The average path length of the network is then computed by summing up all the shortest paths and dividing by the total number of pairs. In the context of technological diffusion, the average path length can be seen as a measure of the average technological distance between two countries and in our setting, it has a value 3. This is relatively large with respect to the random graph benchmark usually satisfied by socio-economic networks (Albert and Barabási, 2002) and for which the average path length corresponds to the log ratio between number of nodes and average degree (1.8 in our setting).
Furthermore, the diameter of the network (the shortest path between the two most distant nodes) has a value of 8 in our setting, which is again relatively large with respect to the random graph benchmark (it ought to be close to the average path length following equation (16) in Albert and Barabási, 2002). These relatively large diameters and average path lengths hint at the existence of relatively long lags in the diffusion processes. Reinforcing evidence also emerges in Figure 2, where one can observe that certain countries (e.g. Bolivia and Peru) are very loosely and indirectly connected to the core of the network and, more generally, that there are weak interconnections between the different regional clusters. Hence the current wind technology diffusion network displays a certain level of inefficiency. In particular, there might be significant delays between technology adoption in advanced and developing countries.
To further investigate this issue, as a complement we have performed a regional-level analysis, which further reinforces these observations. It is apparent from both Table 2 and the diagonal elements of the matrix in Table 3 that Europe has by far the greatest amount of total and intraregional connections, indicating that activity is highly concentrated. Europe also has the largest off-diagonal elements, reflecting it is the most integrated area in the diffusion network. Though this region also has the most country coverage, still, its presence is clearly prominent. The most interregional flows are between Europe and Asia, followed by Europe and America.
Table 2. Regional-level statistics
Id Region No. of countries In-degree Out-degree Source region (%) Target region (%) Total degree 1 Africa 14 35 33 5.53 5.87 68 2 America 22 113 118 19.80 19.13 231 3 Asia 20 106 104 17.45 17.79 210 4 Europe 35 322 319 53.52 54.03 641 5 Oceania 3 20 22 3.69 3.36 42
Table 3. Matrix of intra- and interregional connections Africa America Asia Europe Oceania
Africa 3 5 10 14 1
America 9 36 22 48 3
Asia 3 21 17 60 3
Europe 18 47 52 190 12
Oceania 2 4 5 10 1
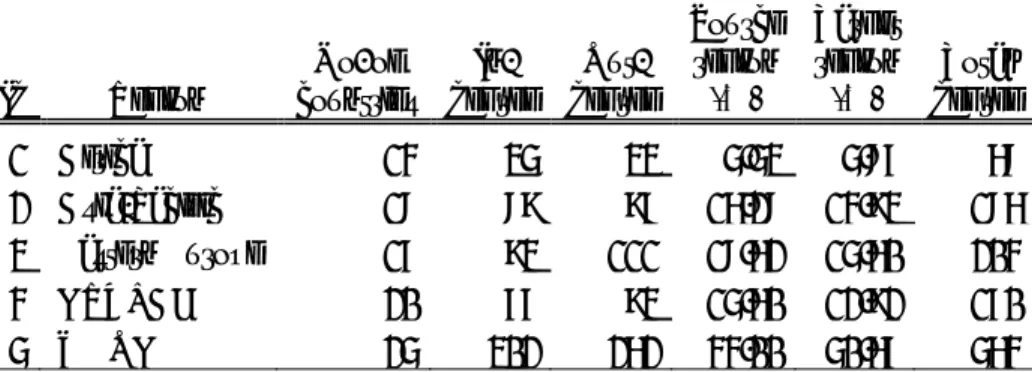
It is also informative to evaluate these figures following the United Nations Framework Convention on Climate Change (UNFCCC), where Parties are organized into five regions: African Group, Asia-Pacific Group, Eastern European Group, Latin American and Caribbean Group (GRULAC), and the Western European and Others Group (WEOG). These groups are based on the tradition of the UN, and the others in WEOG include Australia, Canada, Israel, New Zealand, Turkey, and the United States.
Table 4. UN regional grouping statistics
Id Region No. of countries In-degree Out-degree Source region (%) Target region (%) Total degree 1 Africa 14 35 33 5.53 5.87 68 2 Asia-Pacific 18 89 97 16.28 14.93 186 3 Eastern Europe 17 93 111 18.62 15.60 204 4 GRULAC 20 77 93 15.60 12.92 170 5 WEOG 25 302 262 44.00 50.67 564
Table 5. Matrix of intra- and interregional connections for UN regional grouping
Africa
Asia-Pacific
Eastern
Europe GRULAC WEOG
Africa 3 6 4 6 14
Asia-Pacific 3 17 21 14 42
Eastern Europe 5 15 21 10 60
GRULAC 9 15 13 23 33
WEOG 15 36 34 24 153
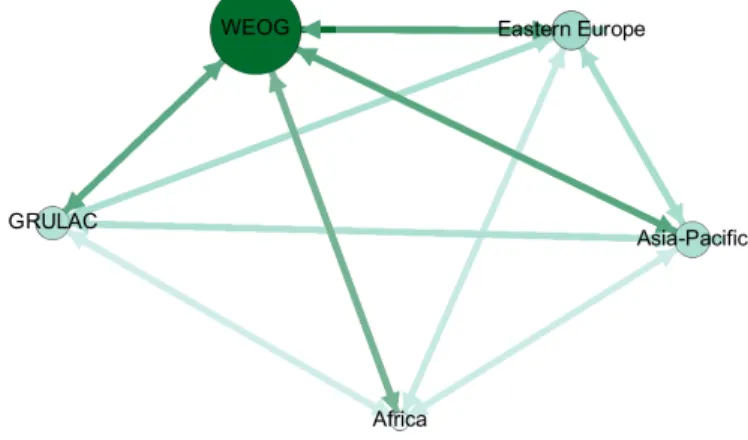
This subdivision reveals complementary insights. It is even more apparent that especially the WEOG countries are the most important regional hub, both in terms of links among themselves, as well as links with the other regional groups (see Tables 4 and 5). In fact, compared to other regions, the diagonal elements far exceed the off-diagonal elements. In contrast, for example, the Asia-Pacific region has much more connections with WEOG countries than countries within the own region. Interestingly, based on the distribution of exported climate-mitigation inventions using patent data, Dechezleprêtre et al. (2011) also find that technology is mainly exchanged between industrialized countries, while transfers are almost nonexistent between developing countries. To illustrate, Figure 3 shows the interconnections among the regions with the size of nodes and darker color corresponding to total degree (both intra- and inter-regional). The regional-level analysis based on the power-law model results are similar (see Tables 4.1 and 5.1 in the appendix). For example, in both cases the within-region links in WEOG amount to around 28%, while they are only around 10% for the Eastern European Group.
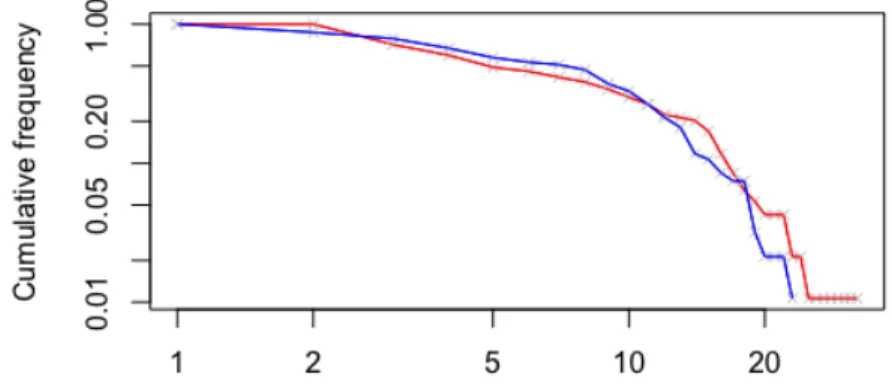
To gain more quantitative insights on the issue, we provide a systemic characterization of the network via its degree distribution, which is constructed by computing for each potential value of the degree, the number (or the share) of nodes assuming that particular value. The degree distribution hence summarizes the structure of the network. The out-degree and in-degree cumulative distributions of the wind network are shown in Figure 4 in log-log scale. The distribution clearly has fatter tails than normal, consistently with the presence of highly connected nodes in the core. The middle range of the distribution even seems to follow a power law. As a matter of fact, the Kolmogorov-Smirnov statistics fail to reject the hypothesis that the data could have been drawn from the fitted power-law distribution (the KS-statistics are 0.163 (p-value=0.97) for the in-degree distribution and 0.124 (p-value=0.98) for the out-degree distribution).8 However, the right tail of the distribution clearly drops faster than that of a power law. This indicates the lack of very large nodes that would play the role of central hubs in the diffusion process and hence increase its efficiency. The distance-based utility model of Jackson (2008) further suggests that in a setting where the social objective amounts to minimizing distances in a network, the star would be the efficient network. A graphical comparison then suggests that the existing wind network has a much less hierarchical structure with a relatively large number of nodes with medium connectivity, but no clear center.
Figure 4. Cumulative distribution of countries’ out-degree and in-degree
8The KS-statistics from the the power-law model results are very similar, namely 0.137 (p-value=0.98) for the
In order to further understand the origins of the current structure, our methodology can be used to simulate the network formation process by running the network inference algorithm for sub-periods of increasing lengths. The results of this analysis are presented in Figure 5 in the appendix. They can be compared with benchmark network formation processes such as preferential attachment, according to which entering nodes should connect to existing nodes with a probability proportional to the latters’ degree.
A first key observation is that the growth of the network has been remarkable, expanding considerably both in terms of size and of connectivity. Compared to Figure 2, the landscape for the earliest sub-period is much less dense made up of a few major economies such as Denmark, a pioneer in developing commercial wind power. In the following sub-period, 1983-2000, it can be seen that the major players are Austria, Denmark, Germany, Greece, Ireland, the Netherlands, Spain, and the United Kingdom in Europe, which branch among themselves as well as with mainly China, Japan, and the United States. It can still be seen that are much less countries in the network, such as South Africa which reflects that large-scale wind farms did not pick up there until the later 2000s.
Comparing Figure 2 with the sub-period 1983-2005, three main changes come into view: the concentration in Europe is much greater (e.g., Belgium, Denmark, Germany, and Sweden have very high betweenness), China, India, Japan, and New Zealand are also more prominent in their respective regions, and other areas in the world are much less represented (e.g. Latin America). For 1983-2010, the network is still less dense, and importantly there is still less of a presence of some regions such as Latin America. The United States is quite more prominent in the network, as well as India and South Korea. Though sub-period 1983-2015 is as expected similar to Figure 2, in general, there have been significant topological changes reflecting the vastly dynamic nature of the wind energy diffusion network. It also emerges, in particular, that a number of links are formed between countries entering the network contemporaneously, and this divergence from preferential attachment might help explain the lack of a single or only a few prominently central nodes in the network. This explanation is further backed by the fact that the assortativity coefficient of the network is positive (though small, equal to 0.112). Indeed, positive assortativity indicates that nodes tend to link to peers with the same or similar degree.
4.3 Centrality analysis
To further investigate the role and position of hubs in the network, several centrality measures developed in the literature can be used in our framework (see Jackson, 2008 for an overview):
• The degree centrality of node i is simply given by its degree.
• The closeness of node i, 1/ ?g(D, C), is based on the average distance of i and
hence measures how fast a technology seeded in one country would, on average, reach another country in the network.
• The betweenness centrality of node i measures the share of shortest paths in the network on which node i lies (see appendix, A3 for a formal definition). Hence, in our context, it measures to which extent a country can serve as a hub in the diffusion process.
• The eigenvector centrality is a recursive measure that assigns a high value to nodes which are connected to other important nodes (see appendix, A3 for a formal definition). In the context of technological diffusion, it can be seen as a measure of the total diffusion range (direct and indirect) of a technology, as a function of the seed country.
Table 6 and Figure 6 in the appendix provide an overview of the distribution of centrality in the network. It is clear that among the most predominant countries are France, Germany, Ireland, Italy, Spain, Sweden, Turkey, the United Kingdom, and the United States. In fact, many overlap across the different centrality measures. Canada, Denmark, Finland, and Hungary also appear among the top for some of the indicators. In addition, it can be observed that some emerging economies including the major BRICS, with the exception of Russia, have a strong presence, especially Brazil and China.9 Although out-degree can be seen as reflecting a spreader of technology, with a higher number implying greater coverage, in-degree can also be a key indicator of the receptiveness to the technology. Since the diffusion process involves the accumulation of technology over space and time arising from adoption decisions, both the ability to spread and absorb new technologies are interrelated and important. In aggregate, main hubs
are France, Germany, the United Kingdom, and the United States. With respect to closeness centrality, which provides an indication of which countries can reach all other reachable nodes quickly, Turkey, Hungary, Spain, Germany, Italy, the United States and United Kingdom are among those taking top positions.
Betweenness centrality is particularly insightful. As previously discussed, it determines the relative importance of a country by measuring the amount of flows through that country to other countries in the network, thus acting as a bridge. The visualization of the network based on the betweenness indicator (Figure 2) highlights the importance of both regional and global hubs in the wind energy diffusion network. For example, Brazil for Latin America, Canada and the United States in North America, France in Europe which is evidently very central in the network, Turkey for Eurasia, Australia for Oceania, and South Korea, as well as China and Japan for Asia. Eigenvector centrality builds upon degree centrality, also taking into account the quality of the connections, i.e. how connected a country is to hubs in the wind energy diffusion network. France, the United States, the United Kingdom, Germany, Sweden, Finland, and China are among the most important actors in the network according to this measure (see Figure 6). It should be noted that some of these are also hubs themselves, while some countries such as Croatia and Denmark do not overlap over these measures.
Hence, the comparison between centrality measures reinforces the conclusion of the preceding section: there is only partial overlap between the different centrality measures and the distribution of centrality among top nodes is relatively uniform. In this sense, the network is multipolar and no single node appears as an evident center. Therefore, it is not straightforward to put forward a node, nor a region, as the optimal target for the inception and the diffusion of new vintages of wind technology.
5
Efficient diffusion strategies and building bridges
5.1 Simulations
In order to gain further insights on the means to achieve efficient technology diffusion in the multipolar world described above, we run a series of simulations in which we compare the performance of different seeding strategies that foster the inception of a technology in a certain
initiator of the technology, but also as a partner country in which the country is proactively diffused in the context of bilateral or multi-lateral technological cooperation or development aid. For the simulations, we first randomly draw (e.g. 1,000 times) the activation times from the probability density function (pdf) of the exponential distribution given the transmission rates, i.e., G &?,-; >?,- = >?,-× IJKL,MNL,M if &?,-> 0 and zero otherwise. Then, using these activation times,
we calculate the minimum costs (i.e. the minimum time it takes for country i to reach other countries j) and shortest paths using Dijkstra's algorithm.10
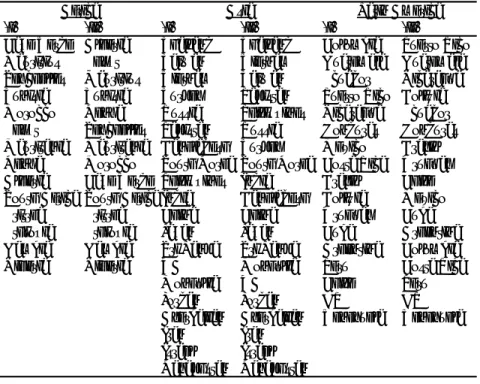
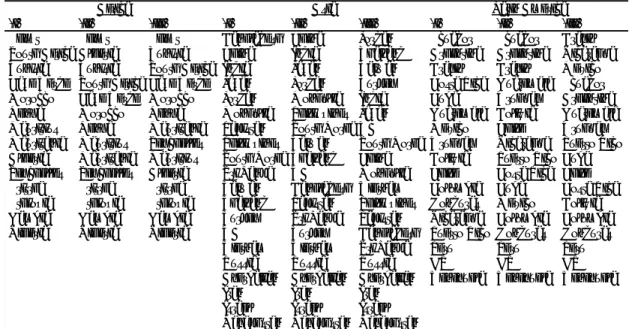
In line with the objectives put forward by the UNFCCC (2015) of using technology transfers in order to foster climate change mitigation and economic development, we focus on the efficiency of technological diffusion within developing regions. Table 7 provides a ranking of subsets of developing countries based on the (i) maximum time it takes for them to spread to all other countries in their respective regions, and (ii) ability to achieve the most technological deployment (i.e. the most coverage) in the region within two decades. This amount of time is relatively short-term in the context of climate mitigation and policy.
Table 7. Rankings based on simulations
10This has been implemented using Joseph Kirk’s code available on the file exchange of MathWorks. The outputs
are an ,×, matrix of minimum cost values for the shortest paths, and an ,×, cell array containing the shortest path arrays where each element shows for each country, which countries are required to reach all other countries. To be noted is that the pdf of the exponential distribution in MATLAB is defined using an alternative parameterization, namely, 1/>?,-× IJNL,M/KL,M if &?,-> 0 and zero otherwise; hence we take the reciprocal of the transmission rates.
(i) (ii) (i) (ii) (i) (ii)
Cape Verde Algeria Thailand Thailand Colombia Puerto Rico Mauritius Egypt Taiwan Vietnam Guatemala Guatemala Seychelles Mauritius Vietnam Taiwan Ecuador Nicaragua Tunisia Tunisia Turkey Pakistan Puerto Rico Bolivia Morocco Kenya Russia Philippines Nicaragua Ecuador Egypt Seychelles Pakistan Russia Honduras Honduras Mauritania Mauritania Bangladesh Turkey Mexico Brazil Kenya Morocco South Korea South Korea Costa Rica Uruguay Algeria Cape Verde Philippines India Brazil Chile South Africa South Africa India Bangladesh Bolivia Mexico Eritrea Eritrea China China Uruguay Cuba Ethiopia Ethiopia Japan Japan Cuba Argentina Gambia Gambia Sri Lanka Sri Lanka Argentina Colombia Nigeria Nigeria UAE Mongolia Peru Costa Rica
Mongolia UAE Chile Peru
Jordan Jordan DR DR
Azerbaijan Azerbaijan Venezuela Venezuela
Iran Iran
Israel Israel Kazakhstan Kazakhstan
A striking result for Africa is that South Africa does not seem to be an efficient hub in terms of a spreading potential of new technology (in this case of wind power) to the rest of the countries in the region. In contrast, northern African countries such as Egypt appear to be able to cover more countries faster overall and in a shorter amount of time. For Eritrea and the other bottom-ranked countries, the number of out-going links is actually zero.
For the Asian regional group, Thailand, Vietnam, Taiwan, and Turkey are among the top-ranked. Though there is some overlap with the rankings based on the centrality measures, the simulation results imply that Southeast Asia and Taiwan have a more promising potential as spreaders of new technologies in the region than implied by the centrality measures.
For Latin America, Colombia appears to best cover Latin America as a whole, but is not the fastest in terms of covering the most countries in a shorter period. Surprisingly, though Brazil is mid to top-ranked, it is not among the top spreading forces in the region.
Note however, that this first set of results might be influenced by the fact that high-degree nodes tend to have lower weights associated to their links by the diffusion model. Indeed, given that each bilateral diffusion is assumed to be independent, high-degree nodes are somehow expected to diffuse each technology they adopt to all their neighbors, which they obviously do not.
As a matter of fact, some of the best performing countries according to our simulations such as Taiwan and Thailand for Asia or Colombia in Latin America have much lower degree than the major economies of their regions such as China, India, Japan or Brazil respectively. In order to clarify the issue, we conduct a similar analysis in the unweighted network, i.e. we assume technology transfers occur over each link with the same probability. This amounts to rank countries according to their maximum or average shortest path to other countries in their geographical zone as reported in Table 8. “Small” countries identified as efficient hubs in the preceding simulation generally remain so in this complementary analysis, but major economies also play a more prominent role. This is in particular the case for South Africa, Brazil and China that then appear as important hubs to initiate further propagation of technologies in their respective regions.
Table 8. Rankings based on shortest paths
Notes: Ranking is in ascending order. Column (i) corresponds to maximum shortest path, (ii) minimum,
and (iii) average. For Asia, it should be noted that for (i) most countries have the same value of 5, with the exception of the last five listed; for (iii) most values are in the 2 to 3 range for the top 11 ranked.
These results nevertheless strengthen those of the preceding sections and suggest there is much room for improvement in the global technology transfer network. This leaves it interesting to analyze how the network can be upgraded. As a step forward in this direction, we explore the potential to accelerate the diffusion through the creation of new connections.
5.2 Potential of new connections
In order to assess the potential impact of new connections on technological diffusion, we perform a series of experiments in which we measure, using the notion of shortest path, the speed at which a new vintage of technology would diffuse if it were initially seeded in a pair of countries (rather than a single country in the previous section). This experiment can equivalently be interpreted as the creation of a link between the pair and the subsequent diffusion of the technology from this newly created link. From an economic point of view, this newly created link can be interpreted as a new trading route for the technology provider or the outcome of strengthened cooperation between the two countries.
(i) (ii) (iii) (i) (ii) (iii) (i) (ii) (iii)
Egypt Egypt Egypt Bangladesh China Jordan Ecuador Ecuador Brazil South Africa Algeria Tunisia China India Thailand Argentina Argentina Nicaragua Tunisia Tunisia South Africa India Japan Taiwan Brazil Brazil Mexico Cape Verde South Africa Cape Verde Japan Jordan Turkey Costa Rica Guatemala Ecuador Morocco Cape Verde Morocco Jordan Mongolia India Cuba Uruguay Argentina Kenya Morocco Kenya Mongolia Philippines Japan Guatemala Bolivia Guatemala Mauritius Kenya Mauritania Pakistan South Korea UAE Mexico Chile Uruguay Mauritania Mauritius Seychelles Philippines Taiwan South Korea Uruguay Nicaragua Puerto Rico Algeria Mauritania Mauritius South Korea Thailand China Bolivia Puerto Rico Cuba Seychelles Seychelles Algeria Sri Lanka UAE Mongolia Chile Costa Rica Chile Eritrea Eritrea Eritrea Taiwan Bangladesh Vietnam Colombia Cuba Costa Rica Ethiopia Ethiopia Ethiopia Thailand Pakistan Philippines Honduras Mexico Bolivia Gambia Gambia Gambia Turkey Sri Lanka Pakistan Nicaragua Colombia Colombia Nigeria Nigeria Nigeria UAE Turkey Bangladesh Puerto Rico Honduras Honduras
Vietnam Vietnam Sri Lanka Peru Peru Peru
Russia Russia Russia DR DR DR
Azerbaijan Azerbaijan Azerbaijan Venezuela Venezuela Venezuela
Iran Iran Iran
Israel Israel Israel Kazakhstan Kazakhstan Kazakhstan
There are 4,371 possible such pairs. We rank the pairs in terms of the time required to diffuse the technology in the whole network and also determine an efficiency gain (for both countries in the pair) by computing the ratio between total diffusion times in the two seed case and the single seed case. Results are reported in Table 9.
A priori, the ranking of pairs has two main drivers. First, the centrality of the individual nodes in the pair matter as it determines the initial level of diffusion from which the new link can build. Second, the complementarity, in terms of distance to third countries, between the two nodes matter as it will determine the gain provided by the new link. As a matter of fact, it turns out that the more efficient pairs are formed by a very central node (such as France, Spain, U.K, U.S.A, which have a high betweenness in the initial network) together with a node to which it was remotely connected in the initial network. Indeed, the high centrality agent provides a high initial diffusion potential while the newly created link to a distant node provides complementary connections to remote parts of the network. As a side effect, this provides an opportunity for the relatively remote countries to become more integrated in the network. These features can be related to the network formation literature, in particular the theory of “structural holes” where the advantages of serving as an intermediary or bridge between agents that are otherwise not directly connected is highlighted (see e.g., Kleinberg et al., 2008). On the contrary, it would not be efficient to link two already central nodes as their diffusion potential would partly overlap and they are likely to be relatively close in the initial network already.
From a more quantitative perspective, the new links yield a sizeable efficiency gain for both nodes in the pair (in the 1.25-1.5 range, i.e. 25% to 50% increase). The gain being higher for countries that were very weakly connected in the initial network (such as Bolivia or Nigeria).
From a policy oriented perspective, our results highlight the fact that new transfer relationships benefit not only the pair of countries concerned, but also have positive effects for the network as a whole. It therefore seems crucial to better understand the determinants of network formation, such as using recent advances in network econometrics (see Chandrasekhar, 2015), in order to investigate how climate policy can foster technological diffusion. In particular, it might be very interesting to determine the influence on link formation of participation in international trade and environmental agreements in connection with the notion of climate club recently put forward in the literature (see e.g., Nordhaus, 2015).
Table 9. Top 50 pairs based on shortest paths
Id Country a Id Country b Efficiency gain a Efficiency gain b 32 France 2 Argentina 1.25 1.5 32 France 3 Australia 1.25 1.5 32 France 9 Bolivia 1.25 1.75 32 France 10 Brazil 1.25 1.5 30 Fiji 11 Bulgaria 1.5 1.5 32 France 11 Bulgaria 1.25 1.5 56 Mauritius 11 Bulgaria 1.5 1.5 32 France 14 Chile 1.25 1.5 32 France 15 China 1.25 1.25 32 France 20 Cyprus 1.25 1.5
32 France 21 Czech Republic 1.25 1.25
32 France 24 Ecuador 1.25 1.5 80 Spain 30 Fiji 1.25 1.5 90 United-Kingdom 30 Fiji 1.25 1.5 92 USA 30 Fiji 1.25 1.5 38 Honduras 32 France 1.5 1.25 52 Lithuania 32 France 1.25 1.25 55 Mauritania 32 France 1.5 1.25 57 Mexico 32 France 1.25 1.25 58 Mongolia 32 France 1.5 1.25 62 Nicaragua 32 France 1.5 1.25 65 Pakistan 32 France 1.5 1.25 68 Poland 32 France 1.5 1.25
70 Puerto Rico 32 France 1.5 1.25
74 Serbia 32 France 1.5 1.25 80 Spain 32 France 1.25 1.25 84 Taiwan 32 France 1.5 1.25 85 Thailand 32 France 1.25 1.25 87 Turkey 32 France 1.25 1.25 90 United-Kingdom 32 France 1.25 1.25 91 Uruguay 32 France 1.5 1.25 92 USA 32 France 1.25 1.25 80 Spain 36 Grenada 1.25 1.25 90 United-Kingdom 36 Grenada 1.25 1.25 92 USA 36 Grenada 1.25 1.25 80 Spain 56 Mauritius 1.25 1.5 90 United-Kingdom 56 Mauritius 1.25 1.5 92 USA 56 Mauritius 1.25 1.5 80 Spain 63 Nigeria 1.25 1 90 United-Kingdom 63 Nigeria 1.25 1 92 USA 63 Nigeria 1.25 1
80 Spain 73 Saint Kitts and Nevis 1.25 1.25 90 United-Kingdom 73 Saint Kitts and Nevis 1.25 1.25 92 USA 73 Saint Kitts and Nevis 1.25 1.25
4 Austria 1 Algeria 1.25 1.75
8 Belgium 1 Algeria 1.25 1.75
12 Canada 1 Algeria 1.25 1.75
15 China 1 Algeria 1.25 1.75
17 Costa Rica 1 Algeria 1.25 1.75
6
Conclusion
There is a strong emphasis in the recent academic literature and policy debate on the importance of technological diffusion processes as global climate change mitigation strategies. However, the understanding of how technologies are diffused globally is rather limited. This is partly due to a lack of comprehensive datasets directly documenting the spread of specific technologies at the global scale and over long periods of time. Another major difficulty is that the diffusion network is generally unknown. Since taking a network perspective is crucial, to tackle this challenge, in this paper we propose a systemic approach to infer the network by maximizing the likelihood of the observed diffusion patterns. As an empirical application, we use a consolidated database on successive generations of wind turbines adopted worldwide since the early 1980s.
Our main contributions are to first provide a better understanding of how wind energy technologies have diffused globally, then to quantitatively analyze structural properties of the network at the global, regional, and country-level, and finally to use the inferred network to characterize strategies with the aim of maximizing the spread of new technologies. Among the main results, it is found that (i) the degree distribution of the network has fat tails (i.e. there are countries which are much more connected than expected if sizes were drawn from a normal distribution), (ii) centrality is uniformly distributed among top countries reflecting the multipolar nature of the network, and (iii) the path length and diameter is relatively large, indicating there might be significant lags between advanced and developing countries in technology adoption. Against this background and geopolitical context of climate policy, we assess via simulations if transfer strategies tailored towards the diffusion of technologies to subgroups of developing countries can be more efficient than those based on conventional centrality measures, and the potential of building links through new forms of cooperation.
There are several promising avenues for further research. First, one can build on recent advances in the econometric network formation literature to understand the determinants of link formation, that is, the structure of the network and how policies could influence its evolution. We have provided a forward step in this direction by using the inferred network to assess the efficiency potential of connecting countries that are otherwise relatively remote. Pursuing this line of research could be informative for the future design of international trade or environmental
technology transfers to climate change mitigation, the proposed approach can be extended to a comprehensive portfolio of technologies, including renewable energies such as solar power and biofuels and technological improvements to make for example steel production processes more environmentally friendly. In this sense, the diffusion processes can be compared, as they are most likely to differ across the technologies and thus imply different climate policy strategies. Finally, this approach could also be germane in a wider context to study other types of global transfer mechanisms.
References
Acemoglu, D. A. Ozdaglar, and E. Yildiz (2011), Diffusion of innovations in social networks, Proceedings of the 50th IEEE Conference on Decision and Control (CDC-ECC), 2329–2334. Aalen, O.O., O.Borgan, and H. K. Gjessing (2008), Survival and Event History Analysis: A
Process Point of View, Springer, New York.
Albert, R. and A.-L. Barabási (2002), Statistical mechanics of complex networks, Reviews of
Modern Physics, 74(1), 47-97.
Allan, C., A. B. Jaffe and I. Sin (2014), Diffusion of green technology: A survey, Motu Working Paper 14-04, Motu Economic and Public Policy Research Trust, New Zealand.
Barabási, A.-L. (2005), The origin of bursts and heavy tails in human dynamics, Nature, 435, 207-211.
Blackman, A. (1999), The economics of technology diffusion: Implications for climate policy in developing countries, Resources for the Future, Washington D.C.
Campiglio, E. (2016), Beyond carbon pricing: The role of banking and monetary policy in financing the transition to a low-carbon economy, Ecological Economics, 121, 220-230. Castellano, C., S. Fortunato, and V. Loreto (2009), Statistical physics of social dynamics,
Reviews of modern physics, 81(2), 591-646.
Centola, D., V.M. Eguiluz, and M.W. Macy (2007), Cascade dynamics of complex propagation,
Physica A, 374, 449-456.
Chandrasekhar, A.G. (2015), Econometrics of network formation, In: Bramoulle, Y., A. Galeotti, and B. Rogers (Eds.), Oxford Handbook on the Economics of Networks, forthcoming.
Comin, D., M. Dmitriev, and E. Rossi-Hansberg (2013), The spatial diffusion of technology, CEPR Discussion Paper 9208 and NBER Working Paper 18534.
Comin, D. and M. Mestieri (2014), Technology diffusion: Measurement, causes and consequences, In: Aghion, P. and S.N. Durlauf (Eds.), Handbook of Economic Growth, Vol. 2B, Elsevier, North-Holland, pp. 565-622.
Daneshmand, H., M. Gomez-Rodriguez, L. Song, and B. Schölkopf (2014), Estimating diffusion network structures: Recovery conditions, sample complexity and soft-thresholding algorithm, In: Proceedings of the 31st International Conference on Machine Learning (ICML’14). Dechezleprêtre, A., M. Glachant, M., I. Hascic, N. Johnstone, and Y. Ménière (2011), Invention
and transfer of climate change-mitigation technologies: A global analysis, Review of
Dechezleprêtre, A., M. Glachant, M., and Y. Ménière (2008), The Clean Development Mechanism and the international diffusion of technologies: An empirical study, Energy
Policy, 36(4), 1273-1283.
Dechezleprêtre, A., M. Glachant, M., and Y. Ménière (2009), Technology transfer by CDM projects: A comparison of Brazil, China, India and Mexico, Energy Policy, 37(2), 703-711. Dechezleprêtre A., M. Glachant, and Y. Ménière (2013), What drives the international transfer of
climate change mitigation technologies? Empirical evidence from patent data, Environmental
and Resources Economics, 54(2), 161-178.
Elhorst, J.P. (2014), Spatial Econometrics: From Cross-Sectional Data to Spatial Panels, Springer, Heidelberg, New York, Dordrecht, London.
Glachant, M., D. Dussaux, Y. Ménière, and A. Dechezleprêtre (2013), Greening global value chains: Innovation and the international diffusion of technologies and knowledge, Policy Research Working Paper 6467, The World Bank Sustainable Development Network.
Gomez-Rodriguez, M., J. Leskovec, D. Balduzzi, and B. Schölkopf (2014), Uncovering the structure and temporal dynamics of information propagation, Network Science, 2(1), 26-65. Gomez-Rodriguez, M., D. Balduzzi, and B. Schölkopf (2011), Uncovering the temporal
dynamics of diffusion networks, In: Proceedings of the 28th International Conference on
Machine Learning (ICML’11), pp. 561-568.
Gomez-Rodriguez, M., J. Leskovec, and A. Krause (2010), Inferring networks of diffusion and influence, In: Proceedings of the 16th ACM SIGKDD International Conference on
Knowledge Discovery in Data Mining, pp. 1019–1028.
Grant, M.C. and S.P. Boyd (2015), CVX: Matlab software for disciplined convex programming, cvxr.com/cvx.
GWEC (2015), Global wind report, Global Wind Energy Council.
Haug, D. M. (1992), International transfer of technology: Lessons that East Europe can learn from the failed Third World experience, Harvard Journal of Law and Technology, 5, 209-240. Hidalgo, C.A., and R. Hausmann (2009), The building blocks of economic complexity,
Proceedings of the National Academy of Sciences, 106(26), 10570-10575.
IEA (2015), Energy technology perspectives: Mobilising innovation to accelerate climate action, International Energy Agency, Paris.
IPCC (2014), Climate Change 2014: Synthesis report, Contribution of Working Groups I, II and III to the Fifth Assessment Report of the Intergovernmental Panel on Climate Change [Core Writing Team, R.K. Pachauri and L.A. Meyer (eds.)], IPCC, Geneva, Switzerland, 151 pp. Jackson, M.O. (2008), Social and economic networks, Princeton University Press, Princeton, NJ. Klaassen, G., A. Miketa, K. Larsen, and T. Sundqvist (2005), The impact of R&D on innovation
for wind energy in Denmark, Germany and the United Kingdom, Ecological Economics, 54, 227-240.
Kleinberg, J., S. Suri E. Tardos, and T. Wexler (2008), “Strategic network formationwith structural holes,” Proceedings of the 9th ACM Conference on Electronic Commerce.
LeSage, J.P. and R.K. Pace (2009), Introduction to Spatial Econometrics, Taylor and Francis, Boca Raton, FL.
Montanari, A. and A. Saberi (2010), The spread of innovations in social networks, Proceedings
of the National Academy of Sciences, 107(47), 20196–20201.
Nordhaus, W. (2015), Climate clubs: Overcoming free-riding in international climate policy,
Pastor-Satorras, R. and A. Vespignani (2001), Epidemic spreading in scale-free networks,
Physical Review Letters, 86(14), 3200.
Popp, D. (2005), Lessons from patents: Using patents to measure technological change in environmental models, Ecological Economics, 54, 209-226.
Popp, D., I. Hascic, N. Medhi (2011), Technology and the diffusion of renewable energy, Energy
Economics, 33(4), 648-662.
Rahman, S., A. Dinar, and D.F. Larson (2016), The incidence and extent of the CDM across developing countries, Environment and Development Economics, 1, 1-24.
Rogers, E.M. (1983), Diffusion of Innovations (3rd ed.), Free Press of Glencoe, NY.
Saito, K., M. Kimura, K. Ohara, and H. Motoda (2009), Learning continuous-time information diffusion model for social behavioral data analysis, Advances in Machine Learning, 322-337. UNFCCC (2015), Synthesis report on the aggregate effect of the intended nationally determined
contributions, Conference of the Parties, Paris.
Vu, D. Q., A.U. Asuncion, D.R. Hunter, and P. Smyth (2011), Continuous-time regression models for longitudinal networks, In: Shawe-Taylor, J., R. Zemel, P. Bartlett, F. Pereira, and K. Weinberger (Eds.), Advances in Neural Information Processing Systems, 2492–2500.
Table 4.1. UN regional grouping statistics, power-law model
Id Region No. of countries In-degree Out-degree Source region (%) Target region (%) Total degree 1 Africa 14 38 34 4.52 5.05 72 2 Asia-Pacific 18 122 112 14.89 16.22 234 3 Eastern Europe 17 88 141 18.75 11.70 229 4 GRULAC 20 101 92 12.23 13.43 193 5 WEOG 25 403 373 49.60 53.59 776
Table 5.1. Matrix of intra- and interregional connections for UN regional grouping, power-law model Africa Asia-Pacific Eastern Europe GRULAC WEOG
Africa 3 3 5 5 18
Asia-Pacific 3 18 17 16 58
Eastern Europe 6 26 23 19 67
GRULAC 12 16 4 20 40
WEOG 14 59 39 41 220
Figure 5. Evolution of network a) 1983-1993
Table 6. Centrality measures Id Country (1) Out-degree (2) In-degree (3) Total degree (4) Closeness (5) Eigenvector (6) Betweenness 1 Algeria 2 1 3 0.235 0.010 121 2 Argentina 5 5 10 0.343 0.169 44 3 Australia 12 10 22 0.404 0.350 445 4 Austria 12 8 20 0.408 0.253 93 5 Azerbaijan 0 2 2 0 0.040 0 6 Bangladesh 1 1 2 0.284 0.005 1 7 Belarus 3 1 4 0.298 0.061 21 8 Belgium 11 8 19 0.413 0.407 105 9 Bolivia 2 2 4 0.263 0.024 10 10 Brazil 10 14 24 0.404 0.377 532 11 Bulgaria 11 8 19 0.394 0.179 191 12 Canada 12 16 28 0.413 0.512 382 13 Cape Verde 1 1 2 0.296 0.065 0 14 Chile 3 10 13 0.317 0.148 119 15 China 10 17 27 0.388 0.611 323 16 Colombia 2 1 3 0.307 0.051 1 17 Costa Rica 10 8 18 0.388 0.205 339 18 Croatia 15 7 22 0.415 0.198 467 19 Cuba 2 3 5 0.333 0.198 14 20 Cyprus 9 2 11 0.384 0.013 45 21 Czech Republic 10 15 25 0.371 0.409 213 22 Denmark 17 7 24 0.408 0.374 114 23 Dominican Republic 0 2 2 0 0.046 0 24 Ecuador 9 2 11 0.383 0.007 105 25 Egypt 7 4 11 0.356 0.088 282 26 Eritrea 0 1 1 0 0.035 0 27 Estonia 8 12 20 0.386 0.327 224 28 Ethiopia 0 3 3 0 0.147 0 29 Faroe Islands 0 4 4 0 0.137 0 30 Fiji 3 1 4 0.298 0.100 322 31 Finland 9 18 27 0.386 0.646 217 32 France 12 31 43 0.417 1.000 1179 33 Gambia 0 1 1 0 0.018 0 34 Germany 22 16 38 0.437 0.664 491 35 Greece 4 14 18 0.346 0.401 246 36 Grenada 3 1 4 0.325 0.002 85 37 Guatemala 7 1 8 0.363 0.047 90 38 Honduras 2 1 3 0.284 0.010 90 39 Hungary 21 5 26 0.441 0.112 180 40 Iceland 1 2 3 0.218 0.035 10
Table 6. Centrality measures (continued) Id Country (1) Out-degree (2) In-degree (3) Total degree (4) Closeness (5) Eigenvector (6) Betweenness 42 Iran 0 1 1 0.000 0.064 0 43 Ireland 17 15 32 0.421 0.505 313 44 Israel 0 1 1 0 0.002 0 45 Italy 17 14 31 0.429 0.529 386 46 Jamaica 3 3 6 0.323 0.063 102 47 Japan 7 14 21 0.365 0.455 220 48 Jordan 6 2 8 0.350 0.038 94 49 Kazakhstan 0 1 1 0 0.042 0 50 Kenya 3 2 5 0.298 0.005 96 51 Latvia 11 3 14 0.401 0.126 142 52 Lithuania 3 3 6 0.312 0.147 86 53 Luxembourg 7 5 12 0.363 0.178 36 54 Macedonia 0 1 1 0 0.003 0 55 Mauritania 2 1 3 0.313 0.002 31 56 Mauritius 2 1 3 0.251 0.010 239 57 Mexico 7 7 14 0.394 0.246 170 58 Mongolia 5 1 6 0.358 0.039 5 59 Morocco 3 3 6 0.323 0.061 22 60 Netherlands 14 13 27 0.404 0.501 155 61 New-Zealand 7 9 16 0.371 0.311 139 62 Nicaragua 11 4 15 0.378 0.087 254 63 Nigeria 0 2 2 0 0.003 0 64 Norway 9 10 19 0.391 0.242 188 65 Pakistan 4 6 10 0.326 0.137 105 66 Peru 1 3 4 0.235 0.089 11 67 Philippines 2 3 5 0.305 0.067 96 68 Poland 6 15 21 0.365 0.408 287 69 Portugal 8 11 19 0.386 0.409 58 70 Puerto Rico 8 1 9 0.341 0.021 96 71 Romania 7 9 16 0.375 0.140 261 72 Russia 1 2 3 0.234 0.047 0
73 Saint Kitts and Nevis 3 1 4 0.325 0.002 85
74 Serbia 7 1 8 0.358 0.006 11 75 Seychelles 1 1 2 0.280 0.007 12 76 Slovakia 6 1 7 0.380 0.022 18 77 Slovenia 1 2 3 0.275 0.020 93 78 South Africa 2 13 15 0.331 0.498 92 79 South Korea 9 9 18 0.368 0.351 179 80 Spain 17 10 27 0.437 0.409 571 81 Sri Lanka 2 6 8 0.271 0.081 7 82 Sweden 2 21 23 0.303 0.659 141