HAL Id: inserm-02881451
https://www.hal.inserm.fr/inserm-02881451
Submitted on 25 Jun 2020
HAL is a multi-disciplinary open access
archive for the deposit and dissemination of
sci-entific research documents, whether they are
pub-lished or not. The documents may come from
teaching and research institutions in France or
abroad, or from public or private research centers.
L’archive ouverte pluridisciplinaire HAL, est
destinée au dépôt et à la diffusion de documents
scientifiques de niveau recherche, publiés ou non,
émanant des établissements d’enseignement et de
recherche français ou étrangers, des laboratoires
publics ou privés.
Dysregulation of peripheral expression of the YWHA
genes during conversion to psychosis
Fanny Demars, Oussama Kebir, Aude Marzo, Anton Iftimovici, Catherine
Schramm, Marie-Odile Krebs, Boris Chaumette
To cite this version:
Fanny Demars, Oussama Kebir, Aude Marzo, Anton Iftimovici, Catherine Schramm, et al..
Dysregu-lation of peripheral expression of the YWHA genes during conversion to psychosis. Scientific Reports,
Nature Publishing Group, 2020, 10 (1), pp.9863. �10.1038/s41598-020-66901-1�. �inserm-02881451�
Dysregulation of peripheral
expression of the YWHA genes
during conversion to psychosis
fanny Demars
1, oussama Kebir
1,2, Aude Marzo
1, Anton iftimovici
1,3, catherine Schramm
4,
icAAR Study Group*, Marie-odile Krebs
1,2✉ & Boris chaumette
1,2,5The seven human 14-3-3 proteins are encoded by the YWHA-gene family. They are expressed in the brain where they play multiple roles including the modulation of synaptic plasticity and neuronal development. Previous studies have provided arguments for their involvement in schizophrenia, but their role during disease onset is unknown. We explored the peripheral-blood expression level of the seven YWHA genes in 92 young individuals at ultra-high risk for psychosis (UHR). During the study, 36 participants converted to psychosis (converters) while 56 did not (non-converters). YWHA genes expression was evaluated at baseline and after a mean follow-up of 10.3 months using multiplex quantitative PCR. Compared with non-converters, the converters had a significantly higher baseline expression levels for 5 YWHA family genes, and significantly different longitudinal changes in the expression of YWHAE, YWHAG, YWHAH, YWHAS and YWAHZ. A principal-component analysis also indicated that the YWHA expression was significantly different between converters and non-converters suggesting a dysregulation of the YWHA co-expression network. Although these results were obtained from peripheral blood which indirectly reflects brain chemistry, they indicate that this gene family may play a role in psychosis onset, opening the way to the identification of prognostic biomarkers or new drug targets.
Schizophrenia is a frequent disabling psychotic disorder, resulting from complex interactions between genetic factors and pre/post-natal exposure to environmental insults. It is a progressive illness that typically emerges during late adolescence and is characterized by several stages: early vulnerability, at-risk mental state (also called ultra-high risk, UHR), first episode of psychosis (FEP), and chronic disease1. It has been estimated that one third
of UHR individuals convert to psychosis after three years of follow-up (converters), while a large majority remain with subthreshold symptoms, exhibiting a decrease in intensity or remission (non-converters)2. The biological
mechanisms underlying this differential prognosis are not yet understood. We have previously reported that some methylomic and transcriptomic changes accompany the emergence of psychosis during adolescence3,4.
However, additional longitudinal biological studies on UHR patients are crucially needed to identify biomarkers and to improve the current understanding of the pathophysiological mechanisms that accompany conversion from prodromes to major psychosis.
In recent decades, the importance of the YWHA gene family in neuropsychiatric disorders, including schizo-phrenia has been highlighted5,6. The YWHA genes (YWHAB/G/E/Z/H/Q/S) encode the 14-3-3 proteins (β, γ, ε, ζ,
η, θ and σ, respectively), a family of highly conserved, multifunctional isoforms highly expressed in the brain7,8.
YWHAS is also known as SFN, the gene coding for Stratifin. These proteins form homo- and heterodimers which bind other proteins among several hundreds of possible targets9–11. The YWHA gene family plays important
roles in neuronal and synaptic development, function and plasticity5,12–15. In particular, they participate in the
activation of the tyrosine and tryptophan hydroxylases, the rate limiting enzymes in the synthesis of some neuro-transmitters including serotonin and dopamine16. Consistent with this latter role, we recently reported a low level
of dopaminergic metabolites in the cerebrospinal fluid of a 20-year-old woman suffering from schizophrenia and carrying a de novo copy number variant (CNV; dup17p13.3) encompassing the YWHAE gene17. Moreover, genetic
1Université de Paris, Institut of Psychiatry and Neuroscience of Paris (IPNP), INSERM U1266, team Physiopathologie des Maladies Psychiatriques, GDR3557-Institut de Psychiatrie, Paris, France. 2GHU Paris Psychiatrie et Neurosciences, Paris, France. 3NeuroSpin, Commissariat à l’Energie Atomique, Gif-sur-Yvette, France. 4University of Montreal, Sainte Justine Hospital Research Center, Montreal, Canada. 5Department of Psychiatry, McGill University, Montreal, Canada. *A list of authors and their affiliations appears at the end of the paper. ✉e-mail: mo.krebs@ghu-paris.fr
www.nature.com/scientificreports
www.nature.com/scientificreports/
studies have reported multiple single nucleotide polymorphisms (SNPs) in YWHAE, YWHAH and YWHAZ in different cohorts of patients with schizophrenia18–23. Several transcriptomic and proteomic analyses have
iden-tified alterations in 14-3-3 protein isoforms in postmortem brain tissue of people with schizophrenia6,24–26. All
these studies support the implication of the YWHA genes in chronic stages of schizophrenia. To our knowledge, only one study focused on early stages of this disease by exploring the levels of mRNA of the YWHA gene family in FEP27. This study reported a significantly lower expression of YWHAB, YWHAE, YWHAG, YWHAQ and a
significantly higher expression of YHWAS. The authors proposed that the expression levels of the YWHA gene family could be used as indicators of schizophrenia severity.
This promising finding urged us to investigate whether the expression of the YWHA gene family is dysregu-lated in earlier stages of the disease, before the first-episode of psychosis, and during the emergence of psychotic symptoms. Therefore, we have used the longitudinal clinical and biological data of the French ICAAR cohort of psychiatric help-seeking young adults to explore the expression levels of the seven YWHA genes in UHR partic-ipants using multiplex quantitative-PCR (Q-PCR). We compared the baseline as well as the longitudinal changes of the expression levels between converters and non-converters.
Results
Demographic and clinical data of the study population.
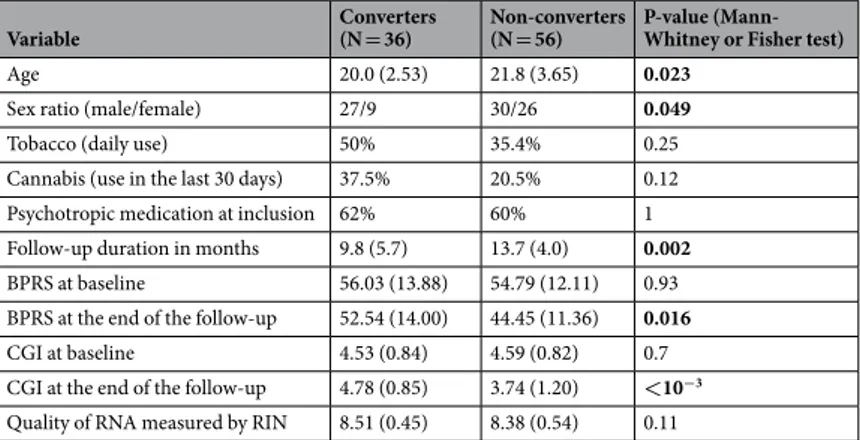
In total, 92 UHR participants were evalu-ated. Among them, 36 participants developed psychotic disorders during the follow-up (converters) and 56 did not (non-converters). The demographic and clinical characteristics (age, sex ratio, cannabis and tobacco use, psychotropic treatment intake, duration of the follow-up, severity of the symptoms, and RNA-sample quality) are reported in Table 1. At study start, there were no significant differences between converter and non-converter groups for daily use of tobacco, cannabis use within the last month, and psychotropic medication. There were no significant differences between groups in RNA quality from the samples obtained at the beginning and the end of the follow-up. The follow-up was longer for non-converters (p = 0.002), because converters were reassessed rapidly after conversion, whereas the follow-up was extended for non-converters to have greater confidence in concluding that outcome. As expected, the scores for clinical grading (BPRS, CGI) were not different at baseline but were higher in converters than non-convertors after the follow-up. Converters were younger and more fre-quently male than non-converters; consefre-quently, the statistical models were adjusted with respect to age and sex.Comparison of baseline expression of YWHA genes between converters and non-converters.
In the logistic-regression analysis, the baseline expression levels for YHWAB, YWHAE, YWHAG, YWHAQ andYWHAZ were significantly higher in converters than in non-converters (Table 2, Fig. 1a–g, Supplementary Fig. 1). By contrast, the baseline expression levels of YWHAH and YWHAS were not significantly different between con-verters and non-concon-verters. The baseline expression levels of YWHAB, YWHAE, YWHAQ and YWHAS were significantly correlated with several clinical scores at the end of the follow-up, especially with the score of negative symptoms (Supplementary Table 1).
comparison of longitudinal changes in expression of YWHA genes between converters and
non-converters.
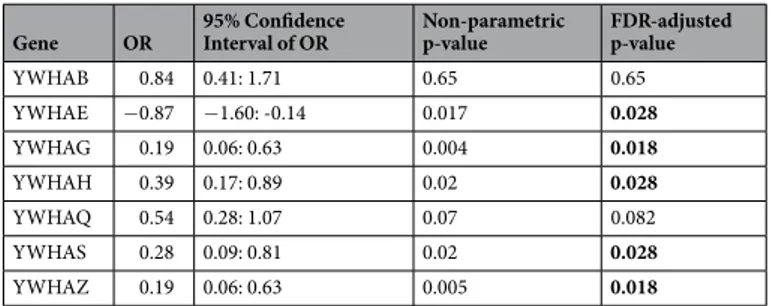
YWHA mRNA expression data at the end of the study were obtained for 67 patients (29 converters and 38 non-converters). We performed logistic-regression analyses of the longitudinal changes of YWHA expression levels between baseline and the end of the follow-up. Longitudinal changes of five of the seven YWHA genes (YWHAE,YWHAG, YWHAH, YWHAS and YWAHZ) were significantly different between non-converters and converters, with a decrease in their expression levels in converters (Table 3, Fig. 1h, Supplementary Fig. 2).Comparison of the co-expression of YWHA genes between converters and non-converters.
The members of the 14-3-3 family are known to form both homo- and heterodimers9. Therefore, we tested whetherthe mRNA expression levels of the different YWHA genes were correlated. We found that they mostly positively Variable Converters (N = 36) Non-converters (N = 56) P-value (Mann-Whitney or Fisher test)
Age 20.0 (2.53) 21.8 (3.65) 0.023
Sex ratio (male/female) 27/9 30/26 0.049
Tobacco (daily use) 50% 35.4% 0.25
Cannabis (use in the last 30 days) 37.5% 20.5% 0.12
Psychotropic medication at inclusion 62% 60% 1
Follow-up duration in months 9.8 (5.7) 13.7 (4.0) 0.002
BPRS at baseline 56.03 (13.88) 54.79 (12.11) 0.93
BPRS at the end of the follow-up 52.54 (14.00) 44.45 (11.36) 0.016
CGI at baseline 4.53 (0.84) 4.59 (0.82) 0.7
CGI at the end of the follow-up 4.78 (0.85) 3.74 (1.20) <10−3 Quality of RNA measured by RIN 8.51 (0.45) 8.38 (0.54) 0.11
Table 1. Demographic and clinical characteristics of the population. BPRS (Brief Psychiatric Rating Scale);
CGI (Clinical Global Impressions Scale). P-values <0.05 are in bold. Values represent population mean (and standard deviation).
correlated with each other (Supplementary Table 2, Supplementary Fig. 3), suggesting that the expression of these genes was coordinated. To explore whether the YWHA mRNA expression network is dysregulated in the con-verters, we performed a principal component analysis (PCA) on the expression levels of YWHA genes at baseline (Fig. 2). More than 63% of the total variance was explained by the first two principal components (35.8% and 27.9%, respectively). The mRNA expression of YWHAE, YWHAG, YWHAH, and YWHAZ contributed highly to the variation captured in the first dimension (respectively 17%, 26%, 18% and 24%), and mRNA expression of YWHAB, YHWAH, YWHAS and YWHAQ contributed highly to the variation captured in the second dimen-sion (respectively 27%, 20%, 25% and 18%). The values of the first principal component were significantly dif-ferent between converters and non-converters, based on a logistic regression model of the first three principal components, with age, sex and medication as covariates (OR = 0.56, 95% CI = [0.37; 0.84], p-value after 10 000 random permutations = 0.004, Supplementary Fig. 1). In addition, the values of the first principal component significantly correlated with the at-risk clinical scores measured at the end of the follow-up by the CAARMS (Supplementary Table 1).
Correlation between the methylation and expression levels of the YWHA genes.
We investi-gated whether methylation levels on CpGs located in the promoters or the body of the YWHA genes were asso-ciated with their expression levels. We found significant correlations for YWHAG and YWHAZ, suggesting that the expression of these genes is influenced by the degree of methylation of their related DNA sequences. The correlation was positive between the expression of YWHAG and the level of methylation of 5 CpGs located in its coding sequence while the correlation was negative for the expression of YWHAZ and the level of methylation in a CpG located in its promoter (Supplementary Table 3).Discussion
In the present study, we assessed the mRNA expression of YWHA genes in a cohort of 92 UHR participants, of which 36 developed psychotic disorders in a follow-up period of up to 1 year. Longitudinal expression data were available for 67 participants. In converters, baseline mRNA levels of YHWAB, YWHAE, YWHAG, YWHAQ and YWHAZ were significantly higher than those in non-converters. Moreover, the longitudinal changes in the expression of YWHAE, YWHAG, YWHAH, YWHAS and YWAHZ were significantly different between convert-ers and non-convertconvert-ers. The peripheral expressions of the YWHA genes were correlated and the values of the first principal component obtained for each subject by PCA were significantly different between converters and non-converters. In all participants, the values of the first principal component of the PCA and mRNA levels of
YWHAB, YWHAE and YWHAQ at baseline were positively correlated with certain clinical symptoms at the end
of the follow-up period. We observed significant correlations between the methylation and the expression levels of YWHAG and YWHAZ.
These results provide new insight on the implication of 14-3-3 proteins in schizophrenia. The comparison with other studies is difficult because, unlike the present study where peripheral blood was sampled, most of those studies have focused on expression in the post-mortem brain. However, in line with our results, higher levels of expression of YWHAB, YWHAE, YWHAG and YWHAZ have been described in the brains of schiz-ophrenia patients compared with controls28–31. Yet, lower mRNA and protein expression of those genes in
post-mortem brains of schizophrenia patients compared with controls has also been reported24. In the only study
on early phases of psychosis, the mRNA expression level in peripheral-blood of YWHAS was higher in patients with first-episode psychosis (FEP) than in controls, whereas the levels of YWHAB, YWHAE, YWHAG, YWHAQ were lower27. They also reported reduced levels of the 14-3-3 proteins encoded by YWHAB, YWHAE, YWHAG,
YWHAQ and YWHAZ in the blood of FEP patients. This apparent discrepancy with our study may come from the
stages of the disease because the UHR stage precedes the FEP stage. The longitudinal decrease we observed during the conversion to psychosis brought the expression levels in converters closer to the levels described previously in FEP patients.
Our results suggest that a dysregulation of the expression of the YWHA gene family could be involved in the early pathological processes that lead to psychosis. Although the possible mechanisms involving 14-3-3 proteins in psychiatric disorders pathophysiology remain unknown, early overexpression of YWHAE and YWHAG has been shown to impair neurodevelopment, such as neuronal migration and neurite formation in animal mod-els32,33. The higher expression levels observed at baseline in converters might therefore be a marker of impaired
Gene OR 95% Confidence Interval of OR Non-parametric p-value FDR-adjusted p-value
YWHAB 2.21 1.27: 3.86 0.003 0.007 YWHAE 2.24 1.32: 3.79 0.002 0.007 YWHAG 2.54 1.53: 4.21 0.0002 0.0014 YWHAH 1.55 0.98: 2.46 0.06 0.07 YWHAQ 1.84 1.13: 3.01 0.01 0.014 YWHAS 1.23 0.77: 1.96 0.41 0.41 YWHAZ 1.99 1.16: 3.41 0.009 0.014
Table 2. Comparison of baseline expression of YWHA genes between converters and non-converters using
logistic regressions. OR represents the odd ratio. P-values <0.05 after 10 000 random permutations and FDR correction are in bold.
www.nature.com/scientificreports
www.nature.com/scientificreports/
neurodevelopment. Several modifications in the cellular environment, such as inflammation or oxidative stress, affect the expression and the functions of the 14-3-3 proteins34–38. Interestingly, in the same cohort, we have
shown that changes in DNA methylation occurs during the conversion to psychosis in genes involved in oxida-tive stress regulation and inflammatory pathways4. Therefore, the longitudinal decrease of the expression of five
Figure 1. mRNA expression levels of the YWHA genes in converters and non-converters. (a–g) Baseline
mRNA expression levels for YWHAB (a), YWHAE (b), YWHAG (c), YWHAH (d), YWHAQ (e), YWHAS (f), YWHAZ (g) in converters (C) and non-converters (NC). Each box plot represents the mean (central horizontal line) and the standard deviation. (h) Longitudinal changes between baseline (M0) and the end of the follow-up (MF) of mRNA expression of the five YWHA genes that are significantly different between converters (full lines) and non-converters (dashed lines). The error bars indicate the standard error to the mean.
YWHA genes in converters could be related to the increased inflammatory and oxidative stress reported during the early phases of psychosis39–42.
The onset of psychosis is underpinned by complex molecular interactions between genetic vulnerabilities and environmental exposure leading to dynamic changes in gene expression. Our PCA analysis revealed a dysregula-tion of the co-expression network in converters compared with non-converters. This suggests a shared reguladysregula-tion possibly though some epigenetic mechanisms. For instance, we observed significant correlations between the methylation and the expression levels of YWHAG and YWHAZ in this cohort. Other epigenetic mechanisms like microRNA expression might also have play a role43–48.
Although there is evidence supporting the involvement on 14-3-3 in the pathophysiology of schizophrenia, some confounding factors have been proposed to explain changes in gene expression. Psychotropic medication appears to disrupt the expression of YWHA transcripts and 14-3-3 proteins in schizophrenia31,49. However, in the
present study, there was no significant difference in treatment intake between converters and non-converters and antipsychotic doses were included in the regression analyses. Another concern is the tissue specificity of gene expression. Here, we measured gene expression in peripheral blood and not in the brain. However, the blood-brain correlation in gene expression has been reported to range from 0.25 to 0.64 and to be greater for genes highly expressed in both tissues50, as is the case for the YWHA family. The advantage of using blood
sam-ples is that it allows for longitudinal studies that can better inform us on the mechanisms of disease progression than transversal studies. Then, some individuals might have converted after the end of the follow-up; however, this does not interfere with the result about the longitudinal changes in YWHA genes expression because they have been sampled before this potential conversion.
Our study supports the implication of 14-3-3 proteins in the pathophysiology of schizophrenia onset. The measurement of 14-3-3 proteins in the cerebrospinal fluid has already been developed in neurology as a potential biomarker for neurodegenerative disorders, including Alzheimer’s disease, Parkinson’s disease, Creutzfeldt-Jakob disease, or amyotrophic lateral sclerosis6,51,52. Moreover, the 14-3-3 signaling pathway has emerged as a potential
therapeutic target in neurology and could also represent a new opportunity in psychiatry53,54. Additional studies
Gene OR 95% Confidence Interval of OR Non-parametric p-value FDR-adjusted p-value
YWHAB 0.84 0.41: 1.71 0.65 0.65 YWHAE −0.87 −1.60: -0.14 0.017 0.028 YWHAG 0.19 0.06: 0.63 0.004 0.018 YWHAH 0.39 0.17: 0.89 0.02 0.028 YWHAQ 0.54 0.28: 1.07 0.07 0.082 YWHAS 0.28 0.09: 0.81 0.02 0.028 YWHAZ 0.19 0.06: 0.63 0.005 0.018
Table 3. Comparison of longitudinal changes in expression of YWHA genes between converters and
non-converters using logistic regressions. OR represents the odd ratio. P-values < 0.05 after 10 000 random permutations and FDR correction are in bold.
Figure 2. Principal Component Analysis of the expression levels of the YWHA genes at baseline. The
Variables-PCA graph (left) displays the variable correlation plots of the principal component analysis with the respective contribution of each genes’ expression level indicated with a color gradient (contrib). The scree plot (center) indicates the percentage of the variance explained by each dimension. Dimensions 1 and 2 explain 35.8% and 27.9% of the variance respectively. The Individuals-PCA graph (right) displays the first two components values obtained for each participant. Values for converters (C) and non-converters (NC) are represented by blue triangles and red circles, respectively. The mean value for each group is represented by a larger symbol.
www.nature.com/scientificreports
www.nature.com/scientificreports/
on larger cohorts of patients are needed to replicate and to further investigate the implication of this pathway in the pathophysiology of psychotic disorders.
Methods
Population.
Participants were recruited in the French ICAAR cohort (PHRC AOM-07-118, promoted by Hôpital Sainte-Anne). The use of the cohort was approved by the institutional ethics committee “Comité de protection des personnes, Ile-de-France III, Paris, France” and written informed consent was obtained from all participants or their legal representatives if under age of 18, in accordance with the Declaration of Helsinki. The ICAAR cohort55 included 16- to-30-year-old help-seeking individuals, who had been consequently referred tothe Adolescent and Young Adult Assessment Centre (Service Hospitalo-Universitaire, Hôpital Sainte-Anne, Paris, France) between 2009 and 2014. Inclusion criteria were alterations in global functioning (Social and Occupational Functioning Assessment Scale score <70) during the past year that were associated with psychiatric symptoms and/or subjective cognitive complaints. All help-seeking individuals were examined with the Comprehensive Assessment of At-risk Mental State protocol (CAARMS56), in its French translated version57 by specifically trained
psychiatrists followed by a consensus meeting for best estimate diagnoses. Individuals meeting the CAARMS cri-teria for UHR status were included in the study. Exclusion cricri-teria included conspicuous symptoms of psychosis, pervasive developmental disorder, bipolar disorder, or other established diagnoses, such as obsessive-compulsive disorder, severe or non-stabilized somatic and neurological disorders, head injury and an IQ score below 70. Participants were followed for one year at most and follow-up stopped either after a year or after conversion to psychosis. Participants underwent clinical assessment and blood sampling at two time points: at baseline (M0) and at the end of follow-up (MF). This design enabled intra-subject analyses, i.e., to detect changes occurring in gene expression between MF and M0, covering conversion to psychosis. The conversion to psychosis was deter-mined using the CAARMS threshold (i.e., supra-threshold psychotic symptoms — thought content, perceptual abnormalities and/or disorganized speech — present for more than one week). UHR participants who reached the threshold during follow-up were considered converters while UHR participants who recovered or displayed persistent sub-threshold symptoms were considered non-converters. Each subject was assessed using several clinical scales: SOFAS, BPRS, PANSS (including the three subscales for positive symptoms, negative symptoms and disorganization), MADRS and YMRS. The CAARMS score was operationalized as the summed scores of the product of global rating scale score (0-6) and frequency (0–6) of the four first subscales as reported previously58.
Levels of the current antipsychotic treatments were transformed into chlorpromazine equivalent doses that were used as a covariate in the regression analysis. References for the computation of chlorpromazine equivalent doses are available in the Supplementary Table 4.
Q-PCR quantification.
Total RNA was extracted from blood samples (PAXgene tubes) using a standard protocol with a QIAcube robot and PAXgene Blood RNA kit (QIAGEN). Quality control was done using LabChip GX (Perkin Elmer, Waltham USA). Complementary DNA (cDNA) synthesis was performed using Reverse Transcription Master Mix from Fluidigm according to the manufacturer’s protocol, with random primers in a final volume of 5 μL containing 100 ng total RNA, and incubation in a Nexus thermocycler (Eppendorf). cDNA samples were diluted by adding 20 μL of low TE buffer [10 mM Tris; 0.1 mM EDTA; pH = 8.0 (TEKNOVA)]. TaqMan probes were selected for each gene. For specific target pre-amplification, 1.25 μL of each diluted cDNA was used for multiplex pre-amplification with Fluidigm PreAmp Master Mix at 12 cycles. In a total volume of 5 μL, the reaction contained 1 μL of pre-amplification master mix, 1 μL of PCR water, 1.25 μL of cDNA, 1.25 μL of pooled TaqMan Gene Expression Assays buffer (Life Technologies, ThermoFisher). The cDNA samples were subjected to pre-amplification following the temperature protocol - 2 min at 95 °C, followed by 12 cycles of 15 s at 95 °C and 4 min at 60 °C. The pre-amplified cDNA was diluted 5X by adding 20 μL of TEKNOVA. High-throughput real-time PCR was performed using the high-throughput BioMark HD System platform and the GE Dynamic Arrays (Fluidigm). Six microliters of sample master mix (SMM) consisted of 1.8 μL of 5X diluted pre-amplified cDNA, 0.3 μL of 20X GE Sample Loading Reagent (Fluidigm) and 3 μL of TaqMan Gene Expression PCR Master Mix (Life Technologies, ThermoFisher). Each 6 μL assay master mix (AMM) consisted of 3 μL of TaqMan Gene Expression assay 20×(Life Technologies) and 3 μL of 2X Assay Loading Reagent (Fluidigm). Five microliters of SMM and of AMM premixes were added to the dedicated wells. The samples and assays were mixed inside the chip using HX IFC controller (Fluidigm). Thermal conditions for qPCR were as follows: 30 min at 25 °C and 60 min at 70 °C for thermal mix; 2 min at 50 °C and 10 min at 95 °C for hot start; 40 cycles of 15 s at 95 °C and 1 min at 60 °C. Data were processed with an automatic threshold for each assay, with linear-derivative baseline correction using BioMark Real-Time PCR Analysis Software 4.0.1 (Fluidigm). The quality threshold was unchanged at the 0.65 default setting. Normalization was conducted using the mRNA expression of the GAPDH gene. Livak normalization provided the expression level in each sample with a transformation using the 2ΔΔCT method59. 92 individuals had good quality expression data at baseline and 67 individuals had good qualityexpres-sion data before and after the follow-up.
Methylation data.
Methylation levels on CpGs located in the seven YWHA genes were extracted from the methylomic data previously obtained for a subset of this cohort4. Briefly, for each individual, genomic DNA(500 ng) was extracted from whole blood and treated with sodium bisulfite using the EZ-96DNA Methylation KIT (Catalog No D5004, Zymo Research, Irvine, CA, USA) following the manufacturer’s standard protocol. Genome-wide DNA methylation was assessed using Illumina Infinium HumanMethylation450 BeadChip (Illumina, San Diego, CA, USA), which interrogates the DNA methylation profile of >485 000 CpG loci across the genome at single-nucleotide resolution. Illumina GenomeStudio software (Illumina) was used to extract sig-nal intensities for each probe. For details about preprocessing and clean up steps, please refer to Kebir et al.4.
Methylation and expression data were available for 25 patients (12 converters and 13 non converters) at both baseline and at the end of follow-up. A total of 122 CpGs were located in the promoter or the body of one of the seven YWHA genes. Methylation levels on these CpG were correlated with their corresponding gene expressions using Pearson’s test.
Statistical analysis.
Statistical analyses were performed using Python and R 3.5.1 software. Gene expres-sion levels at baseline and longitudinal changes were standardized on the respective data of the non-converters using z-score. Logistic regressions (family: binomial), adjusted for participant age, sex, antipsychotic medication (chlorpromazine equivalent doses) were used to test the difference in standardized expression levels of YWHA genes at baseline (M0) and longitudinally between the two groups (converters and non-converters). A robust non-parametric significance (p) was computed through simulation-based random permutation analysis, whereby we randomly permuted the assignment of values to the groups, and repeated the statistical test 10,000 times. We then computed how many times a p-value was smaller or equal to the observed one. The reported P-value was calculated as the ratio of this number to the total number of tests done (10,000). In order to account for multiple comparison, p-value were adjusted using a false discovery rate (FDR) correction. Graphical representations were produced using Python and the ggplot2 R package60. Statistics and visualization of the correlation matrices weredone with the R software, using the Hmisc and Corrplot packages61–64. Correlations between mRNA expression
levels used Pearson’s correlation analysis. Correlations between mRNA expression levels and clinical scores used Spearman’s correlation analysis. PCA on the YWHA mRNA expression data was performed using the R package FactoMineR package65. The PCA determines the principal components of the correlated expression of the YWHA
genes. Then, we compare the value of these principal components between the two clinical groups using a logistic regression model with age, sex and medication (chlorpromazine equivalent doses). In all cases, the differences were considered statistically significant when the corrected two-side p-values were lower than 0.05.
Data availability
The biological dataset is available from the corresponding author on reasonable request. Scripts for qPCR normalization are available on GitHub (https://github.com/jpouch/qPCR-Biomark). Statistical scripts are available from the corresponding author on reasonable request.
Received: 13 December 2019; Accepted: 4 May 2020; Published: xx xx xxxx
References
1. McGorry, P. D. Early clinical phenotypes, clinical staging, and strategic biomarker research: building blocks for personalized psychiatry. Biol. Psychiatry 74, 394–395 (2013).
2. Fusar-Poli, P. et al. The psychosis high-risk state: a comprehensive state-of-the-art review. JAMA Psychiatry 70, 107–120 (2013). 3. Chaumette, B. et al. Longitudinal Analyses of Blood Transcriptome During Conversion to Psychosis. Schizophr. Bull. 1, 45(1), 247–255
(2019).
4. Kebir, O. et al. Methylomic changes during conversion to psychosis. Mol. Psychiatry 22, 512–518 (2017). 5. Berg, D., Holzmann, C. & Riess, O. 14-3-3 proteins in the nervous system. Nat. Rev. Neurosci. 4, 752–762 (2003). 6. Foote, M. & Zhou, Y. 14-3-3 proteins in neurological disorders. Int. J. Biochem. Mol. Biol. 3, 152–164 (2012). 7. Aitken, A. 14-3-3 proteins: a historic overview. Semin. Cancer Biol. 16, 162–172 (2006).
8. Moore, B. W. Specific acidic proteins of the nervous system. Physiol. Biochem. Asp. Nerv. Integr. 343–359 (1967).
9. Jones, D. H., Ley, S. & Aitken, A. Isoforms of 14-3-3 protein can form homo- and heterodimers in vivo and in vitro: implications for function as adapter proteins. FEBS Lett. 368, 55–58 (1995).
10. Muslin, A. J., Tanner, J. W., Allen, P. M. & Shaw, A. S. Interaction of 14-3-3 with signaling proteins is mediated by the recognition of phosphoserine. Cell 84, 889–897 (1996).
11. Yaffe, M. B. et al. The structural basis for 14-3-3:phosphopeptide binding specificity. Cell 91, 961–971 (1997).
12. Cornell, B. & Toyo-oka, K. 14-3-3 Proteins in Brain Development: Neurogenesis, Neuronal Migration and Neuromorphogenesis.
Front. Mol. Neurosci. 10 (2017).
13. Li, Y., Wu, Y. & Zhou, Y. Modulation of inactivation properties of CaV2. 2 channels by 14-3-3 proteins. Neuron 51, 755–771 (2006). 14. Simsek-Duran, F., Linden, D. J. & Lonart, G. Adapter protein 14-3-3 is required for a presynaptic form of LTP in the cerebellum. Nat.
Neurosci. 7, 1296–1298 (2004).
15. Toyo-oka, K. et al. 14-3-3epsilon is important for neuronal migration by binding to NUDEL: a molecular explanation for Miller-Dieker syndrome. Nat. Genet. 34, 274–285 (2003).
16. Ichimura, T., Isobe, T., Okuyama, T., Yamauchi, T. & Fujisawa, H. Brain 14-3-3 protein is an activator protein that activates tryptophan 5-monooxygenase and tyrosine 3-monooxygenase in the presence of Ca2+,calmodulin-dependent protein kinase II.
FEBS Lett. 219, 79–82 (1987).
17. Alexandre, C. et al. Paradoxical Improvement of Schizophrenic Symptoms by a Dopaminergic Agonist: An Example of Personalized Psychiatry in a Copy Number Variation–Carrying Patient. Biol. Psychiatry 80, e21–e23 (2016).
18. Ikeda, M. et al. Identification of YWHAE, a gene encoding 14-3-3epsilon, as a possible susceptibility gene for schizophrenia. Hum.
Mol. Genet. 17, 3212–3222 (2008).
19. Jia, Y. et al. An association study between polymorphisms in three genes of 14-3-3 (tyrosine 3-monooxygenase/tryptophan 5-monooxygenase activation protein) family and paranoid schizophrenia in northern Chinese population. Eur. Psychiatry J. Assoc.
Eur. Psychiatr. 19, 377–379 (2004).
20. Pulver, A. E. et al. Sequential strategy to identify a susceptibility gene for schizophrenia: report of potential linkage on chromosome 22q12-q13.1: Part 1. Am. J. Med. Genet. 54, 36–43 (1994).
21. Toyooka, K. et al. 14-3-3 protein eta chain gene (YWHAH) polymorphism and its genetic association with schizophrenia. Am. J.
Med. Genet. 88, 164–167 (1999).
22. Wong, A. H. C. et al. Identification of candidate genes for psychosis in rat models, and possible association between schizophrenia and the 14-3-3eta gene. Mol. Psychiatry 8, 156–166 (2003).
23. Wong, A. H. C. et al. Genetic and post-mortem mRNA analysis of the 14-3-3 genes that encode phosphoserine/threonine-binding regulatory proteins in schizophrenia and bipolar disorder. Schizophr. Res. 78, 137–146 (2005).
www.nature.com/scientificreports
www.nature.com/scientificreports/
24. Cai, L. et al. Implications of Newly Identified Brain eQTL Genes and Their Interactors in Schizophrenia. Mol. Ther. Nucleic Acids 12, 433–442 (2018).
25. English, J. A., Pennington, K., Dunn, M. J. & Cotter, D. R. The neuroproteomics of schizophrenia. Biol. Psychiatry 69, 163–172 (2011).
26. Saia-Cereda, V. M., Cassoli, J. S., Martins-de-Souza, D. & Nascimento, J. M. Psychiatric disorders biochemical pathways unraveled by human brain proteomics. Eur. Arch. Psychiatry Clin. Neurosci. 267, 3–17 (2017).
27. Qing, Y. et al. Dysregulated 14-3-3 Family in Peripheral Blood Leukocytes of Patients with Schizophrenia. Sci. Rep. 6, 23791 (2016). 28. English, J. A., Dicker, P., Föcking, M., Dunn, M. J. & Cotter, D. R. 2-D DIGE analysis implicates cytoskeletal abnormalities in
psychiatric disease. Proteomics 9, 3368–3382 (2009).
29. Nesvaderani, M., Matsumoto, I. & Sivagnanasundaram, S. Anterior hippocampus in schizophrenia pathogenesis: molecular evidence from a proteome study. Aust. N. Z. J. Psychiatry 43, 310–322 (2009).
30. Pennington, K., Dicker, P., Dunn, M. J. & Cotter, D. R. Proteomic analysis reveals protein changes within layer 2 of the insular cortex in schizophrenia. Proteomics 8, 5097–5107 (2008).
31. Rivero, G. et al. Up-regulated 14-3-3β and 14-3-3ζ proteins in prefrontal cortex of subjects with schizophrenia: effect of psychotropic treatment. Schizophr. Res. 161, 446–451 (2015).
32. Cornell, B., Wachi, T., Zhukarev, V. & Toyo-Oka, K. Overexpression of the 14-3-3gamma protein in embryonic mice results in neuronal migration delay in the developing cerebral cortex. Neurosci. Lett. 628, 40–46 (2016).
33. Cornell, B., Wachi, T., Zhukarev, V. & Toyo-Oka, K. Regulation of neuronal morphogenesis by 14-3-3epsilon (Ywhae) via the microtubule binding protein, doublecortin. Hum. Mol. Genet. 25, 4405–4418 (2016).
34. Kim, H. S., Ullevig, S. L., Nguyen, H. N., Vanegas, D. & Asmis, R. Redox regulation of 14-3-3ζ controls monocyte migration.
Arterioscler. Thromb. Vasc. Biol. 34, 1514–1521 (2014).
35. Kim, Y. S. et al. Protein kinase Cdelta is associated with 14-3-3 phosphorylation in seizure-induced neuronal death. Epilepsy Res. 92, 30–40 (2010).
36. Lee, D.-H. et al. Role of glial 14-3-3 gamma protein in autoimmune demyelination. J. Neuroinflammation 12, 187 (2015). 37. Pennington, K. L., Chan, T. Y., Torres, M. P. & Andersen, J. L. The dynamic and stress-adaptive signaling hub of 14-3-3: emerging
mechanisms of regulation and context-dependent protein–protein interactions. Oncogene 37, 5587–5604 (2018).
38. Wang, Y. et al. Epigenetic changes of TIMP-3, GSTP-1 and 14-3-3 sigma genes as indication of status of chronic inflammation and cancer. Int. J. Biol. Markers 29, e208–214 (2014).
39. Chan, M. K. et al. Development of a blood-based molecular biomarker test for identification of schizophrenia before disease onset.
Transl. Psychiatry 5, e601 (2015).
40. Fournier, M. et al. Impaired metabolic reactivity to oxidative stress in early psychosis patients. Schizophr. Bull. 40, 973–983 (2014). 41. Fraguas, D. et al. Oxidative stress and inflammation in first-episode psychosis: A systematic review and meta-analysis. Schizophr.
Bull. 45, 742–751 (2018).
42. Khoury, R. & Nasrallah, H. A. Inflammatory biomarkers in individuals at clinical high risk for psychosis (CHR-P): State or trait?
Schizophr. Res. 199, 31–38 (2018).
43. Ferguson, A. T. et al. High frequency of hypermethylation at the 14-3-3 σ locus leads to gene silencing in breast cancer. Proc. Natl.
Acad. Sci. 97, 6049–6054 (2000).
44. Jasinski-Bergner, S. et al. Identification of 14-3-3β Gene as a Novel miR-152 Target Using a Proteome-based Approach. J. Biol. Chem.
289, 31121–31135 (2014).
45. Leivonen, S.-K. et al. Identification of miR-193b targets in breast cancer cells and systems biological analysis of their functional impact. Mol. Cell. Proteomics MCP 10, M110.005322 (2011).
46. Lin, M. et al. Copy number gain and oncogenic activity of YWHAZ/14-3-3ζ in head and neck squamous cell carcinoma. Int. J.
Cancer J. Int. Cancer 125, 603–611 (2009).
47. Mhawech, P. et al. Downregulation of 14-3-3σ in ovary, prostate and endometrial carcinomas is associated with CpG island methylation. Mod. Pathol. 18, 340–348 (2005).
48. Yu, D. et al. miR-451 protects against erythroid oxidant stress by repressing 14-3-3zeta. Genes Dev. 24, 1620–1633 (2010). 49. Middleton, F. A., Peng, L., Lewis, D. A., Levitt, P. & Mirnics, K. Altered expression of 14-3-3 genes in the prefrontal cortex of subjects
with schizophrenia. Neuropsychopharmacol. Off. Publ. Am. Coll. Neuropsychopharmacol. 30, 974–983 (2005).
50. Tylee, D. S., Kawaguchi, D. M. & Glatt, S. J. On the outside, looking in: a review and evaluation of the comparability of blood and brain ‘-omes’. Am. J. Med. Genet. Part B Neuropsychiatr. Genet. Off. Publ. Int. Soc. Psychiatr. Genet. 162B, 595–603 (2013). 51. Shimada, T., Fournier, A. E. & Yamagata, K. Neuroprotective function of 14-3-3 proteins in neurodegeneration. BioMed Res. Int.
2013, 564534 (2013).
52. Malaspina, A., Kaushik, N. & de Belleroche, J. A 14-3-3 mRNA is up-regulated in amyotrophic lateral sclerosis spinal cord. J.
Neurochem. 75, 2511–2520 (2000).
53. Kaplan, A., Ottmann, C. & Fournier, A. E. 14-3-3 adaptor protein-protein interactions as therapeutic targets for CNS diseases.
Pharmacol. Res. 125, 114–121 (2017).
54. Zhao, J., Meyerkord, C. L., Du, Y., Khuri, F. R. & Fu, H. 14-3-3 proteins as potential therapeutic targets. Semin. Cell Dev. Biol. 22, 705–712 (2011).
55. Oppetit, A. et al. The C’JAAD: a French team for early intervention in psychosis in Paris. Early Interv. Psychiatry, https://doi. org/10.1111/eip.12376 (2016).
56. Yung, A. R. et al. Mapping the onset of psychosis: the Comprehensive Assessment of At-Risk Mental States. Aust. N. Z. J. Psychiatry
39, 964–971 (2005).
57. Krebs, M.-O. et al. [Assessment of mental states at risk of psychotic transition: validation of the French version of the CAARMS].
L’Encéphale 40, 447–456 (2014).
58. Morrison, A. P. et al. Early detection and intervention evaluation for people at risk of psychosis: multisite randomised controlled trial. BMJ 344, e2233 (2012).
59. Schmittgen, T. D. & Livak, K. J. Analyzing real-time PCR data by the comparative C(T) method. Nat. Protoc. 3, 1101–1108 (2008). 60. Wickham, H. ggplot2: elegant graphics for data analysis. (Springer, 2016).
61. Harrell, F. E. Jr. & Harrell, M. F. E. Jr. Package ‘Hmisc’. R Found. Stat. Comput. (2018). 62. Wei, T. et al. Package ‘corrplot’. Statistician 56, 316–324 (2017).
63. Wie, T. & Simko, V. R package “corrplot”: Visualization of a Correlation Matrix (Version 0.84). Available from https://github.com/ taiyun/corrplot (2017)
64. Harrell, F. E. Jr. et al. Hmisc: Harrell Miscellaneous. R package version 4.4-0. https://CRAN.R-project.org/package=Hmisc (2020). 65. Lê, S., Josse, J. & Husson, F. FactoMineR: an R package for multivariate analysis. J. Stat. Softw. 25, 1–18 (2008).
Acknowledgements
We would like to thank all the patients and parents who participated in the ICAAR study, as well as all the staff from the C’JAAD team (Centre d’Evaluation pour Jeunes Adultes et Adolescents) and the staff from the Clinical Evaluation and Research Center at the Service Hospitalo-Universitaire, Centre Hospitalier Sainte-Anne (GHU Paris Psychiatrie et Neurosciences). We also thank the URC Paris Centre Descartes (AP-HP), INSERM, and DRCI
for regulatory and technical assistance. We are grateful to Bertrand Ducos and Juliette Pouch from the qPCR-HD-Genomic Paris Centre platform for the qPCR. We thank Matthew J. Morgan (MG Science Communications) for the English editing. This work was supported by a grant by the French Government’s Agence Nationale pour la Recherche (ANR, 08-MNP-007), by a grant from the French Ministry of Health’s Programme Hospitalier de Recherche Clinique (PHRC, AOM-07-118), and by the grant ANR-13-SAMA-0010 (SAMENTA 2013 - Projet CERBAIS). This work is supported by the French Government, managed by the Agence Nationale de la Recherche (ANR) under the programme "Investissements d'Avenir" with the reference ANR-18-RHUS-0014. The Centre Hospitalier Sainte-Anne sponsored the ICAAR study. Additional financial support was obtained from the Institut National de la Santé et de la Recherche Médicale (INSERM), and Université Paris Descartes (recurrent funding). Boris Chaumette receives a grant from the Fondation Bettencourt-Schueller. Fanny Demars and Anton Iftimovici receive a funding from the Fondation pour la Recherche Médicale (FRM). The sponsors had no role in the design and conduct of the study, in the collection, management, analysis or interpretation of the data, in the preparation, review or approval of the manuscript, or in the decision to submit the manuscript for publication.
Author contributions
O.K., M.O.K. and B.C. designed the study. O.K., M.O.K. and B.C. obtained the funding and supervised the study. F.D., A.I., the ICAAR study group and B.C. collected the data. F.D., A.M., C.S., A.I. and B.C. analyzed the data. F.D., O.K., A.M., A.I., C.S. and B.C. interpreted the data. F.D., A.M. and B.C. drafted the manuscript. All authors contributed to and have approved the final manuscript.
competing interests
The authors declare no competing interests.
Additional information
Supplementary information is available for this paper at https://doi.org/10.1038/s41598-020-66901-1.
Correspondence and requests for materials should be addressed to M.-O.K. Reprints and permissions information is available at www.nature.com/reprints.
Publisher’s note Springer Nature remains neutral with regard to jurisdictional claims in published maps and
institutional affiliations.
Open Access This article is licensed under a Creative Commons Attribution 4.0 International
License, which permits use, sharing, adaptation, distribution and reproduction in any medium or format, as long as you give appropriate credit to the original author(s) and the source, provide a link to the Cre-ative Commons license, and indicate if changes were made. The images or other third party material in this article are included in the article’s Creative Commons license, unless indicated otherwise in a credit line to the material. If material is not included in the article’s Creative Commons license and your intended use is not per-mitted by statutory regulation or exceeds the perper-mitted use, you will need to obtain permission directly from the copyright holder. To view a copy of this license, visit http://creativecommons.org/licenses/by/4.0/.
© The Author(s) 2020