FACTORS IMPACTING UNIVERSITY INSTRUCTORS’
AND STUDENTS’ PERCEPTIONS OF COURSE
EFFECTIVENESS AND TECHNOLOGY INTEGRATION
IN THE AGE OF WEB 2.0
VIVEK VENKATESH & JIHAN RABAH Concordia University
MAGDA FUSARO & ANNIE COUTURE Université du Québec à Montréal WYNNPAUL VARELA & KRISTOPHER ALEXANDER Concordia University
ABSTRACT. We are witnessing the integration of increasingly sophisticated infor-mation and communication technologies (ICTs) in higher education settings. Understanding learners’ and instructors’ perceptions of their proficiency and use of ICTs is critical to the success of their integration in universities. Using a theoretical framework grounded in technology integration and educational psychology, survey data were collected from students and instructors spanning 12 Quebec universities. Results show that, for instructors, the efficacy of ICT use, and constructivist, interactive forms of teaching most strongly predict a positive perception of the classroom learning experience. Meanwhile, for stu-dents, stimulating lectures are the chief predictors of their learning appreciation. Directions for future research are discussed in light of the results of this study. FACTEURS INFLUANT LA PERCEPTION DE L’EFFICACITÉ DU COURS ET DE
L’INTÉGRATION DE LA TECHNOLOGIE À L’ÈRE DU WEB 2.0 PARMIS LES INSTRUCTEURS UNIVERSITAIRES ET LEURS ÉTUDIANTS
RÉSUMÉ. Afin d’assurer l’intégration des technologies de l’information et de la communication (TIC) dans les universités, il est essentiel de comprendre comment les étudiants et leurs enseignants perçoivent leurs compétences et l’utilisation des TIC. Des données ont été recueillies d’étudiants et d’enseignants dans 12 universités québécoises par des questionnaires fondés sur les théories psycho-pédagogiques dans le contexte de l’intégration des technologies éducatives. Les résultats montrent que pour les enseignants, l’efficacité de l’utilisation des TIC et des stratégies interactives de l’enseignement prédisent plus fortement une perception positive de l’expérience d’apprentissage en classe. Cependant pour les étudiants, les cours magistraux qui sont stimulants sont l’élément le plus important de leur appréciation d’apprentissage. Les possibilités de recherche future sont discutées à la lumière des résultats de cette étude.
T
he burgeoning integration of information and communication technologies (ICTs) in higher education has reached a tipping point. Educational institu-tions are investing in a variety of ICTs to meet techno-pedagogical demandsmay be a challenge to find academic institutions that pay no heed whatsoever to the affordances of ICT, the differential manner and extent to which its integration occurs may have significant implications for students’ perceptions of course effectiveness (Galanouli, Murphy, & Gardner, 2004; Gosper, Malfroy, & McKenzie, 2013; Sun, Tsai, Finger, Chen, & Yeh, 2008). In this paper, the term ICT is equated to a broad range of tools incorporated in higher education classrooms that vary from course management systems, email, presentation applications, word processing, desktop publishing, social media tools, wikis, and blogs to specialized software and library services tools.
Numerous researchers have heralded the emergence of Web 2.0 technologies and their application in higher education settings (e.g., Carter & Salyers, 2015; Elgort, Smith, & Toland, 2008; Ellison & Wu, 2008; Farmer, Yue, & Brooks, 2008; Liu, Kalk, Kinney, Orr, & Reid, 2010). Social media tools such as blogs, wikis, forums, and online platforms have been used in both online and blended learning environments (Luce-Kapler, 2007; Oliver & Goerke, 2007; Rambe, 2015; Woodward, 2007; Xie, Ke, & Sharma, 2008). In addition, models such as Pedagogy 2.0 (Dron, 2006) have been developed for the application of Web 2.0 technologies in higher education settings (McLoughlin & Lee, 2007). Digital technology potentially facilitates new approaches of teaching and learn-ing; yet, it cannot guarantee per se that effective and appropriate learning outcomes are achieved (Kirkwood & Price, 2005; Meyer, 2002; Rabah, 2015; Rabah & Arshad-Ayaz, 2015). To this end, several researchers have investigated the link between students’ perceptions of the frequency and nature of ICTs used in the classroom and its relationship with the perceived quality of learning (e.g., Artino, 2007; Dziuban & Moskal, 2011; Lowerison, Sclater, Schmid, & Abrami, 2006a; Tang & Austin, 2009). In the present study, we extend exist-ing research frameworks surroundexist-ing the perceived efficacy of technology use in post-secondary contexts, and using a survey methodology, we attempt to elucidate the myriad factors impacting instructors’ and students’ perceptions of course effectiveness and technology integration in an age of increased social media technology use.
INTEGRATION OF ICTS IN THE ERA OF WEB 2.0
How students use ICTs to promote their learning is crucial for determin-ing digital technology’s added value in higher education settdetermin-ings. There is no one-size-fits-all technology solution that can be recommended for higher education institutions looking to integrate ICTs in the academic realm. Prior studies have found that Internet, email, and productivity tools are the most commonly used ICTs in higher education settings (e.g., Conole, Delaat, Dil-lon, & Darby, 2008; Kirkwood & Price, 2005; Kvavik, Caruso, & Morgan, 2004). Students, for instance, perceive that browsing the web and using social media tools are beneficial as they support their learning and let them explore
beyond the limits of a textbook (Tang & Austin, 2009; Kirkwood & Price, 2005). The pedagogical value of integrating blogs into university-level courses is garnering increased interest (Goktas & Demirel, 2012). While blogs can be used with varied pedagogical goals in mind such as student reflection (Shabb, Stonehouse, Smart, & Gourneau, 2009) or to provide an alternative forum for regular classroom dialogue (Mokhtar, Al Bustami, & Elnimeiri, 2009), the jury is still out regarding their usefulness. In a quasi-experimental study involving 149 undergraduates, Hsu and Wang (2009) found that students who used blogs for supplementary reading and writing assignments had neither significantly higher reading performance nor learning motivation scores than their non-blogging counterparts. However, the non-blogging group had a significantly higher retention rate than the control group. Moreover, teachers participating in Hsu and Wang’s (2009) study felt bloggers were able to create a more supportive learning community than the non-bloggers.
Use of wikis in higher education
Wikis are also gaining currency in university teaching contexts. Apart from the unassailable presence and use of Wikipedia by students and teachers alike, the potential benefits students can derive from using wiki interfaces are be-ing much lauded (Croteau, Venkatesh, Beaudry, & Rabah, 2015; Venkatesh, Croteau, & Rabah, 2014). In a study evaluating the use of wikis in universities, Schwartz, Clark, Cossarin, and Rudolph (2004) portrayed wikis as user-friendly and offering greater flexibility than blogs; the 24 wikis evaluated in this study were mostly designed to create communal repositories of knowledge as well as allow students to discuss course-related material. Barker (2008) has reported on how easily wiki tools can be used by students, whether individually or col-lectively, to build knowledge structures stemming from knowledge domains. Elsewhere, in a case study of university pre-service teachers, students perceived that the process of preparing and adding content to a wiki enabled not only access to prior knowledge, but also enabled cross-curricular transfer of knowl-edge (Matthew, Felvegi, & Callaway, 2009). Moreover, students in Matthew et al.’s (2009) study felt the wiki contributions helped them to read, research, synthesize, collaborate, and add material in a more thorough way than they would otherwise have done. Finally, Weaver and McIntosh (2009) found that wikis helped promote teamwork skills among off-campus university students during a group work project. Off-campus students using the application also demonstrated higher levels of collaboration than their on-campus counterparts. Use of podcasts in higher education
Like wikis, podcasts are weaving their way into the virtual fabric of academic institutions, although their effectiveness as learning tools remains an open question. Increasingly, universities are offering students the opportunity to watch pre-recorded lectures via podcast and while students show an aversion to
full-length lectures in podcast form, compulsory podcast listening may lead to improved academic performance (Carvalho & Aguiar, 2009). Students them-selves appear to value using podcasts because they consider them to represent where education is heading (Ogawa, 2009). More recently, 2,343 university students were surveyed regarding the perceived effectiveness of podcasts as a tool to enhance learning (Vajoczki, Watt, Marquis, & Hoshausen, 2010). Ac-cording to the results, most students (57%) felt podcasts had helped them to understand and remember course material, particularly around exam time. Vajoczki et al. (2010) also found that while instructors did not report an increase in workload, student attendance had dropped as a result of podcasts. Online social networks in higher education
Another affordance of Web 2.0 technology that is generating discussion cen-ters around the relatively recent but ubiquitous phenomena of online social networks. Dron and Anderson (2007) argued that the group (in the context of collaborative projects), the network (in the context of discussions and queries), and the collective (in the context of data mining) play distinct roles whenever social software is employed for e-learning. Furthermore, Mendoza (2009) maintained that Google, Facebook, and Twitter may enable students to learn outside of the classroom and build communities at the same time. Online social networks are also being successfully deployed to initiate collaborative online communities of practice among university students and their recently employed counterparts (Tsai, Laffey, & Hanuscin, 2010).
Millennial students are partly characterized by their relatively autonomous use of ICTs. Conole et al. (2008) used purposive sampling in a case study of 427 university students, who were selected from four higher education academies with different subject concentrations — medicine, economics, information and computer sciences, and languages. The researchers investigated students’ perceptions towards ICT in order to highlight the benefits of integrating ICTs in higher education settings using data collected through questionnaires, in-terviews, and audiologs. The researchers discovered that individuals determine for themselves, and to varying degrees, exploit technologies that suit their particular needs as learners. They also contended that students would set up their own independent online learning support networks and prefer these tools to discussion forums created by their instructors. Similarly, Edmunds, Thorpe, Conole, and Grainne (2010) found that while universities may invest heavily in virtual learning environments, today’s students are highly selective in terms of which technologies they will actually spend time on. These find-ings resonate with that of Salaway, Caruso, Nelson, and Ellison (2008), who found that university students possess “a wide range of preferences, uses, skills and opinions about [information technology] in the academic context” (p. 11).
PERCEPTIONS OF COURSE EFFECTIVENESS IN HIGHER EDUCATION Several studies have explored the relationship between perceptions of course effectiveness and academic achievement. Most recently, in a second-order meta-analysis, Wright and Jenkins-Guarnieri (2012) analyzed the findings of 11 meta-analyses (233 primary studies in total) on the validity, practical use, and effective implementation of student evaluations of teaching (SETs). Results highlight the myriad factors that impact perceptions of course effectiveness, including instructor’s expressiveness in the classroom, lecture content, and consultation / feedback strategies from students. According to findings from an exploratory meta-analysis by Penny and Coe (2004), SETs were helpful in providing effective consultation feedback that consequently enhances the quality of instructors’ teaching. Effect sizes as high as .69 characterized the relation-ship between teaching effectiveness and use of certain consultation strategies emanating from SETs (Penny & Coe, 2004). Elsewhere, in a systematic review of multi-section validity studies, d’Appollonia and Abrami (1997) found that 45% of the variation in student learning was explained by variance in student perceptions of instructor effectiveness. Prior empirical research (e.g., Marsh, 1987, 2007; Marsh & Roche, 2000; Menges & Brinko, 1986) has touted the validity of SETs because of the significant positive statistical relationship between perceptions of course effectiveness and actual learning outcomes. Marsh (2007) asserted that “[w]hereas a grading-leniency effect may produce some bias in SETs, support for this suggestion is weak and the size of such an effect is likely to be insubstantial” (p. 357).
A study of over 1.1 million Open University students’ course evaluations, including both online and face-to-face instruction, revealed that students appraise course effectiveness by focusing on global aspects of the learning process than specific details pertaining to the course instruction (Dziuban & Moskal, 2011). In their evaluations, students tended to respond globally to “the course, the content, the instructor, the learning climate and themselves” (p. 5). The findings of this study suggest that different classroom settings including online, classroom, or a blend of both, and the use of different technologies are not the main determinants of a positive evaluation of learning. Students do not take into consideration the teaching approach of their course when they appraise their learning experiences at the end of their program of study. Instead, students report their overall global perspective and/or feeling about that learning experience. Students’ course evaluations, according to Dziuban and Moskal (2011), may not only be linked to the course instructor and the course’s mode of delivery but also to their personal evaluation of their own approach to learning.
Elsewhere, Artino (2007) has demonstrated that the combination of student motivation and perceptions of good quality instruction are good predictors of perceived online course effectiveness. In this study, Artino surveyed 646
regarding perceived course effectiveness. Findings revealed that 54% of the variance in students’ perceptions of online course satisfaction could be ex-plained by the impact of perceived task value and self-efficacy and perceptions of quality instruction.
Kirkwood and Price (2005) have investigated students’ attitudes towards ICTs embedded in courses by analyzing research studies with a combined sample of close to 80,000 students from the Open University campus based in the United Kingdom. They found that students are more inclined to use ICTs and incorporate them in academic settings when they understand and inter-nalize why the tools are useful to them in that specific instance. This would suggest that in order to make selections from the existing pool of technology applications, students have to understand why ICT is beneficial to them in that particular situation and how to best operate it. Students’ decision to use technology is proportional to the time invested in learning to use that technol-ogy and its perceived benefits.
Edmunds et al. (2010) researched how students’ perceptions of ICT use dif-fered across academic, work, and social contexts. The sample consisted of 421 university participants enrolled in six different technology-embedded courses at the Open University in the United Kingdom. Participants were tested via a questionnaire structured around the Technology Acceptance Model, devised by Davis (1989), which links user acceptance of information and communica-tion technology tools to perceived usefulness and perceived ease of use. Find-ings from the Edmunds et al. (2010) study confirmed that perceived benefits and usage proficiency explained variance in students’ attitudes towards ICTs and how they are employed in various settings. In addition, prior experience emerged as a predictor for perceived ease of use of technology. ICTs were perceived as being even more useful when students realized that they would be using them at work settings at a future point in time. At the university level, students started becoming aware of the benefits that ICT offers them, not only to successfully complete their coursework but also, for their survival in the current complex and multifaceted work settings (Conole et al., 2008). In a study by Goodyear, Asensio, Jones, Hodgson, & Steeples (2003), 178 first-year undergraduate social science students completed survey items adapted from Entwistle & Ramsden’s (1983) Approaches and Study Skills Inventory for Students (ASSIST) survey to investigate the relationships between learners’ attitudes towards networked-based learning and approaches to studying. Survey items invited students to categorize their approaches to learning and asked them about their perceptions of computer network-based learning, a term used by the authors to denote the use of ICT in learning to enhance interactions among all stakeholders involved. Results suggested that students’ perceptions of their own approaches to learning had no effect on their perceptions of networked-based learning. The recommendations of this study indicated that research
should address instructional design and an understanding of what students actually know about networked-based learning; students may understand their own learning, but not necessarily the impact that networked learning may have on pedagogical processes.
Prior research in the Quebec context
The Centre for the Study of Learning and Performance (CSLP) in Montreal has conducted survey research on perceptions of effectiveness of ICT integration in the graduate Quebec university context (both undergraduate and graduate), most notably Lowerison et al.’s (2006a) survey of 1,966 students from 81 dif-ferent university classes, and Lowerison et al.’s (2006b) survey of 922 university students. These studies used instruments (Centre for the Study of Learning and Performance [CSLP], 2004a, 2004b) that were developed with theoretical frameworks anchored in instructional design and educational psychology, and were subsequently validated with several populations across North America. The surveys took into account empirical work surrounding learner preferences (Smith, 1997) for cooperative learning (Abrami, Lowerison, & Bures, 2004; Jonassen, Howland, Moore, & Marra, 2003), instructivist versus constructivist methodologies (Evans & Fan, 2002; Wagner & McCombs, 1995), efficiency of learning versus effectiveness of learning (Bruner, 1996; Butler, 2000), as well as process-oriented versus task-oriented instructional strategies (Laurillard, 2002; Molden & Dweck, 2000; Murray, 1998). Lowerison et al.’s (2006a, 2006b) work indicated that when ICT is used frequently in the classroom, students tend to perceive they have more control over their learning, and in turn increase their perceptions of positive course effectiveness.
Quebec university students’ perceptions of the use of ICT in higher education have also been studied by Raby, Karsenti, Meunier, and Villeneuve (2011) whose results offered a list of emerging academic recommendations for effective inte-gration of ICT in higher education. Their survey of 10,266 university students showed that the majority enjoy a variety of ICTs since they consider that such technologies provide increased access to information related to their courses and foster communication and collaboration with their course instructors and colleagues. The perceived use of available ICTs, in addition to an integrated platform with frequently updated course information, appears to be particu-larly conducive to student learning. Other teaching strategies such as online lecture notes and complementary websites are also perceived as conducive to learning. However, it appears that certain educational practices are perceived as less favorable to learning. These include slideshow presentations that are poorly designed and mandatory participation in discussion forums. While the use of ICTs by Quebec university instructors is perceived to be contributing to students’ learning, we are unaware of how the efficacy of the use of these technologies might predict perceived course effectiveness.
RESEARCH OBJECTIVES
The purpose of this study was to gauge the perceptions of Quebec university students and teachers regarding perceived course effectiveness, proficiency with and knowledge of specific types of ICTs, as well as perceived effectiveness of technology use in their classrooms. Our broad research objectives are to: • explore the relationships between perceived use of different types of ICTs
and their perceived efficacies of use in Quebec university student and instructor populations; and
• use inferential statistical models to explain how perceived course effective-ness can be linked to perceptions of technology integration, instructional methods employed by instructors and studying approaches adopted by learners.
METHODOLOGY, DATA CLEANING, AND COMPOSITE VARIABLES Questionnaire construction
Members of the Sous-comité sur la pédagogie et les technologies de l’information et
de la communication (SCPTIC), working under the auspices of the Conférence des recteurs et des principaux des universités du Québec (CREPUQ) organization
received the support of 12 Quebec universities to develop, pilot test, and implement student and instructor questionnaires that address perceptions of course effectiveness and ICT use.
Questionnaires originally developed, validated, and used by Lowerison et al. (2006a, 2006b) were adapted to include items regarding Web 2.0 technology use, and these new instruments were then piloted at a Quebec university in 2010 with over 500 students and 11 teachers. The pilot test led to revisions to several sections of each of the questionnaires. The final versions of the two questionnaires were translated into French.2
Questionnaire sections
The student and instructor questionnaires gauged course structure preferences and perceptions of the efficacy of learning strategies and teaching methods used in higher education classrooms. In addition, the instruments yielded data detailing the variety of ICTs utilized by students and instructors in Quebec and addressed the respondents’ respective levels of technology knowledge. The majority of questions employed a Likert scale rating, which is popular in students’ evaluations of university teaching (Young, Cantrell, & Shaw, 1999). Participants were asked to think of one course taken (for students) or taught (for instructors) during the Winter 2011 term while answering the survey.
Questionnaire administration
Surveys were administered electronically in February and March of 2011 to 147,095 students and 13,303 instructors using a probabilistic sampling strategy; some universities gave access to their entire population of students and profes-sors, others randomly chose their coverage. Email addresses for all students and instructors were legally obtained from the 12 participating institutions. Each respondent was sent a unique code via email with which to access the survey, thereby ensuring the validity of the data collected. A total of 15,020 students and 2,640 instructors responded to the survey culminating in a participation rate of 10% of the student population and a remarkable 20% of the instructor population. Researchers such as Carini, Hayek, Kuh, Kennedy, and Ouimet (2003) have indicated that the response rate for online surveys is, for the most part, equivalent to those administered physically.
Data screening and demographics
One hundred and six instances corresponding to responses larger than the standardized z score of 3.29 (p < .001) were considered as outliers and removed. Missing values for 150 instances of data (less than 1% of the total sample) have been replaced using linear trend at point, as per guidelines in Tabachnik and Fidell (2012). The majority of questions provided participants with the option of responding “not applicable”; these “not applicable” data responses were not replaced, but were eliminated from descriptive and inferential proce-dures. Data cleaning yielded valid responses from 14,928 students and 2,626 instructors. Tables 1 and 2 summarize the demographic profiles of the two sets of participants — students and instructors. In the present paper, we do not use demographic variables to discern differences between different student and learner populations (such as gender, level of education, faculties, status, and the like) as these variables did not regress into the models we tested and reported herein.
TABLE1. Frequencies for students’ demographic items (N = 14,928)
Demographic Items Frequency
Gender Male 5,422 Female 9,506 Status Full-time Student 12,121 Part-time Student 2,807 Undergraduate Level Year 1 7,415 Year 2 2,158 Year 3 2,088 Diploma 2,366 Other (Certificate) 901 Faculty
Arts & Literature 2,202
Social Sciences, Humanities, and Business 7,615
Health and Life Sciences 2,117
Pure and Applied Sciences, Engineering, and Computers 2,994 Statistical Package for the Social Sciences version 20 (SPSS v. 20.0) was used to analyze the data. Standard multiple regression analyses were selected to explain the relationships between the variables. Data screening procedures for the basic assumptions underlying the use of the inferential statistical tech-niques such as multiple regressions consisted of analyzing residuals for linearity, normality, and homoscedasticity. Scatter plots showed that the residuals fell approximately on a straight line. We therefore reasonably concluded that the assumption of linearity was not violated. The variance of the residuals was homogeneous across levels of the predicted values, thereby confirming that we had not violated the assumption of homoscedasticity. In addition, with regards to normality assumptions, Kolmogorov-Smirnov tests revealed a normal distribution of residuals for all variables used in the analyses. Finally, we tested the assumption of multicollinearity among the independent variables by using the Variation Inflation Factor (VIF). No variable showed a VIF result of more than 2.7, indicating that the multicollinearity assumption was not violated.
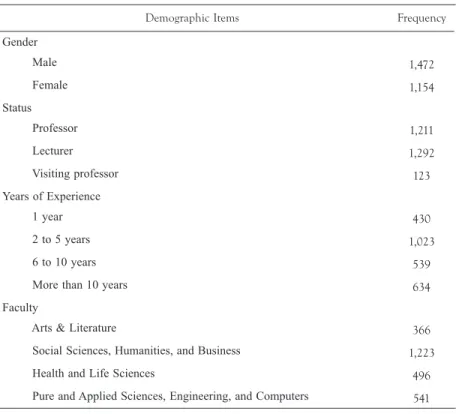
TABLE 2. Frequencies for instructors’ demographic items (N = 2,626)
Demographic Items Frequency
Gender Male 1,472 Female 1,154 Status Professor 1,211 Lecturer 1,292 Visiting professor 123 Years of Experience 1 year 430 2 to 5 years 1,023 6 to 10 years 539
More than 10 years 634
Faculty
Arts & Literature 366
Social Sciences, Humanities, and Business 1,223
Health and Life Sciences 496
Pure and Applied Sciences, Engineering, and Computers 541 Creation of composite variables
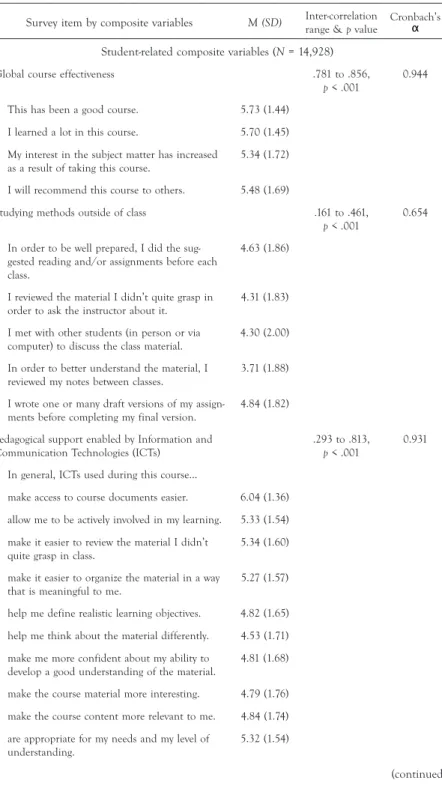
To better explore the factors that might be predictive of students’ and instruc-tors’ perceptions of technology use and course effectiveness, we decided to create several composites that better reflect the themes investigated in this research. Table 3 summarizes the composites with their corresponding range of inter-item correlations. The Cronbach’s alpha values calculated demonstrated strong internal consistency in the sets of variables from which each composite is derived.
TABLE 3. Descriptive statistics, intercorrelation range, and internal consistency (Cronbach’s α) for items in composite variables
Survey item by composite variables M (SD) Inter-correlation range & p value Cronbach’sα Student-related composite variables (N = 14,928)
Global course effectiveness .781 to .856,
p < .001 0.944
This has been a good course. 5.73 (1.44) I learned a lot in this course. 5.70 (1.45) My interest in the subject matter has increased
as a result of taking this course.
5.34 (1.72) I will recommend this course to others. 5.48 (1.69)
Studying methods outside of class .161 to .461,
p < .001
0.654 In order to be well prepared, I did the
sug-gested reading and/or assignments before each class.
4.63 (1.86)
I reviewed the material I didn’t quite grasp in
order to ask the instructor about it. 4.31 (1.83) I met with other students (in person or via
computer) to discuss the class material. 4.30 (2.00) In order to better understand the material, I
reviewed my notes between classes.
3.71 (1.88) I wrote one or many draft versions of my
assign-ments before completing my final version. 4.84 (1.82) Pedagogical support enabled by Information and
Communication Technologies (ICTs)
.293 to .813,
p < .001
0.931 In general, ICTs used during this course…
make access to course documents easier. 6.04 (1.36) allow me to be actively involved in my learning. 5.33 (1.54) make it easier to review the material I didn’t
quite grasp in class.
5.34 (1.60) make it easier to organize the material in a way
that is meaningful to me. 5.27 (1.57)
help me define realistic learning objectives. 4.82 (1.65) help me think about the material differently. 4.53 (1.71) make me more confident about my ability to
develop a good understanding of the material.
4.81 (1.68) make the course material more interesting. 4.79 (1.76) make the course content more relevant to me. 4.84 (1.74) are appropriate for my needs and my level of
understanding. 5.32 (1.54)
TABLE 3. Descriptive statistics, intercorrelation range, and internal consistency (Cronbach’s α) for items in composite variables (continued)
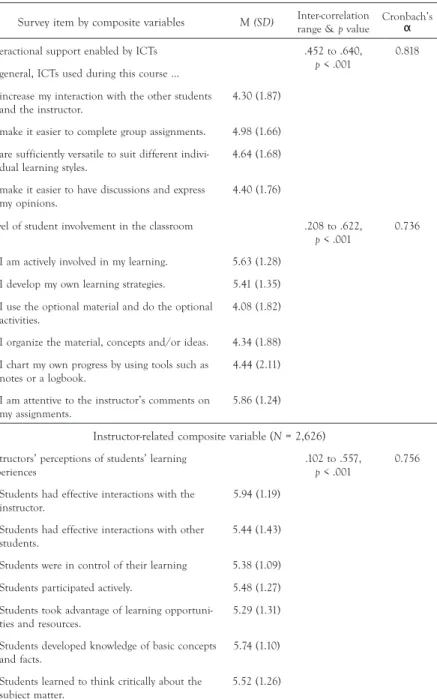
Survey item by composite variables M (SD) Inter-correlation range & p value Cronbach’sα Interactional support enabled by ICTs .452 to .640,
p < .001 0.818
In general, ICTs used during this course … increase my interaction with the other students
and the instructor. 4.30 (1.87)
make it easier to complete group assignments. 4.98 (1.66) are sufficiently versatile to suit different
indivi-dual learning styles. 4.64 (1.68)
make it easier to have discussions and express my opinions.
4.40 (1.76)
Level of student involvement in the classroom .208 to .622,
p < .001 0.736
I am actively involved in my learning. 5.63 (1.28) I develop my own learning strategies. 5.41 (1.35) I use the optional material and do the optional
activities.
4.08 (1.82) I organize the material, concepts and/or ideas. 4.34 (1.88) I chart my own progress by using tools such as
notes or a logbook.
4.44 (2.11) I am attentive to the instructor’s comments on
my assignments. 5.86 (1.24)
Instructor-related composite variable (N = 2,626) Instructors’ perceptions of students’ learning
experiences
.102 to .557,
p < .001
0.756 Students had effective interactions with the
instructor. 5.94 (1.19)
Students had effective interactions with other students.
5.44 (1.43) Students were in control of their learning 5.38 (1.09) Students participated actively. 5.48 (1.27) Students took advantage of learning
opportuni-ties and resources. 5.29 (1.31)
Students developed knowledge of basic concepts and facts.
5.74 (1.10) Students learned to think critically about the
subject matter. 5.52 (1.26)
RESULTS
Students’ preferred learning strategies
Table 4 summarizes students’ perceptions of the effectiveness and frequency of use of learning strategies. Means and standard deviations refer to the re-sponses of the whole sample of students. Percentages were calculated by adding responses on a 7-point Likert scale from 4 to 7 since they indicated students agreed with the relevant statements in the questionnaire. Forty five percent of the students reported spending more than three hours per week studying for their courses which happens to be the amount of time generally recom-mended by university instructors in Quebec; given this recommendation, it is disturbing to note that 55% of students reported studying for three hours or less per week. Just over two thirds of learners (71%) reported completing the assigned readings and recommended exercises each week (M = 4.63,
SD = 1.86) and 67% said they reviewed material and queried their instructor
when needed (M = 4.31, SD = 1.83; see Table 4). About two-thirds believed their study skills were very effective, one third of the respondents believed their study skills were moderately effective, and around 3% considered them as ineffective3 (M = 5.87, SD = 1.02; see Table 4).
As for the use of computers in scholastic tasks, close to 90% of the student participants reported using a computer frequently to produce written work (M = 6.55, SD = 0.99), 86% said they use a computer frequently to prepare for oral presentations (M = 6.37, SD = 1.15) and around 55% reported using it frequently to revise or prepare for an exam (M = 5.22, SD = 1.85). Calculating percentages of students who produced written assignments using computers was done by adding Likert scale responses from 4 to 7 on a scale of 7. TABLE 4. Summary of students’ perceptions of effectiveness and frequency of use of learn-ing strategies (N = 14,928)
Questionnaire Item M SD
In order to be well prepared, I did the suggested reading and/or
assign-ments before each class.a 4.63 1.86
I reviewed the material I didn’t quite grasp in order to ask the instructor
about it.a 4.31 1.83
Overall effectiveness of the strategies I use to complete my written
assign-mentsb 5.87 1.02
I used the computer to produce written assignments.c 6.55 0.99
I used a computer to prepare for an oral presentation.c 6.37 1.15
I used a computer to revise or prepare for an evaluation.c 5.22 1.85
NOTE. aResponse measured on seven-point scale from strongly disagree (1) to strongly agree (7). b Response measured on seven-point scale from ineffective (1) to effective (7). cResponse measured
Perceptions of pedagogical effectiveness of ICTs: Differences between students and instructors
Table 5 outlines the descriptive statistics of frequency of ICT use by instruc-tors, perceived effectiveness of ICTs by instructors and students as well as correlations between instructors’ and students’ perceived effectiveness of ICTs. Students and instructors differed statistically in their reported perceptions of the pedagogical effectiveness of various ICTs (bolded means in Table 5 denote significantly higher means at p < .001 as demonstrated by independent sample
t tests). With regards to commonly used technologies, instructors’ perceptions
of the effectiveness of emails, word processing and presentation applications, course management systems, and desktop publishing tools were significantly higher than those of students. On the other hand, students reported signifi-cantly higher perceptions of effectiveness for use of social media-related tools such as blogs, chats, forums, and wikis, as compared to instructors. As for specialized software, students reported significantly higher perceptions of ef-fectiveness for simulations, statistical analysis tools, and virtual experiments as compared to instructors.
Relationship between usage of ICTs and efficacy of use
We regressed the students’ perceptions of the global course effectiveness variable on the following items: perceptions of students regarding teaching methods and studying methods utilized in classroom, perceived effectiveness and sup-port enabled by ICT use, level of student involvement and time spent studying outside of class to explain possible predictors. Overall, we were able to explain a meaningful proportion of variance in the degree of perceived course effective-ness with 15 significant predictors, R2 = .54, F(15, 14,912) = 1,187.96, p < .001. Table 6 displays the unstandardized regression coefficients (B) and its corre-sponding standard error, the standardized regression coefficients (β), R2 and adjusted R2. The adjusted R2 value of .54 indicates that more than a half of
the variability in perceived global course effectiveness is predicted by percep-tions of students regarding teaching methods and studying methods utilized in classroom, perceived effectiveness and support enabled by ICT use, perceived level of student involvement, and time spent studying outside of class. Results showed that, for students, a positive impression of course effectiveness is most strongly predicted by perceptions of intellectually-stimulating content (β = .28, p < .001), as well as formal, lecture-style presentations (β = .18, p < .001), with relevant and significant material (β = .16, p < .001). Perceived effectiveness of ICT use in classrooms (β = .09, p < .001) are less significant yet important factors, followed by perceptions of pedagogical support enabled by ICT usage (β = .08, p < .001), time spent studying outside of the classroom (β = .04,
p < .001), interactional support enabled by ICT usage (β = .02, p < .001), and studying outside of class (β = .02, p < .05). For students, perceptions of effec-tiveness of group discussions did not predict a positive impression of course
TABLE 5. Descriptive statistics of frequency of ICT use by instructors, perceived effective-ness of ICTs by instructors and students; correlations between instructors’ and students’ perceived effectiveness of ICTs
ICTs
Teachers Students T-test between instructors’ and students’ PE of ICTs Frequency of ICT use (FIU)a Perceived Effectiveness (PE)b Correlation between FIU and PEc PEb t df p value M SD M SD M SD
All forms of email 6.44 1.29 6.25d 1.31 (N = 2,506) .397 5.92 1.38 (N = 14,928) 11.1567 17,432 < .0001 Word processing 6.33 1.54 6.14 1.40 (N = 2,383) .474 5.75 1.35 (N = 14,928) 13.0284 17,309 < .0001 Presentation applications such as PowerPoint, concept mapping tools such as Cmaptools, etc. 6.09 1.91 6.18 1.43 (N = 2,401) .597 5.76 1.41 (N = 14,928) 13.5202 17,327 < .0001
Moodle, WebCT, Claroline, Sakai, class websites, course portals, etc. 5.15 2.50 5.80 1.72 (N = 2,125) .578 5.67 1.54 (N = 14,928) 3.5860 17,051 .0003 Internet, multimedia CD-ROMs or DVDs, etc. 4.90 2.39 5.54 1.86 (N = 1,938) .466 5.54 1.81 (N = 9,814) 0.00 11,750 1.00
Desktop publishing, video, photography, scans or screen captures, etc.
4.73 2.41 5.46 1.90 (N = 1,830)
.470 5.14 1.93 (N = 8,383)
6.4438 10,211 < .0001
Library services (databases, reference management software such as Endnote and Procite, research tools)
3.75 2.51 4.99 2.06 (N = 1,694) .554 5.06 2.01 (N = 8,740) 1.3065 10,432 .1914
Schedules, datebooks, etc. 3.44 2.60 4.65 2.28 (N = 1,488)
.582 5.40 1.79 (N = 10,525)
14.5772 12,011 < .0001
Tests, quizzes, etc. 3.24 2.48 5.47 1.86 (N = 1,768)
.393 5.16 1.81 (N = 8,857)
6.5447 10,623 < .0001
Blogs, chats, forums, etc. 2.34 2.13 3.53 2.27 (N = 1,250)
.632 4.06 2.19 (N = 6,909)
7.8292 8,157 < .0001
Wiki, document sharing, etc. 2.32 2.08 3.71 2.23 (N = 1,125) .529 4.70 2.06 (N = 6,953) 14.7790 8,076 < .0001
Log books, electronic portfolios, etc. 1.78 1.73 3.14 2.27 (N = 947) .573 3.93 2.17 (N = 5,595) 10.2907 650 < .0001
Specialized tools and software (SPSS, Autocad, etc) 2.46 2.32 3.99 2.56 (N = 1,107) .757 4.30 2.37 (N = 5,126) 3.8895 6,231 < .0001
Tutorials, drill and practice exercises etc. 2.12 1.95 3.91 2.36 (N = 1,112) .541 4.29 2.20 (N = 5,824) 5.2154 6,934 < .0001
Simulations, virtual experi-ments, etc 1.75 1.67 3.48 2.41 (N = 972) .599 4.04 2.28 (N = 4,941) 11.8651 9,880 < .0001
NOTE. aResponse measured on seven-point scale from never (1) to often (7); bResponse measured
on seven-point scale from ineffective (1) to effective (7). cPearson correlation coefficients are all
statistically significant at p < .001. dBolded means indicate significantly higher mean score for
TABLE 6. Factors predicting composite variable of students’ perceptions of global course effectiveness (N = 14,928, predicted variable: students’ perceptions of course effectiveness [composite])
Factors
(including both Questionnaire Items and
Composites) b SE b
β p
95% Confidence Interval Lower bound Upper bound
(Constant) -1.06 .21 .000 -1.46 -0.65
In this course, I consider that the material offers stimulating intellectual challenges.a
1.12 .03 .28*** .000 1.07 1.18 In this course, I consider that the instructor
led lectures are effective.a
.69 .03 .18*** .000 0.64 0.74 In this course, I consider that the material is
relevant and significant.a
.64 .03 .16*** .000 0.58 0.70 Overall perceived effectiveness of usage of
ICTs in the course.b
.37 .03 .09*** .000 0.32 0.42 Pedagogical support enabled by ICT.
(Com-posite) .04 .00 .08*** .000 0.03 0.04
Level of student involvement in the classroom. (Composite)
.07 .01 .07*** .000 0.05 0.08 In this course, I consider that individual
interests are taken into consideration.a
.19 .03 .05*** .000 0.14 0.25 In this course, I consider that the instructor’s
chosen teaching activities prove he/she aims to accommodate different learning styles.a
.16 .03 .04*** .000 0.09 0.22
In this course, I consider that we are encou-raged to listen to other students’ opinions and to take them into account.a
.14 .03 .04*** .000 0.09 0.20
Average time spent studying for course outside of classc
.22 .04 .04*** .000 0.15 0.30 In this course, I consider that we are
encouraged to make the most of our practical assignments and labs.a
.10 .03 .03*** .000 0.05 0.15
Interactional support enabled by ICT usage.
(Composite)
.02 .01 .02** .007 0.01 0.04
Studying outside of class. (Composite) .02 .01 .02* .029 0.00 0.03 In this course, I consider that group
discus-sion is encouraged.a .04 .02 .01 .084 -0.01 0.09
In this course, I consider that collaborative or group work is encouraged.a
-.09 .02 .03*** .000 -0.14 -0.05 NOTE. R2 = .54. F(15, 14,912) = 1,187.96***. Adjusted R2 = .54.
aResponse measured on seven-point scale from strongly disagree (1) to strongly agree (7).b Response
measured on seven-point scale from ineffective (1) to effective (7).c Response measured on
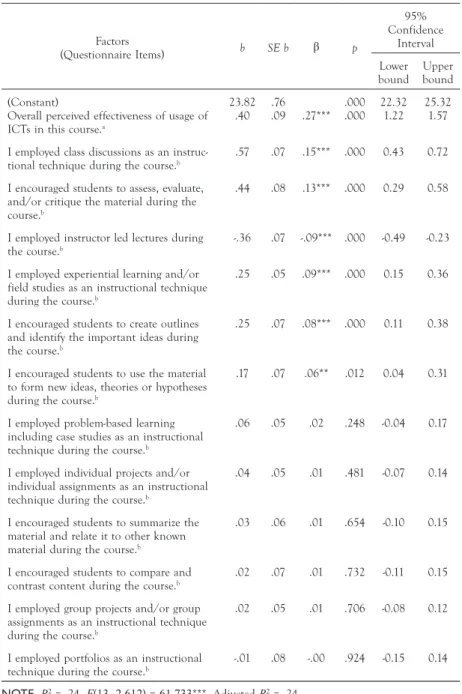
We next regressed instructors’ perceptions of their students’ learning experi-ences on how students perceived the effectiveness of instructional styles, their own study strategies, and ICTs utilized in the classrooms. Table 7 displays the unstandardized regression coefficients (B) and its corresponding standard error, the standardized regression coefficients (β), R2, and adjusted R2. The adjusted R2 value of .24 indicates that almost quarter of the variability in instructors’
perceptions of their students’ learning experiences can be explained by instruc-tional styles and corresponding appreciation of ICT used in the classroom,
R2 = .24, F(13, 2,612) = 61.73, p < .001.
The results in Table 7 demonstrate how factors that predict instructors’ percep-tions of global course effectiveness are drastically different from those of the students. Lecture-style teaching negatively predicts their perceptions of qual-ity of classroom experiences (β = -.09, p < .001); the use of interactive forms of teaching such as class discussions are significantly predictive of a positive perception of the learning experience (β = .15, p < .001). The largest predictor of instructors’ perceptions of course effectiveness was the overall perceived effectiveness of ICT usage in classrooms (β = .27, p < .001).
TABLE 7. Factors predicting composite variable of instructors’ perceptions of their students’ learning experiences (N = 2,626) Factors (Questionnaire Items) b SE b β p 95% Confidence Interval Lower bound Upper bound (Constant)
Overall perceived effectiveness of usage of ICTs in this course.a
23.82
.40 .76.09 .27*** .000.000 22.321.22 25.321.57 I employed class discussions as an
instruc-tional technique during the course.b .57 .07 .15*** .000 0.43 0.72
I encouraged students to assess, evaluate, and/or critique the material during the course.b
.44 .08 .13*** .000 0.29 0.58
I employed instructor led lectures during
the course.b -.36 .07 -.09*** .000 -0.49 -0.23
I employed experiential learning and/or field studies as an instructional technique during the course.b
.25 .05 .09*** .000 0.15 0.36
I encouraged students to create outlines and identify the important ideas during the course.b
.25 .07 .08*** .000 0.11 0.38
I encouraged students to use the material to form new ideas, theories or hypotheses during the course.b
.17 .07 .06** .012 0.04 0.31
I employed problem-based learning including case studies as an instructional technique during the course.b
.06 .05 .02 .248 -0.04 0.17
I employed individual projects and/or individual assignments as an instructional technique during the course.b
.04 .05 .01 .481 -0.07 0.14
I encouraged students to summarize the material and relate it to other known material during the course.b
.03 .06 .01 .654 -0.10 0.15
I encouraged students to compare and
contrast content during the course.b .02 .07 .01 .732 -0.11 0.15
I employed group projects and/or group assignments as an instructional technique during the course.b
.02 .05 .01 .706 -0.08 0.12
I employed portfolios as an instructional
technique during the course.b -.01 .08 -.00 .924 -0.15 0.14
NOTE. R2 = .24. F(13, 2,612) = 61.733***. Adjusted R2 = .24.
aResponse measured on seven-point scale from ineffective (1) to effective (7). bResponse measured
DISCUSSION
Our findings build upon a large body of research, which has investigated the integration of ICTs in higher education. Our study provides a dual perspective, namely those of the students and instructors, on how perceptions of course effectiveness can be influenced by differing perceptions of pedagogical styles, perceived learning preferences, and types of ICT usage. The sheer size of the sample, the validity and reliability of the instruments used, and the probabilistic methods used to recruit participants make this research generalizable to popula-tions of learners across North America and Europe with similar educational and information technology infrastructures (see Dziuban & Moskal, 2011; Lowerison et al. 2006a, 2006b for population characteristics).
Lowerison et al. (2006b) surveyed the perceptions of 922 undergraduate as well as graduate students enrolled in a Quebec university on perceived effectiveness of ICT use and its corresponding link to course evaluations. Their results showed that students, for the most part, valued technology integration in their learning. However, unlike our study, Lowerison et al.’s (2006b) multivariate statistical models suggest no positive relationship between technology use and perceived global course effectiveness.
In their mixed methodology study, Conole et al. (2008) confirmed that students perceive themselves as sophisticated and discernible technology users. They report on student usage of several types of ICTs, depending on the goal of the activity at hand, selecting and appropriating technologies according to their own personal needs, whilst being aware of the benefits and shortcomings of each tool. Our findings are not dissimilar, in that most students and teachers felt competent in the use of ICTs, except that students were significantly less positive about the use of ICT for academic purposes. These results resonate with that of Kennedy, Judd, Churchward, Gray, and Krause (2008) and Caruso and Kvavik (2005), who found that university students do not neces-sarily transfer their perceived proficiency in ICT usage from non-academic to academic settings.
Our findings do raise further questions, which need to be discussed in light of the theoretical bases for the present study. Our study demonstrates that the perceived effectiveness of ICT use (β = .09, p < .001; see Table 6) in academic learning situations may play less of a clear-cut role in predicting the extent to which students are satisfied with courses when compared to instructional strategies employed by the instructor (β = .28, p < .001; see Table 6). At the same time, our results show that perceptions of ICT use have the most im-portant role to play in how instructors perceive the effectiveness of courses that are delivered in university settings (β = .27, p < .001; see Table 7). The results from the analyses of student data resonate with prior literature in this area; in a survey of 800 mid-west undergraduate students with regards to their ICT skills, perceived educational benefits, and teachers’ effectiveness,
Keengwe (2007) asserted that students’ perceived ICT competency, whether for personal or instructional activities, did not strongly predict students’ per-ceived benefits of ICT use. When students perceive themselves as competent in their use of ICT in general, they attribute the beneficial effects of ICT to their own learning. In addition, a significant negative partial coefficient (-.20) was observed for perceived faculty integration of ICT and students’ perceived learning benefits (Keengwe, 2007). The results from Keengwe’s stratified random sample appears to suggest that the more technology is used by a professor, the less students feel it might enhance their learning experience. Our present study goes beyond the question of frequency use and addresses the question of perceived effectiveness. In fact, in our regression models, perceived efficacy of ICT use predicted, albeit to a small extent, students’ perceptions of course effectiveness, whereas for instructors, perceptions of efficacy of ICT use were the most significant predictors of their perceptions of positive learning experi-ences for their students.
IMPLICATIONS
There is a commonly held belief that a major overhaul of education is long overdue. For instance, it is often assumed that the affordances of digital technologies, such as the interactive nature of social media platforms, pose a serious challenge to traditional views of learning and teaching (Overbay, Pat-terson, Vasu, & Grable, 2010). Certainly, the advent of online learning has greatly extended the geographical reach of academic institutions and large-scale open online courses offer universities significant economic advantages. Both of these have prompted calls for a reassessment of what is expected of professors and students in the digital age.
Our study suggests, however, that the adoption of digital technologies and/or constructivist approaches in the university classroom should be approached with caution. The findings clearly demonstrate that students associate effective teaching with lecture-style instruction. What they want is to be intellectually stimulated and challenged, and this is not necessarily contingent upon the use of specific technologies. Results from our study demonstrate that professors perceive that lecture-style delivery has a negative impact on the perceived suc-cess of a course and consequently adopt more constructivist teaching strategies such as those involving group discussions. Another interesting contrast identi-fied in our study is the way professors and students choose to use technology during a course. Professors use the Internet to create and share knowledge content far more often than their students, who typically treat the Internet as a source of reference. Hence, despite the prevalence of social media to cre-ate and share content via online networks, our findings suggest that students prefer not to engage in social media for pedagogical purposes, reserving its use for non-academic pursuits.
On the basis of these findings, therefore, we believe it would be misguided of university instructors to dismiss traditional instructivist approaches entirely. Similarly, instructors hoping to integrate Web 2.0 technologies, such as those involving social networks, into their teaching should be aware that they may initially encounter resistance from students. Furthermore, it should not be assumed that digital technologies and constructivist teaching approaches repre-sent an uncomfortable alliance. Instead, we would argue that these instructors should remain receptive to both traditional and more modern, constructivist approaches. Researchers are unequivocal about the need for more training and support with regards to instructors wishing to implement technology into their classrooms (Karsenti et al., 2012; Vaughan, 2002). It is our belief, however, that in addition to tailored training workshops and ongoing support, university instructors require empirical research that not only demonstrates the pedagogical value of implementing various forms of technologies but also exposes the dilemmas and contradictions of embracing digital technologies within the classroom. We hope that the findings of this research go some way towards doing just this.
DIRECTIONS FOR FUTURE RESEARCH
While the study presents generalizable results from a large, representative sample of students and teachers in a Quebec context, it does have some limitations. First, the surveys for instructors and students could share more of the same sections so as to enable comparisons between the two populations; these sec-tions include, for example, perceived computer proficiency level and frequency of ICT use in courses. Second, the section on preferred learning strategies in the students’ survey showed poor internal reliability; these items need to be reconceptualized since students may exhibit preferences for both learner- and teacher-centered pedagogical practices, depending on the kinds of assignments and activities undertaken during a university course. Third, we use multiple regression procedures to eke out the salient predictors of perceived course ef-fectiveness in both student and instructor populations; in future reports, we intend on using exploratory factor analyses to create composites that group together items in theoretically valid categories.
NOTES
1. Vivek Venkatesh and Jihan Rabah are joint first authors. Venkatesh was responsible for the overall development and execution of the research, including elaboration of the methodology and discussion sections. Jihan Rabah oversaw the literature review, analyses of results, and revised and redrafted the manuscript after peer review.
2. Questionnaires are available at the following URLs: Instructor Questionnaire (English Version): https://www.concordia.ca/content/dam/artsci/research/cslp/docs/TIC_Instructors_Ques-tionnaire_Eng2.pdf; Student Questionnaire (English Version): https://www.concordia.ca/ content/dam/artsci/research/cslp/docs/TIC_Student_Questionnaire_Eng2.pdf; Student Questionnaire (French Version) on pp. 68-79 and Student Questionnaire (French Version) on pp. 80-90: http://www.crepuq.qc.ca/IMG/pdf/Rapport-Etude-TIC-Mai-2012-VF.pdf 3. In order to further tease apart the participants’ responses, we calculated “very effective study
skills” by adding Likert-scale responses ranging from 6 to 7, “moderately effective study skills” for responses ranging from 4 to 5, and “ineffective study skills” ranging from 1 to 3. REFERENCES
Abrami, P. C., Lowerison, G., & Bures, E. M. (2004). Introduction to the special issue on postsecond-ary instruction: The old science of phrenology and the new science of college teaching. Educational Research and Evaluation, 10(4-6), 289-301.
Artino, A. R. (2007). Motivational beliefs and perceptions of instructional quality: Predicting satisfaction with online training. Journal of Computer Assisted Learning, 24(3), 260-270.
Barker, P. (2008). Using wikis and weblogs to enhance human performance. In C. Bonk, M. Lee, & T. Reynolds (Eds.), Proceedings of World Conference on E-Learning in Corporate, Government, Healthcare, and Higher Education, 2008 (pp. 581-589). Chesapeake, VA: Association for the Advancement of Computing in Education.
Bruner, J. (1996). The culture of education. Cambridge, MA: Harvard University Press.
Butler, R. (2000). What learners want to know: The role of achievement goals in shaping information seeking, learning and interest. In C. Sansone & J. M. Harackiewicz (Eds.), Intrinsic and extrinsic motiva-tion: The search for optimal motivation and performance (pp. 161-194). San Diego, CA: Academic Press. Carini, R. M., Hayek, J. H., Kuh, G. D., Kennedy, J. M., & Ouimet, J. A. (2003). College student responses to web and paper surveys: Does mode matter? Research in Higher Education, 44(1), 1-19. Carter, L., & Salyers, V. (2015). A model for meaningful e-learning at Canadian universities. In J. Keengwee (Ed.), Handbook of research on educational technology integration and active learning (pp. 78-114). Hershey, PA: IGI Global.
Caruso, J. B., & Kvavik, R. (2005). ECAR Study of Students and Information Technology, 2005: Con-venience, connection, control, and learning. Retrieved from http://net.educause.edu/ir/library/pdf/ ers0506/rs/ERS0506w.pdf
Carvalho, A. A., & Aguiar, C. (2009). Impact of podcasts in teacher education: From consumers to producers. In I. Gibson, R. Weber, K. McFerrin, R. Carlsen, & D. A. Willis (Eds.), Proceedings of Society for Information Technology & Teacher Education International Conference, 2009 (pp. 2473-2480). Chesapeake, VA: Association for the Advancement of Computing in Education.
Centre for the Study of Learning and Performance (2004a). PedTech Student Survey. Retrieved from http://doe.concordia.ca/cslp/cslp_cms/sites/all/themes/jframe/downloads/PDF/ssurvey-mar15_02.pdf
Centre for the Study of Learning and Performance (2004b). PedTech2 Student Survey. Retrieved from http://doe.concordia.ca/cslp/cslp_cms/sites/all/themes/jframe/downloads/PDF/PedTech2_Sur-vey.pdf
Conole, G., Delaat, M., Dillon, T., & Darby, J. (2008). “Disruptive technologies”, “pedagogical innovation”: What’s new? Findings from an in-depth study of students’ use and perception of
Croteau, A.-M., Venkatesh, V., Beaudry, A., & Rabah, J. (2015). The role of information and com-munication technologies in university students’ learning experience: The instructors’ perspective. In Proceedings of the 48th Hawai’i International Conference on System Sciences (pp. 111-120). Washington, DC: IEEE Computer Society.
d’Apollonia, S., & Abrami, P. C. (1997). Navigating student ratings of instruction. American Psy-chologist, 52, 1198-1208.
Davis, F. (1989). Perceived usefulness, perceived ease of use, and user acceptance of information technology. MIS Quarterly, 13(3), 319-339.
Dron, J. (2006). Pedagogy 2.0. In R. Vasile, R. Kimari, & D. Andone (Eds.), Proceedings of the 12th NETTIES International Conference — The future of e: Advance educational technologies for a future e-Europe (pp. 27-32). Timisoara, Romania: Orizonturi Universitare.
Dron, J., & Anderson, T. (2007). Collectives, networks and groups in social software for e-learning. In T. Bastiaens & S. Carliner (Eds.), Proceedings of World Conference on E-Learning in Corporate, Govern-ment, Healthcare, and Higher Education, 2007 (pp. 2460-2467). Chesapeake, VA: Association for the Advancement of Computing in Education.
Dziuban, C., & Moskal, P. (2011). A course is a course is a course: Factor invariance in student evaluation of online, blended and face to face learning environments. Internet and Higher Education, 14(4), 236-241.
Edmunds, R., Thorpe, M., & Conole, G. (2010). Student attitudes towards and use of ICT in course study, work and social activity: A technology acceptance model approach. British Journal of Educational Technology, 43(1),1-14.
Elgort, I., Smith, A. G., & Toland, J. (2008). Is wiki an effective platform for group course work? Australasian Journal of Educational Technology, 24(2), 195-210.
Ellison, N., & Wu, Y. (2008). Blogging in the classroom: A preliminary exploration of student at-titudes and impact on comprehension. Journal of Educational Multimedia and Hypermedia, 17(1), 24. Entwistle, N., & Ramsden, P. (1983). Understanding student learning. London, United Kingdom: Croom Helm.
Evans, C., & Fan, J. (2002). Lifelong learning through the virtual university. Journal of Campus Wide Information Systems, 19(4), 127-134.
Farmer, B., Yue, A., & Brooks, C. (2008). Using blogging for higher order learning in large cohort university teaching: A case study. Australasian Journal of Educational Technology, 24(2), 123-136. Galanouli, D., Murphy, C., & Garder, J. (2004). Teachers’ perceptions of the effectiveness of ICT-competence training. Computers & Education, 43, 63-79.
Goktas, Y., & Demirel, T. (2012). Blog-enhanced ICT courses: Examining their effects on prospective teachers’ ICT competencies and perceptions. Computers & Education, 58, 908-917.
Goodyear, P., Asensio, M., Jones, C., Hodgson, V., & Steeples, C. (2003). Relationships between conceptions of learning approaches to study and students’ judgements about the value of their experiences of networked learning. The Association for Learning Technology Journal, 11(1), 17-27. Gosper, M., Malfroy, J., & McKenzie, J. (2013). Students’ experiences and expectations of technolo-gies: An Australian study designed to inform planning and development decisions. Australasian Journal of Educational Technology, 29(2), 268-282.
Hsu, H. & Wang, S. (2009). The effect of using blogs on college students’ reading performance and motivation. In T. Bastiaens, J. Dron, & C. Xin (Eds.), Proceedings of World Conference on E-Learning in Corporate, Government, Healthcare, and Higher Education, 2009 (pp. 1308-1313). Chesapeake, VA: Association for the Advancement of Computing in Education.
Jonassen, D. H., Howland, J., Moore, J., & Marra, R. M. (2003). Learning to solve problems with technology: A constructivist perspective (2nd ed.). Upper Saddle River, NJ: Merrill Prentice-Hall.
Karsenti, T., Collin, S., Dupuis, A., Villeneuve, S., Dumouchel, G. & Robin, J. P. (2012). Avantages et défis inhérents à l’usage des ordinateurs au primaire et au secondaire : 2e enquête auprès de la commission scolaire Eastern Townships. Retrieved from http://etsb.crifpe.ca/files/synthese_fre.pdf
Keengwe, J. (2007). Faculty integration of technology into instruction and students’ perceptions of computer technology to improve student learning. Journal of Information Technology Education, 6, 169-180. Kennedy, G. E., Judd, T. S., Churchward, A., Gray, K., & Krause, K. L. (2008). First year students’ experiences with technology: Are they really digital natives? Australasian Journal of Educational Technology, 24(1), 108-122.
Kirkwood, A., & Price, L. (2005). Learners and learning in the twenty-first century: What do we know about students’ attitudes towards and experiences of information and communication technologies that will help us design courses? Studies in Higher Education, 30(3), 257-274.
Kvavik, R. B., Caruso, J. B., & Morgan, G. (2004). ECAR Study of Students and Information Technology 2004: Convenience, connection, and control. Retrieved from http://net.educause.edu/ir/library/pdf/ ers0405/rs/ers0405w.pdf
Laurillard, D. (2002). Rethinking university teaching: A framework for the effective use of educational technology (2nd ed.). London, United Kingdom: Routledge.
Liu, M., Kalk, D., Kinney, L., Orr, G., & Reid, M. (2010). Web 2.0 and its use in higher education: A review of literature. In J. Sanchez & K. Zhang (Eds.), Proceedings of World Conference on E-Learning in Corporate, Government, Healthcare, and Higher Education, 2010 (pp. 2604–2615). Chesapeake, VA: Association for the Advancement of Computing in Education.
Lowerison, G., Sclater, J., Schmid, R. F., & Abrami, P. C. (2006a). Are we using technology for learning? Journal of Educational Technology Systems, 34(4), 401-425.
Lowerison, G., Sclater, J., Schmid, R. F., & Abrami, P. (2006b). Student perceived effectiveness of computer technology use in higher education. Computers & Education, 47(4), 465-489.
Luce-Kapler, R. (2007). Radical change and wikis: Teaching new literacies. Journal of Adolescent & Adult Literacy, 51(3), 214-223.
Marsh, H. W. (1987). Students’ evaluations of university teaching: Research findings, methodological issues, and directions for future research. International Journal of Educational Research, 11, 253-388. Marsh, H. W. (2007). Students’ evaluations of university teaching: A multidimensional perspec-tive. In, R. P. Perry & J. C. Smart (Ed.), The scholarship of teaching and learning in higher education: An evidence based perspective (pp. 319-384). New York, NY: Springer.
Marsh, H. W., & Roche, L. A. (2000). Effects of grading leniency and low workload on students’ evaluations of teaching: Popular myth, bias, validity, or innocent bystanders? Journal of Educational Psychology, 92, 202-228.
Matthew, K., Felvegi, E., & Callaway, R. (2009). Collaborative learning using a wiki. In I. Gibson, R. Weber, K. McFerrin, R. Carlsen, & D. A. Willis (Eds.), Proceedings of Society for Information Technology & Teacher Education International Conference, 2009 (pp. 1260-1265). Chesapeake, VA: Association for the Advancement of Computing in Education.
McLoughlin, C. & Lee, M. J. W. (2007). Social software and participatory learning: Pedagogical choices with technology affordances in the Web2.0 era. In R. Atkinson, C. McBeath, S. Soong, & C. Cheers (Eds.), ICT: Providing choices for learners and learning. Proceedings ascilite Singapore 2007. Retrieved from http://dlc-ubc.ca/dlc2_wp/educ500/files/2011/07/mcloughlin.pdf
Mendoza, S. (2009). The trinity of community: Google, Facebook and Twitter. In T. Bastiaens, J. Dron, & C. Xin (Eds.), Proceedings of World Conference on E-Learning in Corporate, Government, Health-care, and Higher Education, 2009 (pp. 3555-3562). Chesapeake, VA: Association for the Advancement of Computing in Education.
Menges, R. J., & Brinko, K. T. (1986, April). Effects of student evaluation feedback: A meta-analysis of higher education research. Paper presented at the annual meeting of the American Educational Research Association, San Francisco, CA.
Meyer, K. (2002). Quality in distance education: Focus on on-line learning. ASHE-ERIC Higher Education Report, 29(4), 1-121.
Mokhtar, I., Al Bustami, G., & Elnimeiri, A. (2009). Use of weblogs by non-native EL students: A case study in the UAE. In T. Bastiaens, J. Dron, & C. Xin (Eds.), Proceedings of World Conference on E-Learning in Corporate, Government, Healthcare, and Higher Education, 2009 (pp. 3370-3375). Chesa-peake, VA: Association for the Advancement of Computing in Education.
Molden, D. C., & Dweck, C. S. (2000). Meaning and motivation. In C. Sansone & J. M. Harackiewicz (Eds.), Intrinsic and extrinsic motivation: The search for optimal motivation and performance (pp. 131-153). San Diego, CA: Academic Press.
Murray, B. (1998). Computers can help today’s students find answers for themselves. APA Monitor,
29(10).
Ogawa, M. (2009). Complementary podcasted and face-to-face lectures: Students’ preferences and their perceived future value. In G. Siemens & C. Fulford (Eds.), Proceedings of World Conference on Educational Multimedia, Hypermedia and Telecommunications, 2009 (pp. 427-432). Chesapeake, VA: Association for the Advancement of Computing in Education.
Oliver, B., & Goerke, V. (2007). Australian undergraduates’ use and ownership of emerging tech-nologies: Implications and opportunities for creating engaging learning experiences for the Net Generation. Australasian Journal of Educational Technology, 23(2), 171-186.
Overbay, A., Patterson, A., Vasu, E., & Grable, L. (2010). Constructivism and technology use: Findings from the IMPACTing Leadership project. Educational Media International, 47(2), 1-31. Penny, A. R., & Coe, R. (2004). Effectiveness of consultation on student ratings feedback: A meta-analysis. Review of Educational Research, 74(2), 215-53.
Rabah, J. (2015). Benefits and constraints of technology integration in Quebec English Schools. Turkish Online Journal of Educational Technology, 14(2), 24-31.
Rabah, J. & Arshad-Ayaz, A. (2015). Index for ICT integration in schools: A holistic approach. In Proceedings of the IAFOR International Conference in Education, Dubai, UAE (pp.167-183). Nagoya, Japan: The International Academic Forum.
Raby, C., Karsenti, T., Meunier, H., & Villeneuve, S. (2011). Usage des TIC en pedagogie universitaire : point de vue des etudiants. Revue internationale des technologies en pédagogie universitaire, 8(3), 6-19. Rambe, P. (2015). Appraisal theory : Opportunities for social networking sites’ complementation of writing centres. In J. Keengwee (Ed.), Handbook of research on educational technology integration and active learning (pp. 358-380). Hershey, PA: IGI Global.
Salaway, G., Caruso, J. B., Nelson, M. R., & Ellison, N. (2008). The ECAR Study of Undergraduate Students and Information Technology, 2008. Retrieved from http://net.educause.edu/ir/library/pdf/ ERS0808/RS/ERS0808w.pdf
Schwartz, L., Clark, S., Cossarin, M., & Rudolph, J. (2004). Educational wikis: Features and selec-tion criteria. Internaselec-tional Review of Research in Open and Distance Learning, 5(1), 6.
Shabb, C., Stonehouse, P., Smart, K., & Gourneau, B. (2009). Reflective blogs as a tool for assess-ment of student learning. In I. Gibson, R. Weber, K. McFerrin, R. Carlsen, & D. A. Willis (Eds.), Proceedings of Society for Information Technology & Teacher Education International Conference, 2009 (pp. 184-189). Chesapeake, VA: Association for the Advancement of Computing in Education. Smith, S. M. (1997). Preparing faculty for instructional technology: From education to development to creative independence. Cause / Effect, 20, 36-40.
Sun, P., Tsai, R., Finger, G., Chen, Y., & Yeh, D. (2008). What drives a successful e-Learning? An empirical investigation of the critical factors influencing learner satisfaction. Computers & Educa-tion, 50, 1183-1202.
Tabachnik, B., & Fidell, L. S. (2012). Using multivariate statistics (6th ed.). Upper Saddle River, NJ:
Pearson.
Tang, T. L.-P., & Austin, M. J. (2009). Students’ perceptions of teaching technologies, application of technologies, and academic performance. Computers & Education, 53(4), 1241-1255.
Tsai, I.-C., Laffey, J. M., & Hanuscin, D. (2010). Effectiveness of an online community of practice for learning to teach elementary science. Journal of Educational Computing Research, 43(2), 225-258. doi:10.2190/EC.43.2.e

![TABLE 6. Factors predicting composite variable of students’ perceptions of global course effectiveness (N = 14,928, predicted variable: students’ perceptions of course effectiveness [composite])](https://thumb-eu.123doks.com/thumbv2/123doknet/14769873.590418/17.648.104.553.146.811/predicting-composite-perceptions-effectiveness-predicted-perceptions-effectiveness-composite.webp)