HAL Id: hal-00304727
https://hal.archives-ouvertes.fr/hal-00304727
Submitted on 1 Jan 2002HAL is a multi-disciplinary open access archive for the deposit and dissemination of sci-entific research documents, whether they are pub-lished or not. The documents may come from teaching and research institutions in France or abroad, or from public or private research centers.
L’archive ouverte pluridisciplinaire HAL, est destinée au dépôt et à la diffusion de documents scientifiques de niveau recherche, publiés ou non, émanant des établissements d’enseignement et de recherche français ou étrangers, des laboratoires publics ou privés.
SO42? deposition in two streams in Nova Scotia
H. Laudon, T. A. Clair, H. F. Hemond
To cite this version:
H. Laudon, T. A. Clair, H. F. Hemond. Long-term response in episodic acidification to declining SO42? deposition in two streams in Nova Scotia. Hydrology and Earth System Sciences Discussions, European Geosciences Union, 2002, 6 (4), pp.773-781. �hal-00304727�
Long-term response in episodic acidification to declining SO42– deposition in two streams in Nova Scotia
Hydrology and Earth System Sciences, 6(4), 773–781 (2002) © EGS
Long-term response in episodic acidification to declining SO
42–deposition in two streams in Nova Scotia
Hjalmar Laudon
1,2,, Thomas A. Clair
3and Harry F. Hemond
11Ralph M. Parsons Laboratory, Department of Civil and Environmental Engineering, MIT, Cambridge, MA, 02139, USA 2Present address: Department of Forest Ecology, Swedish University of Agricultural Sciences, 901 83 Umeå, Sweden 3Environment Canada, Atlantic Region, PO Box 6227, Sackville, N. B. E4L 1G6, Canada
E-mail for corresponding author: [email protected]
Abstract
Trends in anthropogenically driven episodic acidification associated with extended winter snow melt/rain episodes between 1983 and 1998 were investigated for two streams in Nova Scotia, Canada. The anthropogenic contribution to Acid Neutralization Capacity (ANC) was analysed using the Boreal Dilution Model (Bishop et al., 2000) modified by applying a sea-salt correction to all input hydrochemistry. The anthropogenic contribution to episodic ANC decline was statistically significant and strongly correlated with the decline in acid deposition, which decreased by approximately 50% during the period of record. Sensitivity analysis demonstrated that the BDM can be applied to surface waters with sea-salt contributions although the correction increases model uncertainty. Results of this study demonstrate the effectiveness of reduced emissions in North America in the last decades in decreasing the severity of episodic acidification in the Atlantic region of Canada.
Keywords: episodic acidification, acidification recovery, Nova Scotia, snowmelt, winter
Introduction
Recent studies of surface waters in northeastern United States and Western Europe have demonstrated Acid Neutralization Capacity (ANC) recovery toward pre-industrial values in response to declining acid deposition, but the rate is slow (Stoddard et al., 1999; Evans et al., 2001; Skjelkvåle et al., 2001) and does not always correlate with the change in deposition (Newell and Skjelkvåle, 1997). Most previous studies of acidification recovery, including those undertaken within the framework of the International Co-operative Programme on Assessment of Rivers and Lakes (ICP-waters (Stoddard et al., 1999)) and the European Commission’s Environment and Sustainable Development Programme (RECOVER: 2010 (Ferrier et al., 2001)), have been based on monthly to yearly sampling frequency. However, the ecological significance of acidification recovery may lie primarily in explaining the episodic intensity of reductions in ANC associated with snow melt and rain storm, rather than in the increase of annual ANC values.
The timing, duration and extent of decline in ANC and pH is of particular importance during snow melt because spring is a period when many aquatic species are at sensitive stages of their life cycle (Vanoffelen et al., 1994). Thus, snowmelt-induced episodic acidification has been studied in regions associated with intensive spring flood (Molot et al., 1989; Campbell et al., 1992; Eshleman et al., 1995; Laudon et al., 2000, 2001).
However, many high- and mid-latitude regions with strong marine influence do not undergo discrete snow-melt episodes in spring. Instead, these regions often experience extensive runoff episodes lasting several months, caused by intermittent snow melt and rainfall periods. Although less studied, anthropogenic acidification associated with such extended runoff events can constitute an environmental threat in regions such as coastal areas of northwestern Europe and northeastern North America.
Southwestern Nova Scotia (SWNS) is a region known to suffer from acidification-related decline in Atlantic Salmon populations (Watt, 1987). From mid-autumn to late spring
this region experiences frequent acid pulses (Clair et al., 2001), causing episodes of water chemistry that can be toxic for Atlantic Salmon (Lacroix and Townsend, 1987; Lacroix and Korman, 1996).
Several physical characteristics make the surface waters of SWNS susceptible to acidification. Firstly, the waters have low natural levels of base cations and buffering capacity due to regional geology. Secondly, the region is surrounded by the Atlantic Ocean and the Bay of Fundy, which give rise to high concentrations of sea-salt in precipitation. Although these neutral salts do not alter the acid-base chemistry of the surface waters directly, they are involved in ion exchange processes which tend to deplete soils of base cations through exchange reaction of sea-salt sodium (Thompson, 1982). Finally, because of the low topographic relief, the area contains wetlands (Clair et al., 1994), which can result in locally high natural dissolved organic carbon concentration (DOC) and thus high levels of natural organic acids, which further depress stream water pH.
Because multiple factors influence the acid-base chemistry of Nova Scotian waters, it is difficult to separate the role of acid deposition from that of natural variability in surface water chemistry. To separate the response in surface water chemistry to acid deposition from natural variability during the extended winter episodes, the Boreal Dilution Model (BDM) (Bishop et al., 2000; Laudon, 2000) was used. The objective was to determine if the two- decade- long decline in acid deposition measured in Nova Scotia (Clair et al.,
2002) has resulted in measurable surface water chemistry improvements during winter episodes in the region. To do this, the BDM was modified to account for marine proximity and the sensitivity of this modified model was tested.
Field sites and sampling
Precipitation in SWNS is quite variable, being derived both from storms originating in areas that are major sources of acidic contaminants, such as the East coast of the United States and central North America, and from storms arriving from the open ocean, which contribute minimal acid loads (Shaw, 1979). Kejimkujik National Park currently receives between 10 and 14 kg ha–1 of sea-salt-corrected SO
4 2– and
approximately 10 kg ha–1 of NO
3– per annum (Beattie et al.,
2000).
The region is influenced by a cool, temperate climate with a mean annual precipitation of 1352 mm, of which 56% occurs between November and April. Total snow amounts average 169 mm in water equivalents, somewhat more than 10% of total precipitation. Because of its proximity to the Atlantic Ocean (approximately 60 km), rain often occurs during the winter months when soils are frozen and snow-covered. This generates a high number of runoff events superimposed on a generally high winter discharge. Total runoff averages approximately 1000 mm per year.
Two streams in the Kejimkujik National Park in SWNS (Fig. 1), were studied, using weekly stream water chemistry data collected from 1983 to 1998. The Mersey River is a
Study
area
Long-term response in episodic acidification to declining SO42– deposition in two streams in Nova Scotia
4th order stream, draining a 297 km2 area of conifer and
mixed hardwood forests. Moose Pit Brook is a 17 km2 basin
similar to the Mersey River catchment. The basins are influenced minimally by human activity, though some logging is done in both. The bedrock is either granite or slate, both of which are resistant to weathering, resulting in low buffer capacity of soils and surface waters. Although wetlands occupy less than 1% of the surface area in both basins (Yanni, 1996), both the Mersey River and Moose Pit Brook have abundant wetlands along the stream edges. This causes stream DOC concentrations greater than 10 mg L–1
in Moose Pit through most of the year, and averaging 7 mg L–1 for the Mersey. Mean annual pH values are around
5.0 for both streams, with extensive seasonal and daily fluctuations (Freedman and Clair, 1987).
Both study streams were sampled on a weekly or more frequent basis from 1982 to 1999, except for a two-month sampling break in the winter of 1993 in the Mersey River. Water samples were analysed for major ions, dissolved organic carbon (DOC), and nitrate at an Environment Canada’s laboratory in Moncton, New Brunswick (Table 1). Sea-salt-correction was made for all major ions, using ion to chloride ratios (SO42–/Cl–, Mg2+/Cl–, Ca2+/Cl–, Na+/Cl–, K+/
Cl–) of sea water (Watt et al., 1979) and assuming that all
chloride is of marine origin.
Evaluation of long-term and episodic
response
To evaluate the hydrochemical response to the decline in acid deposition, the winter runoff was separated into four phases:
z The baseflow phase, defined here as the period with
the lowest runoff during the summer/autumn. This phase occurred between August and October and generally consisted of a flow of less than 10% of peak flow. In most of the episodes studied the baseflow phase was the average chemistry of 8 to 15 samples (the average number of samples was 12 per episode).
z The initiation phase was defined as the period between baseflow and peak flow. The number of samples in this phase averaged 40 samples per episode.
z The peak flow phase was defined as the average of the
10 most acid consecutive samples. This period generally occurred in March or early April.
z The recovery phase was defined as the period following peak flow phase until ANC returned close to baseflow levels, generally in the beginning of June. This phase included, on average, 18 samples per episode. The significance of average trends in the stream water chemistry during the four phases was analysed using a modified Seasonal Kendall analysis (Loftis et al., 1991). For the magnitude of the trend, the slope was calculated based on the average chemistry of each phase (Helsel and Hirsch, 1992). The test is non-parametric and is used to identify monotonic long-term trends. The slope and significance of average trends were calculated for ANC, discharge, pH, DOC, anions (NO3–, SO
42–), individual base
cations (Mg2+, Ca2+, Na+, K+) and for the sum of base cations
(BC). ANC is calculated as the difference between the sum of base cations and strong mineral acid anions. All tests were carried out on sea-salt-corrected stream water chemistry
The driving mechanisms of episodic ANC decline were separated into natural and anthropogenic components using a modified version of the Boreal Dilution Model (BDM) (Bishop et al., 2000; Laudon, 2000). Because of the large marine influence, the BDM was modified by applying a sea-salt-correction to all of the input hydrochemistry. The model with this correction applied was designated BDMs. The BDMs was used on the initiation, peak flow, and recovery phases separately to evaluate differences in driving forces of the ANC decline during different stages of the episodes. The BDMs is based on the observed ANC (ANC(obs, t) (Eqn. 1) and a dilution index (DI(t); Eqn. 2) at any time “t” during Table 1. Average peak flow–base flow concentrations for
the study streams. All concentrations are sea-salt-corrected. Base flow – peak flow MOOSEPIT ANC µeq L-1 109 – 8 DOC mg L-1 26 – 8 SO42-µeq L-1 34 – 44 Mg2+µeq L-1 40 – 12 Ca2+µeq L-1 59 – 26 Na+µeq L-1 35 – 5 K+µeq L-1 9 – 8 MERSEYRIVER ANC µeq L-1 35 – 2 DOC mg L-1 10 – 6 SO42-µeq L-1 34 – 35 Mg2+µeq L-1 11 – 4 Ca2+µeq L-1 39 – 29 Na+µeq L-1 14 – 4 K+µmeq L-1 5 – 4
the flow event.
ANC(obs, t) = 2*[Ca2+]
(t)+2*[Mg2+](t)+[Na+](t)+[K+](t)–
2*[SO42-]
(t )– [NO3-](t)
= BC(t) – ANSA(t) (1)
∆I(t) = BC(t) / BC(base) (2)
The ∆I is calculated using the sum of base cations (BC = 2*[Ca2+] + 2*[Mg2+] + [Na+] + [K+]), which simulates the
natural dilution of both BC and the anthropogenically significant anions of strong mineral acids (ANSA = 2*[SO42]
+ [NO3–]) during runoff episodes. The natural, pre-industrial
ANC (ANC(preind, t)) is predicted using Eqn. 3. The difference between the predicted pre-industrial ANC(preind, t) (Eqn. 3) and the observed ANC(obs, t) (Eqn. 1) is interpreted as the human influence on the ANC (∆ANC(poll, t), Eqn. 4) during the episode.
ANC(preind, t) = DI(t) * (BC(base) – ANSA(base)) (3) ∆ANC(poll, t) = ANC(preind, t) - ANC(obs, t) (4)
Because the purpose of modelling was limited to determining the changes in ∆ANC(poll, t) of runoff episodes,
it was not necessary to satisfy all of the assumptions that must be invoked in modelling natural pH decline in the original BDM (Bishop et al., 2000). However, one assumption that must be fulfilled in this use of BDMs is that the sum of base cations can be used as a surrogate for the natural dilution of ANC. Therefore, the potential effects of marine proximity on the dilution index are tested and discussed.
Results and discussion
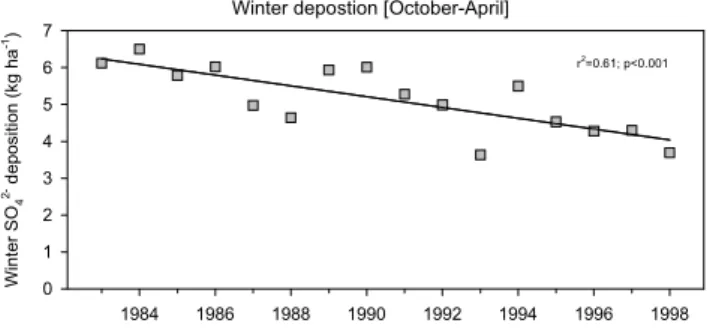
The total winter deposition of SO42– (October-April)
declined by approximately 50% in the region during the last two decades (r2=0.61; p<0.001; Fig. 2). Winter
precipitation, deposition of NO3-, Cl–, sea-salt-corrected
Ca2+, Mg2+, K+ and Na+ in precipitation demonstrated no
significant change during the same time period (p>0.1). The marine proximity of the study catchments leads to high concentrations of Cl- and Na+ in runoff. Cl- is the
dominant anion in the two streams, with concentrations two to three times greater than SO42–, while Na+ is the dominant
cation, with levels substantially exceeding the sum of the remaining cations. According to the sea-salt-correction, 50% of BC and 24% of the SO42– in Moose Pit Brook was of
marine origin. In the Mersey River 72% of the BC and 32% of the SO42– originated from the sea.
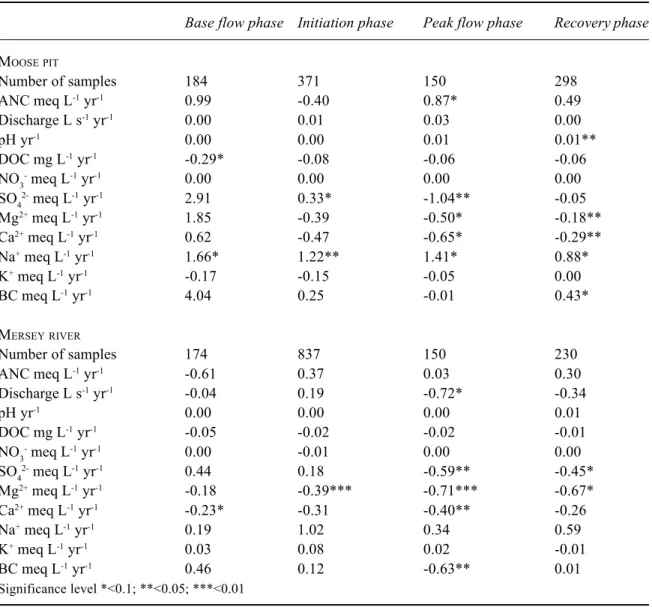
During the baseflow phase, few statistically significant
trends were observed over the study period (Table 2). Statistically significant trends were found, however, during the peak flow phase, with decreasing SO42– in both streams.
In Mersey River, the decline in SO42– was accompanied by
a decrease in base cations (mainly Mg2+ and Ca2+),
preventing a change in ANC. In Moose Pit Brook, the decline in SO42– generated a weakly significant increasing
trend in ANC, as the decreasing trends of Mg2+ and Ca2+
were counteracted by an increase in Na+.
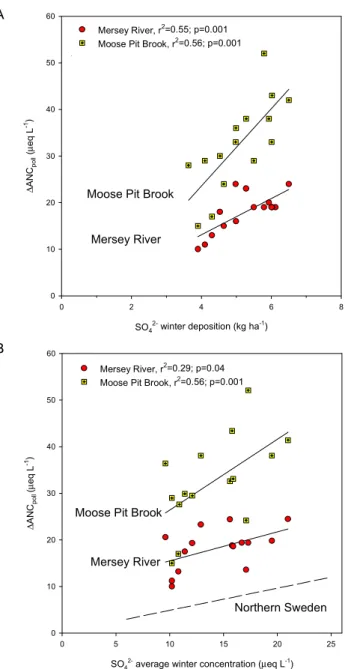
The anthropogenic contribution to the ANC decline, ∆ANC(poll), was in general largest during the peak flow phase
(Fig. 3). ∆ANC(poll) during peak flow declined substantially
since the initiation of the monitoring programme in the early 1980s. The magnitude of this anthropogenic contribution during the episodes, for both streams, was well correlated with both total deposition of SO42- and concentration of SO
4
2-in precipitation (Fig. 4). The anthropogenic contribution to seasonal ANC decline was significantly larger at Moose Pit Brook than at the Mersey River. The strong correlation between ∆ANC(poll) and winter deposition of SO42– suggests
that the winter hydrochemistry responds directly and rapidly to changes in the deposition of SO42–. Despite relatively high
deposition of NO3–, nitrogen appears to have limited effect
on the hydrochemistry of the two streams, as the terrestrial ecosystems currently prevent NO3– leakage from the
catchments (e.g. Hemond and Eshleman, 1984).
A similarly strong correlation between ∆ANC(poll) and the deposition of SO42– has been recorded for spring snow melt
episodes in northern Sweden (Laudon and Hemond, 2002); although different in magnitude, the general trend between winter S concentration and ∆ANC(poll) was similar to that found in the present study (Fig. 4). Average winter concentration in deposition was similar in magnitude between the two regions, but an approximately two to three times higher winter precipitation led to deposition loads being two to three times higher in Nova Scotia. The difference in response between the Mersey River and Moose Pit Brook could be caused by catchment size. Because
Winter depostion [October-April]
1984 1986 1988 1990 1992 1994 1996 1998 Wi nt er S O4 2- d epos iti on (k g ha -1) 0 1 2 3 4 5 6 7 r2=0.61; p<0.001
Fig. 2. Winter bulk SO42- deposition at the field sites during
Long-term response in episodic acidification to declining SO42– deposition in two streams in Nova Scotia
Table 2. Average annual trends in baseflow, initiation, peak flow and recovery phases during the period 1983–1998
Base flow phase Initiation phase Peak flow phase Recovery phase MOOSEPIT Number of samples 184 371 150 298 ANC meq L-1 yr-1 0.99 -0.40 0.87* 0.49 Discharge L s-1 yr-1 0.00 0.01 0.03 0.00 pH yr-1 0.00 0.00 0.01 0.01** DOC mg L-1 yr-1 -0.29* -0.08 -0.06 -0.06 NO3- meq L-1 yr-1 0.00 0.00 0.00 0.00 SO42- meq L-1 yr-1 2.91 0.33* -1.04** -0.05 Mg2+ meq L-1 yr-1 1.85 -0.39 -0.50* -0.18** Ca2+ meq L-1 yr-1 0.62 -0.47 -0.65* -0.29** Na+ meq L-1 yr-1 1.66* 1.22** 1.41* 0.88* K+ meq L-1 yr-1 -0.17 -0.15 -0.05 0.00 BC meq L-1 yr-1 4.04 0.25 -0.01 0.43* MERSEYRIVER Number of samples 174 837 150 230 ANC meq L-1 yr-1 -0.61 0.37 0.03 0.30 Discharge L s-1 yr-1 -0.04 0.19 -0.72* -0.34 pH yr-1 0.00 0.00 0.00 0.01 DOC mg L-1 yr-1 -0.05 -0.02 -0.02 -0.01 NO3- meq L-1 yr-1 0.00 -0.01 0.00 0.00 SO42- meq L-1 yr-1 0.44 0.18 -0.59** -0.45* Mg2+ meq L-1 yr-1 -0.18 -0.39*** -0.71*** -0.67* Ca2+ meq L-1 yr-1 -0.23* -0.31 -0.40** -0.26 Na+ meq L-1 yr-1 0.19 1.02 0.34 0.59 K+ meq L-1 yr-1 0.03 0.08 0.02 -0.01 BC meq L-1 yr-1 0.46 0.12 -0.63** 0.01 Significance level *<0.1; **<0.05; ***<0.01
smaller streams have a shorter transit time of water, they may experience more rapid response to changes in deposition. This, however, was not seen in studies in northern Sweden (Laudon, 2000; Laudon et al., 2001; Laudon and Hemond, 2002), where catchments ranging in size over several orders of magnitude responded similarly to changes in SO42– deposition.
One important difference between the northern Sweden sites and the two catchments reported here lies in the nature of antecedent conditions. Winter high-flow episodes in the Nova Scotia streams were generally preceded by rainfall, whereas the springtime high flow episodes in northern Sweden were preceded by four to six months of winter conditions with thick snow packs and at least partly frozen soils. Laudon and Hemond (2002) suggested that the strong correlation between ∆ANC(poll) and winter SO42– deposition
in northern Sweden implies that previously deposited sources of SO42– are relatively unimportant during spring
flood episodes, possibly due to cold soil temperatures resulting in slow reaction kinetics in the soil. Because the preceding conditions in Nova Scotia are warmer and wetter than in northern Sweden the soil influence during the winter episode could be more important.
Despite a significant declining trend in ∆ANC(poll) during
winter episodes, only limited changes in the average peak flow chemistry were observed over the study period (Table 2). This difference between the statistical approach to study average peak flow chemistry trends and the BDMs is due to the natural inter-annual variability in the stream water chemistry caused by differences in base flow chemistry and variability in precipitation and runoff patterns. The strength of the BDMs is that it reduces the natural variability in the
decline in ANC into “natural” and “anthropogenic” sources, which is not possible using the statistical approach (Laudon and Hemond, 2002).
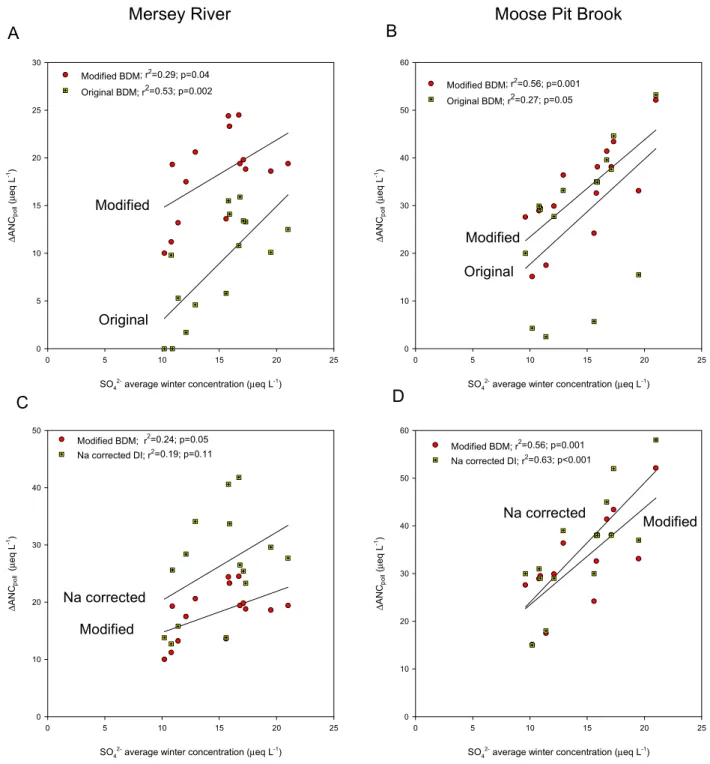
MODEL UNCERTAINTY
The most prominent difference between northern Sweden, where the BDM has previously been used and tested, and the two streams in Nova Scotia is the marine influence. Despite the fact that the sea-salt-correction of the hydrochemistry does not alter the calculated ANC, a significant difference in ∆ANC(poll) (at 95% confidence interval) is generated, depending on the model used (Fig. 5 A and B). The significant difference between the BDMs and the original BDM (Bishop et al., 2000) is due to a change in
dilution pattern caused by the sea-salt-correction. The larger decrease in BC generates a larger change in the dilution from base flow to peak flow compared to the change in the SO42– dilution, which increases the calculated ∆ANC
(poll).
A complication in assessing ∆ANC(poll) in the two streams is
that the sea-salt-correction occasionally produces negative values of Na+ during winter episodes. Assuming that the
sea-salt-correction of major chemical constituents should be in equal proportions to sea water (Watt et al., 1979;
SO42- winter deposition (kg ha-1) 0 2 4 6 8 ∆ AN Cpol l (µ eq L -1) 0 10 20 30 40 50 60 Mersey River, r2=0.55; p=0.001
Moose Pit Brook, r2=0.56; p=0.001
Mersey River Moose Pit Brook
SO42- average winter concentration (µeq L-1)
0 5 10 15 20 25 ∆ AN Cpol l (µ eq L -1) 0 10 20 30 40 50 60 Mersey River, r2=0.29; p=0.04
Moose Pit Brook, r2=0.56; p=0.001
Moose Pit Brook
Mersey River
Northern Sweden
A
B
Fig. 3. The ∆ANC(poll) of initiation, peak flow, and recovery phases, calculated using BDMs. The whiskers denote
one standard deviation.
Fig. 4. A). Correlation between SO42- winter deposition (kg-S ha-1)
and ∆ANC(poll). B). Correlation between SO42- average winter
concentration in precipitation (meq L-1) and ∆ANC
(poll). The range
and correlation in Northern Sweden is also shown (Laudon and Hemond, 2002). Mersey River Year 1984 1986 1988 1990 1992 1994 1996 1998 ' AN Cpo ll (P eq L -1 ) 0 10 20 30 40 Initiation phase; r2 =0.18; p=N.S Peak phase; r2 =0.48; p=0.004 Recovery phase;r2=0.34; p=0.02
Moose Pit Brook
Year 1984 1986 1988 1990 1992 1994 1996 1998 ' ANC po ll (P eq L -1 ) 0 10 20 30 40 50 60 Initiation phase; r2=0.18; p=N.S Peak phase; r2=0.60; p=0.001 Recovery phase;r2 =0.22; p=0.08
Long-term response in episodic acidification to declining SO42– deposition in two streams in Nova Scotia
Thompson, 1982), a likely reason for corrected Na+
becoming negative is a difference in residence time of Na+
and Cl–. This could arise from ion exchange buffering of
sodium in the catchment soils (Neal and Kirchner, 2000), and is also consistent with the observation of more strongly dampened Na+ signals during the peak flow phase. The
exchange buffering of Na+ suggests that some excess Cl–
Mersey River
Moose Pit Brook
SO4
2- average winter concentration (
µeq L-1) 0 5 10 15 20 25 ∆ ANC po ll (µ eq L -1) 0 10 20 30 40 50 60 Modified BDM; r2=0.56; p=0.001 Original BDM; r2=0.27; p=0.05 SO4
2- average winter concentration (
µeq L-1) 0 5 10 15 20 25 ∆ANC po ll (µ eq L -1) 0 5 10 15 20 25 30
SO42- average winter concentration (
µeq L-1) 0 5 10 15 20 25 ∆ ANC po ll (µ eq L -1) 0 10 20 30 40 50 60
SO42- average winter concentration (
µeq L-1) 0 5 10 15 20 25 ∆ANC p oll (µ eq L -1) 0 10 20 30 40 50 Modified BDM; r2=0.24; p=0.05 Na corrected DI; r2=0.19; p=0.11
A
B
C
D
Modified BDM; r2=0.29; p=0.04 Original BDM; r2=0.53; p=0.002 Modified Original Na corrected Modified Modified Na corrected Modified Original Modified BDM; r2=0.56; p=0.001 Na corrected DI; r2=0.63; p<0.001Fig. 5. Sensitivity analyses comparing the output of BDM and BDMs (panels A and B). Panels C and D are outputs of BDMs using the further assumption that Cl- behaves as strong anthropogenic acid anion. Note the difference in scale
reaching the stream is co-transported with other base cations or with alternative cations such as protons, which would generate sea-salt induced acid surges (Wright et al., 1988; Heath et al., 1992).
If the excess Cl–, not balanced by Na+, is instead associated
with other base cations, such as Ca2+, then Cl– behaves as
assumed to be. On the other hand, if the excess Cl– is
associated with protons, originating from anthropogenic deposition, as a result of exchange reactions in the soil, then the excess Cl– behaves as an anthropogenically derived
strong acid anion. To test the sensitivity of the BDMs, the maximum Cl– excess co-transport of anthropogenic protons
was added to the model, assuming that the natural
non-marine Na+ concentration is zero (Fig. 5 C and D).
Computationally this is done by extracting the effect of Na+
on the dilution pattern of DI, which eliminates the effect caused by the difference in residence time between Cl– and
Na+ on the calculated ∆ANC
(poll). In the Mersey River,
∆ANC(poll) increases on average by 36% as a result, while
the increase in Moose Pit Brook is 8%. This difference, as well as the one in Fig. 5 C and D, shows the maximum potential effect of Cl– excess co-transport of anthropogenic
protons; part of the difference between the Na+ corrected
and the BDMs probably is made up by other base cations (see above) or naturally derived protons in the catchment. Despite the uncertainty associated with asynchrony of Cl–
and Na+ on the modelled ∆ANC
(poll) , the trend in recovery
due to a decline in SO42- deposition remains essentially
unaffected.
Compared to spring flood episodes in northern Sweden, where the BDM has previously been used, the winter episodes of Nova Scotia last for several months. Because the definition of peak flow was set arbitrarily to the ten most acid consecutive samples, a test of sensitivity to the length of this phase was carried out. In varying the number of samples in the peak flow phase from 3 to 20, results did not differ significantly (at the 95% confidence interval) until the number of samples exceeded 15 (or duration exceeded four weeks, on average). For individual years, the difference was in a few instances significant statistically when a sample size of three was chosen, although the general trend remained the same.
Because the BDMs has been applied uniformly to all episodes, uncertainty associated with model output would likely affect each episode similarly, with the observed recovery trend remaining even if the absolute levels were somewhat affected. Thus, although some uncertainty remains, it will not likely alter the conclusion that the decline in SO42– deposition has decreased the anthropogenically
driven ANC drop during spring flood episodes in these catchments. In summary, this study concludes that reduced emissions in North America have led to a rapid improvement in the anthropogenic component of acidity associated with spring floods. This study also indicates that the BDM can be usefully applied to surface waters of marine proximity, with caution about the sensitivity to sea-salt-corrections.
Acknowledgement
The Wallenberg foundation is thanked for financial support of HL as a postdoctoral researcher at MIT. Sample collection was funded by Environment Canada’s acid precipitation program
References
Beattie, B.L., Keddy, K.N. and Knox, A., 2000. Trends in acid
deposition in the Atlantic Provinces (1980-1997). MSC-Atlantic
2000-01, Environment Canada - Atlantic Region, Dartmouth, NS, Canada.
Bishop, K.H., Laudon, H. and Köhler, S., 2000. Separating the natural and anthropogenic components of spring flood pH decline: A method for areas that are not chronically acidified.
Water Resour. Res., 30, 1873–1889.
Campbell, P.G.C., Hansen, H.J., Dubreuil, B. and Nelson, W.O., 1992. Geochemistry Of Quebec North Shore Salmon Rivers During Snowmelt - Organic-Acid Pulse and Aluminum Mobilization. Can. J. Fish. Aquat. Sci., 49, 1938–1952. Clair, T.A., Pollock, T.L. and Ehrman, J.M., 1994. Exports of
Carbon and Nitrogen from River Basins in Canadas Atlantic Provinces. Global Biogeochem. Cy., 8, 441–450.
Clair, T.A., Bobba, A.G. and Miller, K., 2001. Yearly changes in the seasonal frequency and duration of short-term acid pulses in some Nova Scotia, Canada streams. Environ. Geol., 40, 582– 591.
Clair, T.A., Ehrman, J.M., Ouellet, A.J., Brun, G.L., Lockerbie, D.M. and Ro, C.-U., 2002. Changes in freshwater acidification trends in Canada’s Atlantic Provinces: 1983-1997. Water Air
Soil Pollut., 135, 335–354.
Eshleman, K.N., Davies, T.D., Tranter, M. and Wigington, P.J., 1995. A 2-Component mixing model for predicting regional episodic acidification of surface waters during spring snowmelt periods. Water Resour. Res., 31, 1011–1021.
Evans, C.D., Cullen, J.M., Alewell, C., Kopacek, J., Marchetto, A., Moldan, F., Prechtel, A., Rogora, M., Vesely, J. and Wright, R., 2001. Recovery from acidification in European surface waters. Hydrol. Earth Syst. Sci., 5, 283–297.
Ferrier, R.C., Jenkins, A., Wright, R.F., Schopp, W. and Barth, H. 2001. Assessment of recovery of European surface waters from acidification 1970–2000: An introduction to the Special Issue.
Hydrol. Earth Syst. Sci., 5, 274–282.
Freedman, B. and Clair, T.A., 1987. Ion mass balances and seasonal fluxes from 4 aidic Brownwater streams in Nova-Scotia. Can.
J. Fish. Aquat. Sci., 44, 538–548.
Heath, R.H., Kahl, J.S., Norton, S.A., and Fernandez, I.J., 1992. Episodic stream acidification caused by atmospheric deposition of sea salts at Acadia National Park, Maine, United States. Water
Resour. Res., 28, 1081–1088.
Helsel, D.R. and Hirsch, R.M., 1992. Statistical measurements in
water research. Elsevier, Amsterdam.
Hemond, H.F. and Eshleman, K.N., 1984. Neutralization of acid deposition by nitrate retention at Bickford watershed, Massachusetts. Water Resour. Res. 20, 1718–1724.
Lacroix, G.L. and Korman, J., 1996. Timing of episodic acidification in Atlantic salmon rivers influences evaluation of mitigative measures and recovery forecasts. Can. J. Fish. Aquat.
Sci., 53, 589–599.
Lacroix, G.L., and Townsend, D.R., 1987. Responses of juvenile Atlantic Salmon (Salmo-Salar) to episodic increases in acidity of Nova-Scotia rivers. Can. J. Fish. Aquat. Sci., 44, 1475–1484.
Long-term response in episodic acidification to declining SO42– deposition in two streams in Nova Scotia
Laudon, H. 2000. Separating natural acidity from anthropogenic
acidification in the spring flood of northern Sweden, Silvestria
160. PhD. Swedish University of Agricultural Sciences, Uppsala.
Laudon, H. and Hemond, H.F., 2002. Recovery of streams from episodic acidification in northern Sweden. Environ. Sci.
Technol., 36, 921–928.
Laudon, H., Westling, O. and Bishop, K., 2000. Cause of pH decline in stream water during spring melt runoff in northern Sweden. Can. J. Fish. Aquat. Sci., 57, 1888–1900.
Laudon, H., Westling, O., Löfgren, S. and Bishop, K., 2001. Modeling preindustrial ANC and pH during the spring flood in northern Sweden. Biogeochemistry., 54, 171–195.
Loftis, J.C., Taylor, C.H., Newell, A.D. and Chapman, P.L., 1991. Multivariate trend testing of lake water-quality. Water Resour.
Bull., 27, 461–473.
Molot, L.A.V., Dillon, P.J. and LaZerte, B.D., 1989. Factors affecting alkalinity concentration of streamwater during snowmelt in Central Ontario. Can. J. Aquat. Sci., 46, 1658– 1666.
Neal, C. and Kirchner, J.W., 2000. Sodium and chloride levels in rainfall, mist, streamwater and groundwater at the Plynlimon catchments, mid-Wales: inferences on hydrological and chemical controls. Hydrol. Earth Syst. Sci., 4, 295–310. Newell, A.D. and Skjelkvåle, B.L., 1997. Acidification trends in
surface waters in the international program on acidification of rivers and lakes. Water Air Soil Pollut., 93, 27–57.
Shaw, R.W., 1979. Acid precipitation in Atlantic Canada. Environ
Sci. Technol. 13, 406–441.
Skjelkvåle, B.L., Mannio, J., Wilander, A. and Andersen, T., 2001. Recovery from acidification of lakes in Finland, Norway and Sweden 1990-1999. Hydrol. Earth Syst. Sci., 5, 327–337.
Stoddard, J.L., Jeffries, D.S., Lukewille, A., Clair, T.A., Dillon, P.J., Driscoll, C.T., Forsius, M., Johannessen, M., Kahl, J.S., Kellogg, J.H., Kemp, A., Mannio, J., Monteith, D.T., Murdoch, P.S., Patrick, S., Rebsdorf, A., Skjelkvåle, B.L., Stainton, M.P., Traaen, T., van Dam, H., Webster, K.E., Wieting, J. and Wilander, A., 1999. Regional trends in aquatic recovery from acidification in North America and Europe. Nature. 401, 575– 578.
Thompson, M.E., 1982. Exchange of marine sodium for calcium during chemical-weathering in the Isle Aux Morts River basin, Newfoundland. Geochim. Cosmochim. Acta, 46, 361–365. Vanoffelen, H.K., Krueger, C.C., Schofield, C.L. and Keleher,
C., 1994. Survival, distribution, and ion composition in 2 strains of Brook Trout (Salvelinus-Fontinalis) fry after exposure to episodic pH depressions in an Adirondack lake. Can. J. Fish.
Aquat. Sci., 51, 792–799.
Watt, W.D., 1987. A summary of the impact of acid-rain on Atlantic Salmon (Salmo-Salar) in Canada. Water Air Soil Pollut.,
35, 27–35.
Watt, W.D., Scott, D. and Ray, S., 1979. Acidification and other chemical changes in Halifax county lakes after 21 years. Limnol.
Oceanogr., 24, 1154–1161.
Wright, R.F., Norton, S.A., Brakke, D.F. and Frogner, T., 1988. Experimental-verification of episodic acidification of fresh-waters by sea salts. Nature. 334, 422–424.
Yanni, S., 1996. Hydrogeochemical assessment of water in forested
watersheds at Kejimkujik National Park: discharge rates, chemical composition, and ion fluxes. MSc. thesis. Univ. of New