HAL Id: hal-00304615
https://hal.archives-ouvertes.fr/hal-00304615
Submitted on 1 Jan 2001HAL is a multi-disciplinary open access archive for the deposit and dissemination of sci-entific research documents, whether they are pub-lished or not. The documents may come from teaching and research institutions in France or abroad, or from public or private research centers.
L’archive ouverte pluridisciplinaire HAL, est destinée au dépôt et à la diffusion de documents scientifiques de niveau recherche, publiés ou non, émanant des établissements d’enseignement et de recherche français ou étrangers, des laboratoires publics ou privés.
and Sweden 1990?1999
B. L. Skjelkvåle, J. Mannio, A. Wilander, T. Andersen
To cite this version:
B. L. Skjelkvåle, J. Mannio, A. Wilander, T. Andersen. Recovery from acidification of lakes in Finland, Norway and Sweden 1990?1999. Hydrology and Earth System Sciences Discussions, European Geosciences Union, 2001, 5 (3), pp.327-338. �hal-00304615�
Recovery from acidification of lakes in Finland, Norway and
Sweden 1990–1999
B.L. Skjelkvåle
1, J. Mannio
2, A. Wilander
3and T. Andersen
11 Norwegian Institute for Water Research, PB 173 Kjelsås, N-0411 Oslo, Norway 2 Finnish Environment Institute, PB.140, FIN-00251, Helsinki, Finland 3 University of Agricultural Sciences, PB 7050, S-75007 Uppsala, Sweden
Email for corresponding author: brit.skjelkvaale@niva.no
Abstract
Sulphate deposition has decreased by about 60% in the Nordic countries since the early 1980s. Nitrogen deposition has been roughly constant during the past 20 years, with only a minor decrease in the late 1990s. The resulting changes in the chemistry of small lakes have been followed by national monitoring programmes initiated in the 1980s in Finland (163 lakes), Norway (100 lakes) and Sweden (81 lakes). These lakes are partly a subset from the survey of 5690 lakes in the Northern European lake survey of 1995. Trend analyses on data for the period 1990-1999 show that the non-marine sulphate concentrations in lakes have decreased significantly in 69% of the monitored lakes. Changes were largest in lakes with the highest mean concentrations. Nitrate concentrations, on the other hand, were generally low and showed no systematic changes. Concentrations of non-marine base cations decreased in 26% of the lakes, most probably an ionic-strength effect due to the lower concentrations of mobile strong-acid anions. Acid neutralising capacity increased in 32% of the lakes. Trends in recovery were in part masked by large year-to-year variations in sea-salt inputs and by increases in total organic carbon concentrations. These changes were most probably the result of climatic variations. Nordic lakes, therefore, show clear signs of recovery from acidification. Recovery began in the 1980s and accelerated in the 1990s. Reductions in sulphur deposition are the major “driving force” in the process of recovery from acidification. Further recovery can be expected in the next 10 years if the Gothenburg protocol on emissions of acidifying pollutants is implemented.
Keywords: Nordic countries, sulphur deposition, lakes, recovery
Introduction
Acidification of rivers and lakes is a major environmental problem in the three Nordic countries, Finland, Norway and Sweden, and has resulted in lost and damaged fish stocks and reduced biodiversity. In Finland, about 470 fish populations have been lost, in Norway about 5100 populations, and in Sweden about 1200 populations of brown trout, 1100 of roach and 1100 of perch population are estimated to be lost (Rask et al., 2000). In 1995, the critical load for sulphur (S) was exceeded in 9% of the lakes in Finland (3000 lakes), 9% in Sweden (6000 lakes) and 27% in Norway (10000 lakes) (Henriksen et al., 1998).
As a result of international negotiations under the United Nation Economic Council for Europe (UN-ECE) Convention of Long-Range Transboundary Air Pollution (LRTAP) (UN-ECE, 1994) emissions of S have been
reduced by 50–60% in Europe since 1980 (EMEP 1998). This has resulted in a marked decrease in S deposition; in the Nordic countries S deposition has decreased by about 60% since early 1980s (Kulmala et al., 1998; Tørseth et al., 1999). Most of the decrease has occurred since 1990.
The three Nordic countries have extensive national networks for monitoring acid deposition and surface water quality (Johannessen, 1995; Mannio and Vuorenmaa, 1995; Wilander, 1998). Systematic monitoring of small lakes has been conducted since the late 1980s. Results from the whole Nordic region have been combined to reveal trends over the large but continuous gradients in water chemistry and deposition patterns in these three countries. Here, trends in lake water chemistry for 344 lakes in Finland, Norway and Sweden for the period 1990-1999 are presented.
Materials and methods
The data used in this work are from national monitoring programmes in Finland, Norway and Sweden (Johannessen, 1995; Mannio and Vuorenmaa, 1995; Wilander, 1998). The sampling and analytical methods are similar in the three countries.
The 163 Finnish lakes are usually (median size 10 ha) headwater or seepage lakes located in catchments with negligible agricultural activities. The lakes are acid sensitive with low base cation concentrations, low alkalinity and in some cases elevated labile aluminium (Al) concentrations. Samples are collected annually at the outlet after the autumn circulation period and analysed in the laboratories of Environmental Administration according to standardised methods (Forsius et al., 1990).
The 100 Norwegian lakes are a subset of the 1000-lake survey of 1986 (Henriksen et al., 1989) and are acid sensitive, headwater lakes on granitic or gneissic bedrock with negligible local pollution sources. Lake water samples are collected annually at the outlet after the autumn circulation period and analysed at the Norwegian Institute of Water Research (NIVA).
The 81 Swedish lakes are located mainly in forested areas with no significant sources of local pollution. Most have low ion concentrations and are thus sensitive to acidification. The lakes are sampled four times a year in the middle of the lake, but only the autumn sample is used here. All analyses are performed at the accredited laboratory at the Department of Environmental Assessment, Swedish University of Agricultural Sciences.
All calculations and presentations of sulphate (SO4) and base cations (BC) in this work are non-marine fractions. Non-marine fractions (denoted by asterisk) of SO4* and BC* in lake water are calculated under the assumptions that all chloride (Cl) in lakes is of marine origin (cyclic sea-salts) and is accompanied by other ions in the same proportions as in sea water. Non-marine base cations are taken here as the sum of non-marine calcium (Ca) + magnesium (Mg). The concentrations of organic anions (OA) are calculated from the empirical relationship between anion deficit and total organic carbon (TOC) in lakes in Norway (Brakke et
al., 1987). OA = 4 (TOC – 1), where OA is in µeq L-1 and
TOC is in mgC L-1. Acid neutralising capacity (ANC) is
defined as the equivalent sum of base cations (Ca + Mg + Na + K) minus the equivalent sum of strong acid anions (SO4 + Cl + NO3) (Reuss and Johnson, 1986). As a consequence of the ion balance (SO4 + Cl + NO3 + HCO3 + OA) = (Ca + Mg + Na + K+ H + Al), ANC can also be expressed as the equivalent sum of (HCO3 + OA) - (H + Al). Aluminium is the sum of positively-charged Al species.
Trend analysis for each lake and each relevant variable was analysed with the non-parametric tests given by Hirsch
et al., 1982, which in this particular case is equivalent to
the non-seasonal Mann-Kendall trend test and the Sen slope estimator. One limitation of the Mann-Kendall test (and its seasonal counterparts) is that it detects only monotonic trends; trends need not be linear, but they must proceed in only one direction (increasing or decreasing) to be detectable.
In brief, the Mann-Kendall test analyses the data within blocks and compares the rank value for a single observation. The signs (indicating whether the second observation in each pair-wise comparison is higher or lower than the first) for all pair-wise comparisons within each block are summed and a Z-statistic calculated as the ratio of the sum of signs divided by the standard deviation in the signs. The Mann-Kendall test does not estimate the slopes of trends, but it has become customary to associate slopes calculated according to the method of Sen (1968), which estimates the slope by calculating the median of all between-year differences in the variable of interest. A significance level of 0.05 is used in these tests. The trend analyses are performed on SO4*, NO3, Cl, BC*, ANC, H and TOC.
Results
SULPHATE
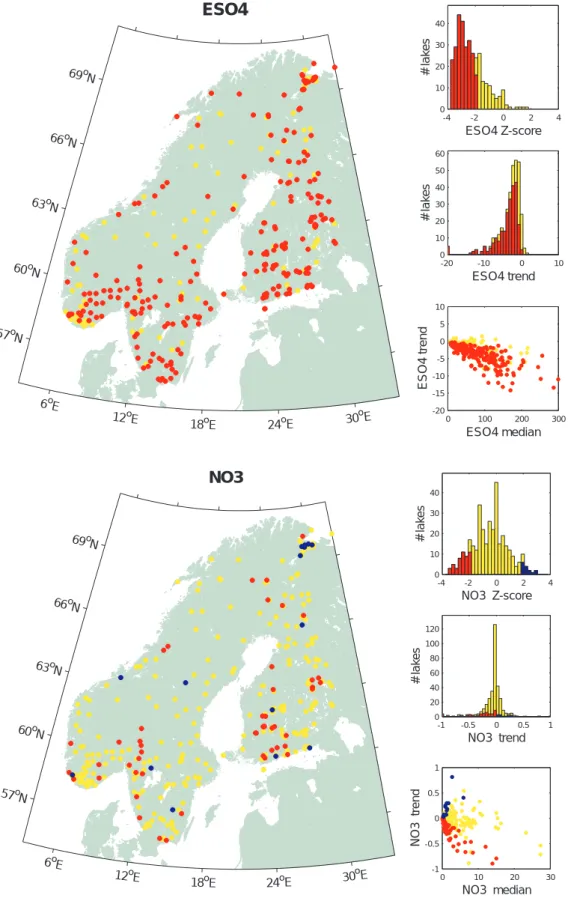
Non-marine sulphate showed significant decreases in 69% of the lakes for the period 1990–1999 (Fig. 1). The largest decreases were found in lakes with the highest concentrations, although there is a large scatter in this correlation. The majority of lakes showed yearly changes in the range from 2-7 µeq L-1 yr-1. Lakes in southernmost
Sweden had changes up to 28 µeq L-1 yr-1 (Table 1).
NITRATE
Nitrate concentrations in Nordic lakes are in general low; 95% of the lakes have median NO3 concentrations < 10 µeq L-1. Of the 17 lakes with NO
3 > 10 µeq L
-1, 15 are
situated in southwestern Norway. Nitrate trends showed a mixed picture with no regional patterns (Fig. 1). There were, however, more lakes (n=50, ~15%) with decreasing trends than increasing trends (n=15, ~4%) (Table 1), and most of these decreasing trends were in lakes in eastern Norway and Finland. The few lakes with increasing trends are scattered all over the region. There is a good correlation between median NO3 concentration and trend slope. The decrease in NO3 is most probably related to decreased nitrogen (N) deposition. The rate of change of NO3 was very small (< 1µeq L-1 yr-1) relative to changes in SO
Fig. 1. Maps of trends 1990–99 in concentrations of SO4* (upper panel) and NO3 (lower panel). Red dots show significant decreasing trends (Z-score < –1.96, p < 0.05), blue dots significant increasing trends (Z-score > 1.96, p < 0.05), while yellow dots show no trend. The plots to the right of the maps show frequency diagram of the Z-scores (upper), frequency diagram of the trend slope (middle) and correlation between
median concentration and trend slope (bottom). Units: µeq L-1. ESO4 6o E 12o E 18o E 24oE 30 oE 57o N 60o N 63o N 66o N 69o N -4 -2 0 2 4 0 10 20 30 40 ESO4 Z-score # lak es -20 -10 0 10 0 10 20 30 40 50 60 ESO4 trend # lak es 0 100 200 300 -20 -15 -10 -5 0 5 10 ESO4 median ESO4 trend NO3 6o E 12o E 18o E 24oE 30 oE 57o N 60o N 63o N 66o N 69o N -4 -2 0 2 4 0 10 20 30 40 NO3 Z-score # lak es -1 -0.5 0 0.5 1 0 20 40 60 80 100 120 NO3 trend # lak es 0 10 20 30 -1 -0.5 0 0.5 1 NO3 median NO3 trend
(Table 1). The decrease in NO3 was, therefore, of little importance for trends in ANC.
BASE CATIONS
Concentrations of BC* decreased in 26% of the lakes and increased in only 3% (Fig. 2). The changes in base cations show a regional picture with the largest frequency of decreases in Finland, less in Sweden, and only three lakes in eastern Norway. Of the 11 lakes with significant increases, seven are situated in western Norway. Most of the decrease in BC* was due to decrease in Ca. For lakes with concentrations of BC* < 200 µeq L-1, there was a significant
correlation between concentration and yearly change (r2 =
0.42). Above 200 µeq L-1, there is much scatter in the data
(Fig. 2). Lakes with a small decrease in BC* or even an increase were mainly those with low BC* concentrations and most of these lakes are situated in Norway.
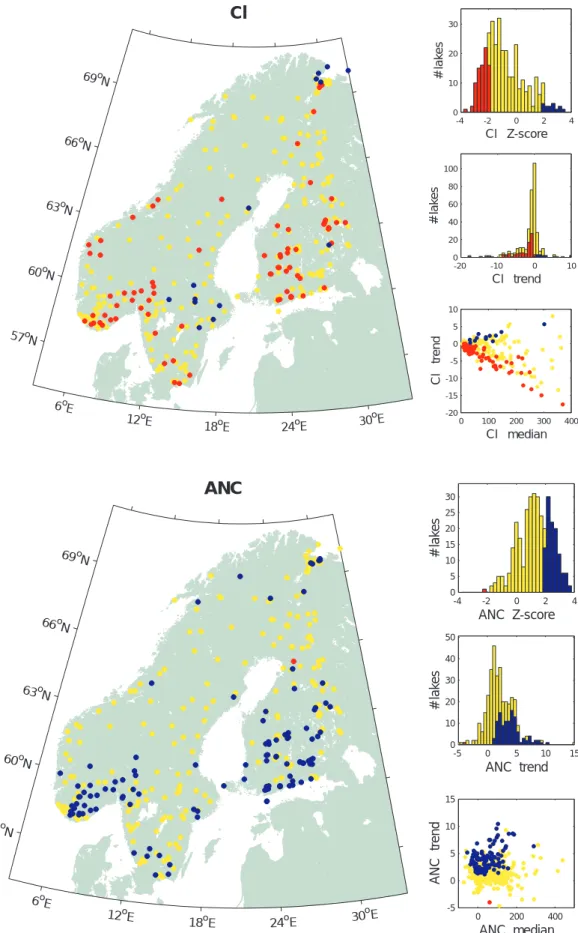
CHLORIDE
Chloride showed a significant decrease over the 10-year period in a large number of the lakes (n=82, ~ 23%) (Fig. 3). Also for Cl there is a strong correlation between median concentration and yearly decrease. The highest Cl concentrations are found in southern parts of Norway and Sweden. For most of the lakes (80%) with a significant decrease, the yearly decrease was < 5 µeq L-1, while 17 lakes
showed yearly changes in the range from 5 to 17 µeq L-1
(Table 1). A few lakes show increased Cl; these lakes are clustered in central parts of Sweden and in northeastern Norway.
ANC
There was a general increase in ANC in the Nordic lakes (n=112, 32%) (Fig.3). Only one lake showed a significant decrease. Most of the lakes with increasing ANC are in Norway and Finland. There is no good correlation between
Table 1. Percentiles of slopes for all lakes (both significant and not significant)
Finland Norway Sweden Finland Norway Sweden
SO4 µeq L-1 ANC µeq L-1
max 0.9 1.5 0.8 max 10.4 7.5 18.4 75 % -1.6 -0.6 -1.6 75 % 3.6 2.9 3.8 50 % -2.6 -1.3 -4.5 50 % 2.0 1.6 1.7 25% -4.3 -2.3 -7.9 25% 0.9 0.7 0.2 min -13.2 -8.9 -28.8 min -4.7 -2.2 -8.8 NO3 µeq L-1 H+ µeq L-1 max 0.41 1.43 0.81 max 2.45 0.33 0.04 75 % 0.00 0.02 0.05 75 % 0.00 0.00 0.00 50 % -0.01 -0.01 -0.02 50 % 0.00 -0.25 -0.02 25% -0.10 -0.14 -0.12 25% -0.13 -0.82 -0.07 min -1.53 -2.86 -1.30 min -1.50 -2.14 -3.02 Cl µeq L-1 TOC mg C L-1 max 2.8 5.7 19.2 max 1.06 0.57 0.94 75 % 0.0 0.0 1.0 75 % 0.10 0.17 0.30 50 % -0.3 -1.4 0.0 50 % 0.00 0.03 0.12 25% -0.8 -4.4 -2.7 25% -0.09 0.00 0.00 min -7.3 -13.2 -17.7 min -1.30 -0.13 -0.28 BC* µeq L-1 max 5.0 2.9 19.7 75 % 0.0 0.5 -0.5 50 % -1.3 0.1 -1.6 25% -2.6 -0.4 -4.4 min -9.0 -3.4 -25.0
Fig. 2. Maps of median concentrations (upper panel) and trends (lower panel) of non-marine calcium plus non-marine magnesium (BC*). For
colour codes and description of the plots, see caption to Fig. 1.
EBC 6o E 12o E 18oE 24oE 30 oE 57o N 60o N 63o N 66o N 69o N -4 -2 0 2 4 0 10 20 30 EBC Z-score # lak es -15 -10 -5 0 5 10 0 20 40 60 80 EBC trend # lak es 0 100 200 300 400 500 -15 -10 -5 0 5 10 EBC median EBC trend
BC*
6o E 12o E 18oE 24oE 30oE 57o N 60o N 63o N 66o N 69o N 100 101 102µeq/l
Fig. 3. Maps of trends 1990–99 in concentrations of Cl (upper panel) and ANC (lower panel). For colour codes and description of the plots,
see caption to Fig. 1.
ANC
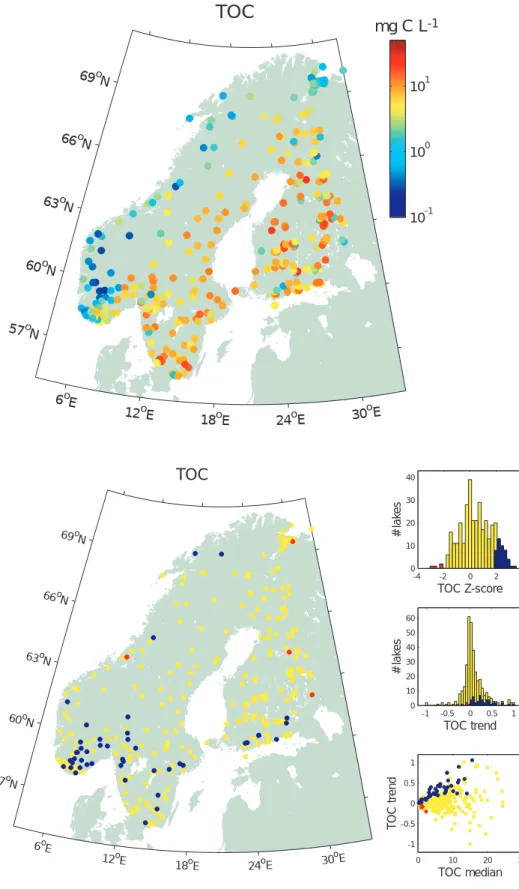
6o E 12o E 18o E 24oE 30 o E 57o N 60o N 63o N 66o N 69o N -4 -2 0 2 4 0 5 10 15 20 25 30 ANC Z-score # lak es -5 0 5 10 15 0 10 20 30 40 50 ANC trend # lak es 0 200 400 -5 0 5 10 15 ANC median ANC trend Cl 6o E 12o E 18oE 24oE 30 oE 57o N 60o N 63o N 66o N 69o N -4 -2 0 2 4 0 10 20 30 Cl Z-score # lak es -20 -10 0 10 0 20 40 60 80 100 Cl trend # lak es 0 100 200 300 400 -20 -15 -10 -5 0 5 10 Cl median Cl trendFig. 4. Maps of median concentrations (upper panel) and trends (lower panel) of TOC (BC*). For colour codes and description of the plots,
see caption to Fig. 1.
TOC 6o E 12o E 18o E 24oE 30 oE 57o N 60o N 63o N 66o N 69o N -4 -2 0 2 4 0 10 20 30 40 TOC Z-score # lak es -1 -0.5 0 0.5 1 0 10 20 30 40 50 60 TOC trend # lak es 0 10 20 30 -1 -0.5 0 0.5 1 TOC median T OC trend
TOC
6o E 12o E 18o E 24oE 30 oE 57o N 60o N 63o N 66o N 69o N 10-1 100 101 mg C L-1median ANC concentration and slope of significant trends. This is because ANC is a linear combination of base cations and Cl, SO4 and NO3 and consequently adds up all the variability (noise) in these variables.
HYDROGEN
Hydrogen decreased (pH increased) in many lakes (n=79, 23%), while only three lakes (all in Finland) showed increasing trends. The majority of lakes with decreasing trends are found in southern Norway.
TOTAL ORGANIC CARBON
Total Organic Carbon showed significant increasing trends in 12% of the lakes (Fig. 4). The lakes with significant increasing trends are located mostly in southeastern Norway, southern Sweden and in a few cases southern Finland. Most of these lakes are characterised by moderate levels of TOC (1–5 mg C L-1).
Discussion
The Nordic lakes survey in 1995 (Henriksen et al., 1998) showed that the lake water chemistry in Finland, Norway and Sweden is dominated by low ionic strength (dilute) water, with low concentrations of nutrients (N and phosphorus (P) compounds). This is due mainly to low weathering rates, low intensity of agriculture and low population density. There are differences in the lake water chemistry over the Nordic region due to differences in hydrology, precipitation chemistry and amount, soil cover and vegetation. From the west of Norway to the east of Finland, there is a gradient from high to low precipitation
and from mountainous areas with thin and patchy soils to forested areas with thick soils. This is reflected in clear water lakes with low input of nutrients, base cations and alkalinity in the western areas to brown lakes with higher concentrations of solutes in the eastern areas (Figs. 2 and 4).
Decreased deposition of SO4 since the early 1980s has clearly resulted in large decreases in SO4* concentrations in lakes. Sulphate is the major driving force in changes in water chemistry in the three Nordic countries over the time period from 1990-99. The results from the Nordic lakes fit well with the other European scale assessments (Prechtel et
al., 2001).
Nitrate showed no regional patterns of change. This also conforms with the evaluation of N trends in surface waters in Europe (Skjelkvåle et al., 2001a, Wright et al., 2001). Wright et al. (2001) conclude that the overall lack of trends in NO3 may be the result of two opposing factors; continued high deposition of N tends to increase the N saturation and give increased NO3 concentrations in run-off, whereas the decline in N deposition over the past 5–10 years should give decreased NO3 in runoff. The concentration of NO3 in the autumn is clearly connected to biological activity, therefore, the likehood of detecting trends in NO3 is low unless the trends are very strong. In addition, short and long-term variations in climate affect NO3 concentrations in streamwater and thus contribute noise which may mask subtle long-term trends (Monteith et al., 2000).
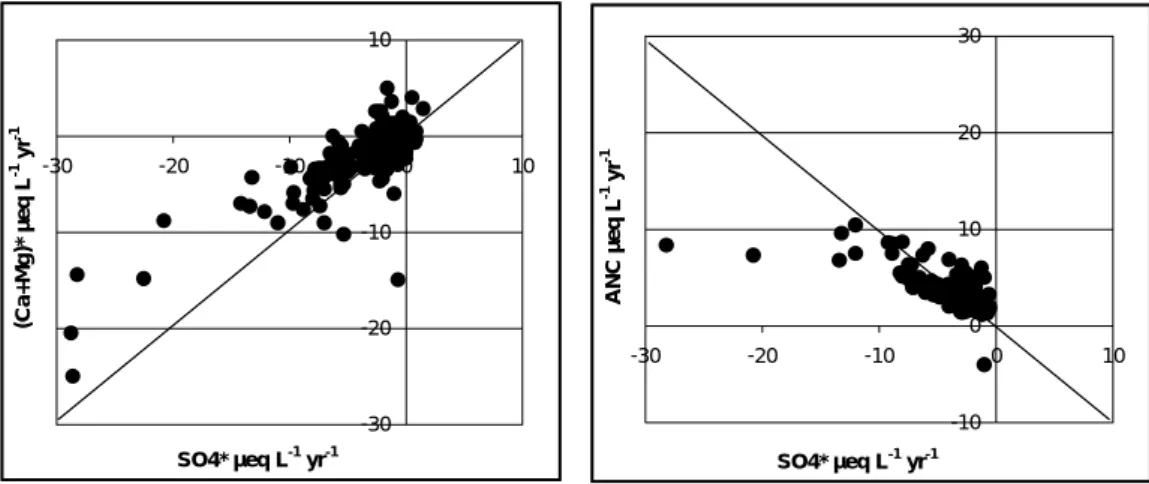
Concentrations of BC* have decreased significantly in one third of the lakes. The decreases are correlated to the decrease in SO4* (r2 = 0.69, p < 0.01) (Fig. 5). The most
likely explanation for the decrease in BC* is the effect of reduced ionic strength (the salt effect of Reuss and Johnson,
Fig. 5. Correlation between yearly changes in SO4* and BC* (left panel) and between SO4* and ANC (right
panel). Only sites with significant changes (Z-score > 1.96 or < –1.96) for both SO4* and BC* and SO4* and ANC in the respective plots are included. This means that the lakes are not exactly the same for the two diagrams. -30 -20 -10 0 10 -30 -20 -10 0 10 SO4* µeq L-1 yr-1 (Ca+Mg)* µeq L -1 yr -1 -10 0 10 20 30 -30 -20 -10 0 10 SO4* µeq L-1 yr-1 ANC µeq L -1 yr -1
(1986)); lower concentrations of mobile strong-acid anions (SO4*) result in lower concentrations of cations. In addition, declining deposition of base cations and continued depletion of base cation pools in catchment soils will contribute to decreased BC* in the lakes.
The F-factor (Henriksen, 1984) gives an estimate of the extent to which the change in SO4 is compensated by change in base cations. The F-factor is defined as the ratio of change in BC* to change in SO4*. A low F-factor indicates that a small proportion of the decrease in SO4* is compensated by a decrease in BC* and consequently, a large increase in ANC. A high F-factor indicates that most of the decrease in SO4* is compensated by a decrease in BC* with very little change in ANC.
The Nordic lakes presented here have an average F-factor of 0.65 (only lakes with significant changes in both SO4 and BC* are included in this calculation) (Fig. 5) and this suggests that BC* reductions have compensated for about 65% of SO4* reductions on average. The F-factor was developed in a situation when the acidification was increasing and it has also been a basis for calculating critical loads of acidity, e.g. the Steady-State Water Chemistry model (Henriksen et al., 1995, Henriksen and Posch, 2001). The data presented here show that the F-factor can also be used successfully to describe recovery over a 10-year period with relatively large (significant) changes.
Chloride decreased in many lakes over the 10-year period. In the Nordic countries there are two main factors that cause high Cl concentrations; influence of sea-salts, and influence of old marine deposits (combined also with evapotranspiration). Sea-salt deposition may be cyclic over several years due to such things as regular changes of the North Atlantic Oscillation (Evans et al., 2001a). Any given period of several years might be influenced by consistently declining or increasing sea-salts. The winter of 1993 in southern Norway had unusually strong storms and consequently unusually high inputs of sea-salts to lakes as much as 50 km from the coast (Hindar et al., 1994). Southern Sweden was affected by a similar event in 1989, just before the start of the observation period (Fransen, 1990). Such sea-salt-rich years had a strong influence on the trends for the 10-year period investigated. Much of the decreasing trend in Cl may be attributed to anomalous high Cl concentrations in 1993 in Norway and 1989 in Sweden. This does not, however, explain decreasing trends in some Finnish lakes; these may be due to a decline in Cl deposition. Kulmala et al., (1998) reported a 20% decrease in southern Finland from 1987 to 1996. The decrease in Cl came in addition to the decrease in SO4* and thus contributed to the increase in ANC in some lakes.
There was a widespread increase in ANC in the Nordic
lakes over the 10-year period. The increase in ANC shows a strong correlation to decrease in SO4* (r2 = 0.43, p < 0.01)
(Fig. 5). A slope of –0.36 implies that, on average, approximately 35% of the observed reduction in SO4* has led to increased ANC. As a consequence of ionic balance, these changes in ANC must be manifest as increases in OA or HCO3, or decreases in H and Al or a combination of these. Hydrogen showed a significant decrease in many of the lakes, although the rate of change was very small. Due to the use of different analytical methods in the three Nordic countries alkalinity (as measure of HCO3) and Al data are not treated in this work. Results from previous work from Finland (Mannio, 2001), Norway (Skjelkvåle et al., 2001b) and Sweden (Wilander, 1998), however, show that alkalinity has increased and Al has decreased in lakes. For lakes with pH > 5.5 the increase in alkalinity is most probably due to increase in HCO3, but the increase in TOC and decrease in Al may also contribute to the increasing alkalinity.
Total organic carbon concentrations increased in many lakes in the Nordic region from 1990–99. Similar increases in TOC have been reported from upland freshwaters in the UK (Evans and Monteith, 2001). The most likely explanation for the observed changes in TOC is regional changes in climatic factors. High TOC lakes in Finland generally show no trends in TOC and this suggests that there is presently no strong unidirectional, year-to-year hydrological or climatic factor affecting the Finnish lakes. The regional pattern of increase in TOC may also be a bi-product of recovery. Increase in TOC will contribute to the increase in ANC. The changes in TOC, however, have given rise to only small changes in OA relative to the changes in SO4*.
The general patterns described here for the Nordic region are also seen at sites throughout Europe (Evans et al., 2001b). Recovery of surface waters began to be manifest in the 1980s and has accelerated in the 1990s (Stoddard et al., 1999). Further improvements in lake chemistry can be expected in the future if the measures specified in the Gothenburg protocol to the LTRAP convention are carried out. The Gothenburg protocol will entail an 80% decrease in SO4 deposition and 50% decrease in N deposition by the year 2010 relative to the base year 1980 (UN-ECE, 1999). Measurements carried out by EMEP indicate a 20% decrease in SO4 deposition in the 1980s and a further 40% decrease in the 1990s (Tarrason and Schaug, 2000). Thus, there remains only a further 20% reduction expected to the year 2010.
Most of the recovery expected in lakes in Finland, Norway and Sweden may have already occurred. The additional 20% decrease in SO4 deposition over the next 10 years will cause additional improvements. Over the long term a
replenishment of the pools of exchangeable base cations in the soils will also give increased ANC. Dynamic models of soil and water acidification can be used to predict future trends in recovery.
Uncertainties in future recovery of Nordic lakes lie in the roles of N and climate change. In most lake-catchment systems today, the majority of inorganic inputs of N in deposition are retained. In the 1980s there was concern that the observed doubling of NO3 concentrations in Norwegian lakes might indicate that the ability to retain N was becoming depleted (Henriksen et al., 1988). The data presented here for the 1990s, however, show no further increases and thus “N saturation” appears to be a very long-term process in these areas.
Future climate change can influence acidification status and trends in lakes. Nitrate concentrations, sea-salts and TOC concentrations are clearly affected by year-to-year variations in climate. Data from the UK Acid Water Monitoring Network exemplify such relationships (Evans and Monteith, 2000).
Recovery of biological components of lake ecosystems will, of course, lag behind the recovery of water chemistry. Climatic extreme years can result in extremes of low ANC, with “setbacks” to ongoing biological recovery. At present there appear to be only a few documented cases of biological recovery in lakes in Finland, Norway and Sweden (Wilander and Lundin, 2000). Continued monitoring of acid deposition, water chemistry and key biological parameters will provide the evidence that the large-scale and dramatic reductions in emissions of S and N that have occurred in Europe over the past 20 years have indeed resulted in the desired improvements in lake ecosystems.
Acknowledgements
Data used here come from the national monitoring programmes of the Norwegian Pollution Control Authority, the Swedish Environmental Protection Board and the Finnish Environment Agency. This work was in part carried out as part of these programmes. Financial support came from the Nordic Council of Ministers (Committee on Air and Oceans), the Commission of European Communities (RECOVER:2010 project, EVK1-CT-1999-00018), the Research Council of Norway, the Norwegian Institute for Water Research and the Finnish Environment Institute.
References
Brakke, D.F., Henriksen, A. and Norton, S.A., 1987. The relative importance of acidity sources for humic lakes in Norway. Nature,
329, 432–434.
EMEP, 1998. Estimated dispersion of acidfying and euthrophying
compounds and comparisons with observations. Transboundary acidifying air pollution in Europe, Part 1, Status Report 1998, EMEP/MSC-W, 150 pp.
Evans, C.D. and Monteith, D.T., 2000. Water Chemistry Discussion. In: UK Acid Waters Monitoring Network: 10 Year Report, D.T. Monteith and C.D. Evans (Eds.), 269–302. ENSIS Publishing, London.
Evans, C.D. and Monteith, D.T., 2001. Chemical trends at lakes and streams in the UK Acid Waters Monitoring Network, 1988-2000. Hydrol. Earth Syst. Sci., 5, 351–366.
Evans, C.D., Monteith, D.T. and Harriman, R., 2001a. Long-term variability in the deposisiton of marine ions at west coast sites in the UK Acid Waters Monitoring Network: impacts on surface water chemistry and significance for trend determination. Sci. Total Environ., 265, 115–129.
Evans, C.D., Cullen, J.M., Alewell, C., Marchetto, A., Moldan, F., Kopácek, J., Prechtel, A., Rogora, M., Veselý, J. and Wright, R.F., 2001b. Recovery from acidification in European surface waters. Hydrol. Earth Syst. Sci., 5, 283–297.
Forsius, M., Malin, V., Mannio, J., Kämäri, J., Kortelainen, P. and Verta, M., 1990. Enviornmental monitoring in Finland. Environmetrics, 1, 73–88.
Fransen, L.G., 1990. Transport deposition and distribition of marine aerosols over southern Sweden during westerly storms. Ambio, 19, 180–188.
Henriksen, A., 1984. Changes in base cation concentrations due to freshwater acidification. Verh.Internat.Verein.Limnol., 22, 692–698.
Henriksen, A. and Posch, M., 2001. Steady-state models for calculating critical loads of acidity for surface waters. Water Air Soil Pollut.: Focus, 1, 375–398.
Henriksen, A., Lien, L., Traaen, T.S., Sevaldrud, I. and Brakke, D.F., 1988. Lake acidification in Norway - present and predicted chemical status. Ambio, 17, 259–266.
Henriksen, A., Lien, L., Rosseland, B.O., Traaen, T.S. and Sevaldrud, I., 1989. Lake acidification in Norway — present and predicted fish status. Ambio, 18, 314–321.
Henriksen, A., Posch, M., Hultberg, H. and Lien, L., 1995. Critical loads of acidity for surface waters — Can the ANC limit be considered variable? Water Air Soil Pollut., 85, 2419–2424. Henriksen, A., Skjelkvåle, B.L., Mannio, J., Wilander, A.,
Harriman, R., Curtis, C., Jensen, J.P., Fjeld, E. and Moiseenko, T., 1998. Northern European Lake Survey — 1995. Finland, Norway, Sweden, Denmark, Russian Kola, Russian Karelia, Scotland and Wales. Ambio, 27, 80–91.
Hindar, A., Henriksen, A., Tørseth, K. and Semb, A., 1994. Acid water and fish death. Nature, 372, 327–328.
Hirsch, R.M., Slack, J.R. and Smith, R.A., 1982. Techniques of trend analysis for monthly water quality analysis. Water Resour. Res., 18, 107–121.
Johannessen, T., 1995. Acidification in Norway. The Norwegian monitoring programme for long range transported air pollutants. Water Air Soil Pollut., 85, 617–621.
Kulmala, A., Leinonen, L., Ruoho-Airola, T., Salmi, T. and Walden, J., 1998. Air quality trends in Finland. Finnish Meteorological Institute, University Press, Helsinki, Finland, 91 pp.
Mannio, J., 2001. Recovery patterns from acidification in Finland. Water Air Soil Pollut: Focus, (in press).
Mannio, J. and Vuorenmaa, J., 1995. Regional monitoring of lake acidification in Finland. Water Air Soil Pollut., 85, 571–576. Monteith, D.T., Evans, C.D. and Reynolds, B., 2000. Are temporal
variations in the nitrate content of UK upland freshwaters linked to the North Atlantic Oscillation? Hydrol. Process., 14, 1745–9. Prechtel, A., Alewell, C., Armbruster, M., Bittersohl, J., Cullen,
Matzner, E., Meesenburg, H., Moldan, F., Moritz, K., Veselý, J. and Wright, R.F., 2001. Response of sulphur dynamics in European freshwaters to decreasing sulphate deposition. Hydrol. Earth Syst. Sci., 5, 311–325.
Rask, M., Appelberg, M., Hesthagen, T., Tammi, J. and Lappalainen, A., 2000. Fish Status Survey of Nordic Lakes -species composition, distribution, effects of environmental changes. Copenhagen, Nordic Council of Ministers. TemaNord 2000, 58 pp.
Reuss, J.O. and Johnson, D.W., 1986. Acid Deposition and the Acidification of Soils and Waters. Ecological Studies. Springer, New York, 119 pp.
Sen, P.K., 1968. On a class of aligned rank order tests in two-way layouts. Annals of Mathematics and Statistics, 39, 1115–1124. Skjelkvåle, B.L., Olyndrenzky, K., Stoddard, J.L., Tarrason, L., Traaen, T.S., Tørset, K., Windjusveen, S. and Wright, R.F., 2001a. Assessment of trends and leaching of nitrogen at ICP Waters sites (Europe and North America). SNO 4383-2001, ICP-Waters Report 54-2001, Norwegian Institute for Water Research, Oslo, Norway, 42 pp.
Skjelkvåle, B.L., Tørseth, K., Aas, W. and Andersen, T., 2001b. Decrease in acid deposition — Recovery in Norwegian surface waters. Water Air Soil Pollut: Focus, (in press).
Stoddard, J.L., Jeffries, D.S., Lükewille, A., Clair, T.A., Dillon, P.J., Driscoll, C.T., Forsius, M., Johannessen, M., Kahl, J.S., Kellogg, J.H., Kemp, A., Mannio, J., Monteith, D., Murdoch, P.S., Patrick, S., Rebsdorf, A., Skjelkvåle, B.L., Stainton, M. P., Traaen, T.S., van Dam, H., Webster, K.E., Wieting, J. and Wilander, A., 1999. Regional trends in aquatic recovery from acidification in North America and Europe 1980-95. Nature,
401, 575–578.
Tarrason, L. and Schaug, J., 2000. Transboundary Acidification and Eutrophication in Europe. EMEP Summary Report 2000. EMEP/MSC-W 1/2000, Norwegian Meteorological Institute, Oslo, Norway, 264 pp.
Tørseth, K., Berg, T., Hanssen, J.E. and Manø, S., 1999. Overvåking av langtransportert forurenset luft og nedbør. Atmosfærisk tilførsel, 1998. Statlig program for forurensningsovervåking Rapport 768/99, Statens forurensningstilsyn, Oslo, Norway, 145 pp.
UN-ECE, 1994. Protocol to the 1979 Convention on Long-range Transboundary Air Pollution on Further Reduction of Sulphur Emissions. Document ECE/EB.AIR/40, United Nations Economic Commission for Europe, New York and Geneva, 106 pp.
UN-ECE, 1999. The 1999 Protocol to Abate Acidification, Eutrophication and Ground-level Ozone. Document ECE/ EB.AIR/72. United nations Economic Comission for Europe, New York and Geneva, 219 pp.
Wilander, A., 1998. Referanssjöarnas vattenkemi under 12 år; tillstånd och trender. Rapport 4652, Naturvårdsverket Förlag, Stockholm, Sweden, 79 pp.
Wilander, A. and Lundin, L., 2000. Recovery of surface waters and forest soils in Sweden. In: Recovery from Acidification in the Natural Environment. Present knowledge and future scenarios, P. Warfinge and U Bertills (Eds.), 53–65. Report 5034, Swedish Environmental Protection Agency, Stockholm. Wright, R.F., Alewell, C., Cullen, J., Evans, C.D., Marchetto, A., Moldan, F., Prechtel, A. and Rogora, M., 2001. Trends in nitrogen deposition and leaching in acid-sensitve streams in Europe. Hydrol. Earth Syst. Sci., 5, 299–310.