Dynamic Control of Centrifugal Compressor Surge Using Tailored Structure
by
Daniel Lawrence Gysling B.S. Aerospace Engineering The Pennsylvania State University (1987)
Submitted to the Department of Aeronautics and Astronautics in Partial Fulfillment of the Requirements for the Degree of
Master of Science in Aeronautics and Astronautics at the
Massachusetts Institute of Technology August 1989
© Massachusetts Institue of Technology, 1989, All Rights Reserved
Signature of Author
Seronautics and Astronautics August, 11, 1989 Certified by
Professor ofAeronautics and AstronauticsProfessor J. Dugundji Thesis Supervisor Certified
by-Professor ofAeronautics and AstronauticsProfessor E. M. Greitzer Thesis Supervisor
Approved by
(/
Professor Harold Y. WachmanjASSW hjjajian, Department Graduate Committee
OF TECHNOLOGY
SEP
2
9 1989
Aero
JITHDRAWWN
M.I.T.LIBRARIES
,Dynamic Control of Centrifugal Compressor Surge Using Tailored Structure
by
Daniel Lawrence Gysling
Submitted to the Department of Aeronautics and Astronautics on August 11, 1989 in partial fulfillment of the
requirements for the Degree of Master of Science in Aeronauitics and Astronautics
Abstract
A new method for dynamic control of centrifugal compressor surge is developed analytically and demonstrated experimentally. The method suppresses surge by modifying the compression system dynamics using structural feedback. The volume of the plenum is made flexible to respond to small perturbations in plenum pressure, via a movable wall modelled as a mass-spring-damper. The wall motion provides additional system damping to extend the stable operating range of the compression system.
A lumped parameter model of the flexible wall compression system is developed and a set of non-dimensional structural control parameters which govern the interaction of the wall and system dynamics is presented. The basic compression system is modelled as a Helmholtz resonator and is coupled to the wall dynamics. The effectiveness of the wall is shown to be a
function of the structural control parameters in addition to the basic compression system parameters. Unsteady energy transferred from flow perturbations to the wall and dissipated
by the damper is shown to be the dominant stabilizing mechanism.
Steady state and transient data demonstrated that the lumped parameter model can accurately predict surge dynamics. As predicted by the model and demonstrated with
experiment, a properly tuned flexible plenum wall significantly extended the stable flow range of a centrifugal compression system 25 to 30% over a large range of operating conditions. The flexible wall compression system was primarily designed based on linear theory. Control was achieved with relatively little power being dissipated through the flexible wall control system. Non-linear calculations showed that the amount of unsteadiness in the stabilized region is a function of non-linearities in the wall dynamics and these effects are quantified. Surge was
supressed with no noticeable decrease in steady performance. The flexible plenum wall demonstrated the ability to suppress existing surge.
Thesis Supervisor: Dr. John Dugundji
Title: Professor of Aeronautics and Astronautics Thesis Supervisor: Dr. Edward M. Greitzer
ACKNOWLEDGEMENTS
The author wishes to thank all those who helped to smooth the road for the completion of this project, in particular:
Professor Dugundji and Professor Greitzer for their insight, guidance and encouragement throughout this project
Dr. Gerry Guenette for his help in sorting out the mechanical and electrical aspects of this project
Professor Epstein for his advice throughout this project, especially during the mechanical design stages
John Simon and Judy Pinsley for their help with running the rig and the data acquistion system
Jim Nash, Roy Andrew, and Viktor Dubrowski for all their advice and assistance in the Lab
Bob Haimes for his help with the computing facilities in the Lab and special thanks go to my family and friends for helping me through.
The project was conducted at the Gas Turbine Lab under a grant from the Air Force Office of Scientific Research, Dr. J. M. McMicheal and Capt. H. Helin, program managers. Financial support for the author was provided by the Air Force Research in Aero Propulsion Technology (AFRAPT) program, AFSOR-85-0288.
TABLE OF CONTENTS Page A B STR A CT ... .. 1 ACKNOWLEDGEMENT... 2 TABLE OF CONTENTS ... 3 LIST OF FIGURES ... ... ... . 5 NOMENCLATURE... 8 1. INTRODUCTION ... 11
1.1 DESCRIPTION OF THE PROBLEM ... 11
1.2 BACKGROUND...12
a. Compression System Model ... 12
b. Previous Work on Surge Suppression ... 13
1.3 PRESENT WORK ... 14
2. ANALYSIS ... 19
2.1 INTRODUCTION ... 19
2.2 COMPRESSION SYSTEM MODELLING.... ... 19
a. Assumptions ... ...19
b. Equations for the System Dynamic Performance ... 20
2.3 LINEAR STABILITY ANALYSIS ... 25
a. Fixed Wall Compression System ... 26
b. Flexible Plenum Wall System ... 27
2.4 ENERGY BALANCE ... 30
2.5 NON-LINEAR ANALYSIS ... 33
2.6 SUMMARY... ... 37
3. DESIGN OF THE EXPERIMENTAL FACILITY ... 51
3.1 INTRODUCTION ... 51
3.2 EXISTING FACILITIES ... ... 51
3.3 DESIGN OF FLEXIBLE PLENUM WALL ... 52
a. Aerodynamic Spring... 52
b. Viscous Damper...53
3.4 RIG INSTRUMENTATION ... 55
3.5 DATA ACQUISTION ... 59
4. EXPERIMENTAL DATA AND ANALYSIS ... 74
4.1 INTRODUCTION ... 74
4.2 STEADY STATE DATA ... 74
a. Fixed Wall System... 74 I
b. Flexible Wall System... ... 77
c. Comparison with Theory ... 79
4.3 TRANSIENT SYSTEM BEHAVIOR ... 82
a. Fixed W all System... 82
b. Flexible Wall System... 83
c. Comparison to Theory... 85
4.4 VALIDATION OF ASSUMPTIONS ... 86
a. Quasi-steady Compressor Slope ... 86
b. Assumption of Constant Wheel Speed ... 88
4.5 COMPONENT PERFORMANCE ... 89
a. Aerodynamic Spring... 89
b. Dashpot Behavior... ... 90
4.6 SUMMARY OF RESULTS ... ... ... 91
5. CONCLUSIONS AND RECOMMENDATIONS ... 119
5.1 CONCLUSIONS FROM EXPERIMENT... 119
5.2 CONCLUSIONS FROM ANALYSIS ... 120
5.3 RECOMMENDATIONS FOR FUTURE WORK ...121
REFERENCES ... ... 122
APPENDIX A. DERIVATION OF THE EQUATIONS OF MOTION FOR THE FLEXIBLE PLENUM WALL SYSTEM... 124
APPENDIX B. ALTERNATIVE SCHEMES FOR PASSIVE SURGE SUPPRESSION ... 131
3.6: The Flexible Plenum Wall 3.7: Inlet Hot Wire Calibration
3.8: Frequency to Voltage Converter Calibration 3.9: Main Plenum Pressure Transducer Calibration 3.10: Displacement Transducer Calibration
3.11: Damping Force Calibration
3.12: Auxiliary Plenum Pressure Calibration
3.13: Exit Mass Flow Orifice Pressure Transducer Calibration
3.14: Empirical Orifice Discharge Coefficient versus Reynolds Number 4.1: Fixed Wall Compressor Performance Map
4.2: Non-dimensional Fixed Wall Performance Map
4.3: Compressor Performance Map Fixed and Flexible Wall 4.4: Amplitude of Limit Cycle in Stablized Region ( B= 1.83)
4.5: Comparison of Close Coupled and Structurally Stabilized Speedline
(70 K)
4.6: Predicted and Experimental Surgelines Fixed Wall and Optimized Systems 4.7: Close Coupled Speedlines for Holset H1D
(from Pinsley 1988)
4.8: Predicted versus Experimental Mass Flow Coefficients at Deep Surge (Fixed Wall and Optimized Systems)
4.9: Suppression of Fixed Wall Deep Surge with Flexible Wall
4.10: Amplitude of Plenum Pressure Fluctations Theory versus Experiment 4.11: Steady Operating Points for Transient Data
4.12: Fixed Wall Transient Behavior
4.13: Surge Cycles for Fixed Wall System (Points C and E) 4.14: Frequency Spectrum of Fixed Wall Mild Surge Cycle 4.15A: Flexible Wall System Behavior
4.16: Surge Cycles for Flexible Wall System (Points G and J)
4.17: Frequency Spectrum for Flexible Wall Surge Cycles Optimized Configuration 4.18A: Experimental and Calculated Mild Surge Cycles
4.18B: Calculated System Behavior Matching Amplitude of Pressure Limit Cycle to Experimental Data
4.19: Comparison of Calculated versus Experimental Wall Motion Matching Amplitude of Pressure Limit Cycle
4.20: Measured Instantaneous Compressor Slope versus Phi
4.21A: Wheel Speed and Plenum Pressure Fluctations During Fixed Wall Mild Surge 4.21B: Wheel Speed and Plenum Pressure FluctuationsDuring Fixed Wall Deep Surge
4.22: Aerodynamic Spring Force versus Displacement During Deep Surge 4.23: Aerodynamic Spring Constant Calculated in Frequency Domain 4.24: Wall Motion And Damper Force in Stabilized Region
Medium Damping Configuration
4.25: Damping Constant as Function of Frequency and Frequency Spectrum of Wall Motion In Stabilized Region Medium Damping Configuration
NOMENCLATURE Symbols a -- speed of sound A -- inertia parameter -- area B -- stability parameter c -- damping constant C -- flow velocity
f -- Coulomb friction force
F -- non-dimensional Coulomb friction force i -- imaginary number
I -- rotational inertia of turbospool k -- spring constant
L -- effective length m -- mass of plenum wall
rf -- mass flow M -- Mach number P -- pressure
q -- wall displacement
Q -- wall frequency parameter rms -- root mean square
R -- radius
Re -- Reynolds number U -- impeller exit tip speed
v -- non-dimensional wall motion V -- volume
NOMENCLATURE Symbols a -- speed of sound A -- inertia parameter -- area B -- stability parameter c -- damping constant C -- flow velocity
f -- Coulomb friction force
F -- non-dimensional Coulomb friction force i -- imaginary number
I -- rotational inertia of turbospool k -- spring constant
L -- effective length m -- mass of plenum wall rm -- mass flow
M -- Mach number P -- pressure
q -- wall displacement
Q -- wall frequency parameter rms -- root mean square
R -- radius
Re -- Reynolds number U -- impeller exit tip speed
v -- non-dimensional wall motion
W -- wall aeroelastic coupling parameter -- work over a cycle
x -- wall velocity
a -- orifice discharge coefficient
S -- empirical orifice constant
y -- ratio of specific heats
8* -- boundary layer displacement thickness
E -- compressibility factor
-- wall damping ratio parameter
7 -- non-dimensional wall velocity -- efficiency
A -- wall motion component of eigen vector v -- kinetic viscosity
t -- pressure ratio p -- density
I -- non-dimensional time
S
-- mass flow coefficientS -- mass flow component of eigenvector
x -- slip factor
' -- pressure rise coefficient
o -- frequency
Subscri adj aux c cor h i in meas p t perturbation quantity -- difference -- partial derivative -- time derivative -- time averaged -- fluctuation - - Fourier Transform 10 ipts -- adjusted -- auxiliary -- compressor -- corrected -- Helmholtz -- summation index -- inlet -- measured -- plenum -- throttle
-- tip of impeller exit -- thermal
axial
-- distance from leading edge -- ambient conditions -- compressor exit -- plenum exit 0 1 2 Operatc
8()
A()a()
8()
()
(
)'
()
)rs
1. INTRODUCTION
1.1 DESCRIPTION OF THE PROBLEM
The operating range of turbomachinery compression systems is generally limited by the onset of fluid dynamic instabilities which can take one of two forms: surge or rotating stall. Surge is a self-excited, one dimensional, instability characterized by oscillations in area-averaged mass flow and pressure rise. Rotating stall is a localized, two- or three-dimensional instability characterized by circumferential mass flow and pressure distortions rotating around the compressor face. Although rotating stall can occur in both axial and centrifugal
compression systems, it has a much more pronounced effect on performance in axial machines than in centrifugal machines, and surge appears to be the more important instability in
centrifugal compression systems1. The work in this thesis addresses surge suppression, which is viewed as an intial step in the development of systematic procedures for dynamic control of turbomachinery instabilities.
Surge can be further defined according to the amplitude of the oscillations. Mild surge refers to small amplitude oscillations with a frequency near the Helmholtz resonator frequency of the compression system. De)e surgg is characterized by large amplitude oscillations with periods of reversed mass flow. This type of oscillation can cause reduced performance and efficiency of the turbomachine, and even in some cases, failure due to the large unsteady
aerodynamic forces on the blades2.
To avoid surge, the compression system must be operated away from the "surge line", which denotes the boundary between stable and unstable operation. Operating the compressor
to the right of this line, on the negatively sloped part of the compressor speedlines ensures stable operation. A certain distance, or margin, from this line is necessary to prevent the compressor from crossing the surge line due to external disturbances. However, operating a
'safe distance' from the surge line can result in a performance and efficiency penalty since peak performance and efficiency often occur near the surge line.3
11 ~
The goal of this research is to develop methods to suppress surge and extend the stable operating range by modifying the compression system dynamics. This would allow the
compressor to operate in previously unstable regions of the compressor map as shown is Figure 1.1. The experimental phase of the research is limited to centrifugal compression systems, although the analytical model could be applied to axial compression systems as well.
1.2 BACKGROUND
a. Compression System Model
Typical compression systems consist of a compressor, a discharge chamber, a throttle mechanism, and the associated ducting. For low frequency oscillations, the inertial, resistive, and compliant properties of the compression system can be modelled as lumped
parameters.This type of dynamic model has been developed and investigated by many researchers.1, 2, 4 In this approach, the fluid in the inlet ducting serves as the system's inertance, the volume in the plenum serves as the system's compliance, and the compressor
and throttle, modelled as actuator disks, serve as the system's dampers (positive or negative). A schematic of the basic compression system is shown in Figure 1.2 .Although the model
ignores details of the local fluid dynamics of the flow, it has been shown to accurately model many aspects of the compression system dynamics.
Previous authors have used this model to predict system stability at a given operating point and to investigate surge dynamics in centrifugal compression systems.1,2,4 The instabilities observed are most often dynamic in nature; surge occurs when the compressor feeds more energy into disturbances than the throttle can dissipate. The result is an oscillatory disturbance that grows exponentially until nonlinearities force the oscillation into a limit cycle (surge cycle).
For the compressor to feed energy into disturbances, the slope of the compressor's pressure rise versus mass flow characteristic must be positive.5,6 The magnitude of the
positive compressor slope required for surge is determined by system damping characteristics, 12
but, for typical centrifugal compression systems, only a slightly positive slope is necessary. For this reason, the surge line generally occurs near the peak of the compressor
characteristic.7
b. Previous Work on Surge Suppression
There have been several investigations of surge suppression , all in recent years, using closed loop active control. In 1987, Huang 8(University of Cambridge), designed a low speed experimental facility which sucessfully suppressed surge using a movable plenum wall driven by a signal proportional to the unsteady plenum pressure. Pinsley 9 (Gas Turbine Lab, MIT), actively stabilized surge at high speed using a variable area throttle valve, also driven by a signal proportional to the unsteady plenum pressure. Each of these authors demonstrated that although fully developed surge is highly nonlinear, surge can be suppressed in the linear regime before it grows into a large amplitude disturbance by modification of system dynamics through closed looped control. In addition, the Helmholtz resonator model accurately
predicted the effect of the control system on the surge dynamics. Because the control system responded to small amplitude disturbances to supress surge, very little control power was required compared to the steady state output of the compression system8,9.
There has also been some previous work on passively stabilizing surge. In these methods the system dynamics are modified such that the compression system becomes inherently stable, requiring no external input. Passive control of surge is similar in concept to the mass balancing techniques used to eliminate flutter by modifying the interaction between the wing and the airstream. Chen 10 conducted a limited analytical investigation of passive control schemes. He found that a properly tuned variable area throttle valve, modelled as a mass-spring-damper driven by plenum pressure perturbations, could have a slightly stabilizing effect. In addition, he showed that a flexible plenum wall with no damping would be
destabilizing.
13
1.3 PRESENT WORK
The work in this thesis is directed at developing methods to suppress surge in centrifugal compression systems using tailored structural feedback. Although the main focus of the analysis and experimental investigation is on the flexible plenum wall method, several other passive control strategies are developed analytically in Appendix B. The unifying theme of each is that the system dynamics are modified to provide additional unsteady energy dissipation through aerodynamic or structural dynamic feedback.
With the flexible plenum wall, the wall is modelled as a mass-spring-damper system driven by unsteady pressure perturbations in the plenum, and coupled to the compression system dynamics A schematic of the flexible plenum wall system is shown in Figure 1.3.
It will be shown that an appropriately tailored flexible plenum wall can significantly extend the stable operating range of a compression system. The aeroelastic coupling between the wall and the basic compression system allows the damper on the flexible wall to dissipate unsteady energy from flow disturbances, thus suppressing surge and extending the stable operating range. The degree of surge suppression achievable is dependent on matching the structural dynamics to the system fluid dynamics. A set of non-dimensional control parameters which govern the interaction between the compression system and the wall are presented and their influence is investigated.
The research included both analytical and experimental phases. The following questions are addressed:
* What are the dominant parameters which determine the interaction of the flexible plenum wall and the basic compression system?
* How much can the flexible plenum wall increase the predicted stable flow range? * What is the optimal configuration ?
* What is the physical mechanism responsible for the surge suppression? * How do non-linearities affect the tailored structure performance?
Based on the results of the initial analytical studies, experiments were designed to assess the validity of the model In particular, are the major assumptions correct and is the actual performance of the system accurately predicted?
iI !
zed
Point
ontrol
Mass Flow
Figure 1.1: Extension of Operating Range with Dynamic Surge Control
16
a), u) a) u)0..
~Figure 1.2: Schematic of Basic Compression System
Plenum Wall
(Spring/Mass/Damper)
Srni
2Figure 1.3: Schematic of Compression System with Tailored Structure
(Flexible Plenum Wall)
2. ANALYSIS
2.1 INTRODUCTION
The basic compression system model has been used by other authors to investigate surge1,2,4. The system equations are derived by applying conservation of mass, momentum and entropy to a lumped parameter model. As stated, system inertia is lumped into the fluid in the inlet ducting, system compliance is lumped into the fluid in the volume of the plenum, and system resistance (positive or negative) is lumped into the compressor and the throttle. A schematic of the fixed wall, basic compression system is shown in Fig 1.2.
The basic system was then modified to include the tailored structure, a flexible plenum wall as shown in Fig 1.3. In this configuration, the wall, (mass-spring-damper), responds to perturbations in plenum pressure. The resulting model for the transient behavior is a set of four, non-linear, coupled differential equations.
To predict the system stability, the equations of motion were linearized. This leads to an eigenvalue problem which links the system stability to the non-dimensional system Using this, optimization studies were performed in parameter space.
In addition to the linearized analysis, the non-linear system equations were integrated in time numerically to study finite amplitude behavior. This non-linear analysis enabled the study of system behavior in surge.
2.2 COMPRESSION SYSTEM MODELLING a. Assumptions
In deriving the equations of motion for the system, the following assumptions were made.
1) Flow in the inlet ducting is 1-D, incompressible, inviscid, and unsteady 2) Plenum pressure is spatially uniform
3) Fluid in the plenum behaves isentropically 4) Fluid inertia in the throttle is negligible
5) Compressor follows a quasi-steady characteristic 6) Wheel speed is constant
7) Throttle characteristic is parabolic
Justification of these assumptions is well documented by other authors 1,4,5,6 with the exception of the constant wheel speed and quasi-steady compressor performance assumptions. The constant wheel speed assumption is based on the analysis by Fink 1 in which he
investigated the effects of a constant torque, variable speed rotor on a compression system stability. Fink showed that variable speed always has a stabilizing effect, and that the degree of stabilization is determined by a parameter which relates the aerodynamic torque on the rotor to the wheel's rotational inertia. This parameter, defined as:
2 po Lc Ain R2
I
(2.1)
affects linear stability only for A > 0.5. For the present system, the A-parameter is an order of magnitude below this critical value. Therefore, variations in wheel speed were neglected.
Many authors have investigated the instantaneous compressor characteristic during the onset of surge1,8,11 . It is has been speculated that the unsteadiness in the compressor during the onset of surge causes the compressor to vary from its steady state characteristic, but, the degree to which the unsteady aerodynamics modify the compressor characteristic has not been quantified. Finkl showed that the instantaneous compressor characteristic is slightly flatter than the quasi-steady characteristics due to an unsteady aerodynamic lag term which is on the order of compressor flow through time. It was found, however, that this lag term had little effect on system stability. Therefore, the quasi-steady assumption was used in the analysis and its accuracy assessed later with experimental results.
b. Equations for the System Dynamic Performance
The governing differential equations for the compression system with flexible plenum wall are: conservation of momentum in the inlet duct, conservation of mass in the plenum, and
Newton's second law applied to the flexible wall plus knowledge of the quasi-steady compressor and throttle characteristics. A derivation of the equations of motion is given in Appendix A and we merely list below the set of non-linear equations governing the
compression system dynamics.
(compressor characteristic) Po + APe(rih) = P1 (2.2)
(inlet duct momentum)
(plenum continuity) (throttle characteristic) d (Po Ain Le U) (P1 - Pp) Ain = dt d (pp Vp) rhl -rM2 = d(p ) dt Pp - APt (riz2)= Po
(wall dynamics) mqi + cq + kq = (Pp-Po) Ap (2.6) Linearizing and non-dimensionalizing the equations of motion as shown in appendix A, and assuming isentropic compression in the plenum, yields the following equations that
describe the linear stability of the system.
(inlet. duct momentum)
(plenum continuity) (throttle characteristic) S1 B DoB B
a•BD
Pp B
Oav
Pt po M2 Drpt
YAt
2 div + 2 Po Pp + Pv Q2 8v = W B2 8T (dwa d PP po dr Po (2.3) (2.4) (2.5) (2.7) (2.8) (2.9) (wall dynamics) (2.10)where ',
4
and v are defined as:(pressure coefficient)
(mass flow coefficient)
(non-dimensional wall motion)
"=Pp-Po
po U
2 Po Ain UAp
q
VPVp
and ~V', 41, &42, and 8v are the small perturbation quantities in pressure rise coefficient, inlet mass flow coefficient, exit mass flow coefficient, and non-dimensional wall motion, respectively.
Non-dimensional time is defined in terms of the Helmholtz frequency as:
T= Oht (2.14)
The non-dimensional parameters appearing in the linearized equations of motion can be classified as compression system parameters and structural control parameters.The parameter •Fy* is the non-dimensional slope of the compressor characteristic and is linked directly to surge. In the negatively sloped regions of the compressor map, both the throttle and the compressor serve to damp out flow disturbances. In the positively sloped regions, the compressor adds energy to disturbances while the throttle continues to dissipate unsteady energy. The flow through the system becomes unstable when the compressor adds more energy into disturbances than the throttle can extract6.
The B-parameter is the major system parameter which determines the surge dynamics of the compression systeml,2,5. The B-parameter is defined in this thesis* as:
*Note: The definitions of the B parameter and the pressure coefficient, ', do not contain a factor of 2, differing from common practice.
(2.11)
(2.12)
B = U = Po U2 Ain
h Lc Po Ain L, •h U (2.15)
It can be viewed as the ratio of pressure forces to inertial forces present in the Helmholtz resonator oscillations. The magnitude of the positive compressor slope required for disturbances to grow is determined by the B-parameter, and the B-parameter can thus be viewed as providing a measure of the coupling between mass flow oscillations through the compressor and through the throttle. The larger the B-parameter, the more isolated the throttle is from the compressor, and, therefore, less able to remove energy from flow disturbances. The general trend is that as the B-parameter increases, surge occurs at a smaller positive compressor slope.
The Helmholtz frequency of the compression system is defined as:
(h = ap
(2.16)
where:
Lcis the effective length of the inlet duct,
Ain is area of the duct,
VP is the plenum volume
ap is the speed of sound within the plenum.
The non-dimensional pressure rise and mass flow coefficients, Y and < define the steady state operating conditions.
The tip Mach number is based on plenum conditions and defined as:
ap (tip Mach number) (2.17)
enters the non-dimensional equations of motion as a measure of the effect of wall motion on the plenum continuity equation, but, it does not appear explicitly in the fixed wall model. The tip Mach number affects the coupling of wall motion to the compression system dynamics by determining the degree to which plenum pressure responds to wall motion. The pressure and mass flow fluctuations scale as a functions of tip Mach number (as Mt2 for low speeds), but
the wall motion does'not. The Mach number is needed in the equations of motion to include this effect, rather than as an explicit representation of the importance of compressibility in the system dynamic model. The larger the Mach number, the smaller the effect a given non-dimensional wall motion will have on the non-non-dimensional mass flow and pressure
perturbations in the system. In fact, the linear analysis predicts in the limit as Mt =o*, the basic compression system becomes completely uncoupled from the wall motion so that the flexible plenum wall does not affect system stability.
The control parameters, W, t,and Q, determine the wall's dynamic characteristics relative to the basic compression system dynamics. W is an aeroelastic coupling parameter defined as
Po =
AJ Q
(aeroelastic coupling parameter) m Vp (2.18) This parameter determines the degree to which wall responds to the pressure fluctuations in the plenum. The larger the W-parameter, the more the wall responds to perturbations in plenum
pressure.
C is the critical damping ratio of the plenum wall mass-spring-damper system, corrected to remain independent of compressor operating conditions. This is necessary since the
aerodynamic spring constant , and hence, the wall natural frequency, varies with plenum
pressure.
C=
c
(a damping ratio) 2 m p V Po (2.19)
Q defines the ratio of natural frequencies between the wall mass-spring-damper system and the compression system, also corrected so that it is independent of compressor operating point.
2.3 LINEAR STABILITY ANALYSIS
A linearized stability analysis was used to examine the effect of structural control
parameters on system stability for a given set of operating conditions. The goal was to shift the surge line as far towards low flow as possible for a given set of aerodynamic system
parameters. As mentioned, the dominant stability parameters for the compression system are the B-parameter and the quasi-steady compressor slope,
a'T/iý.
The quasi-steady compressor characteristic gives a direct relationship between the compressor slope and (steady state) mass flow so that the latter can also be used to characterize the system operating point. Thissubstitution was made to illustrate in a conventional manner the shift in the surge line for a given compressor, but it should be noted that the maximum slope prior to the onset of instability is a more appropriate measure of the effectiveness of a control strategy.
The stability matrix for the system is shown below.
0
0
0
B~ B po 22 0
0
0
6(
0
0
M.22
.2 Q .._..-s 0(2.21A) This essentially involves two coupled, dynamic systems; the compression system involving •1• and 482 and the wall system involving 8v and &•r. The terms associated with the
uncoupled fixed wall compression system and the flexible plenum wall dynamics are located on the tri-diagonal of the stability matrix and are shown in the dotted brackets. The two non-zero terms located off the tri-diagonal are the aeroelastic coupling terms.
Solving the eigenvalue problem as a function of B, Mt, 4, W, C, and Q and using the experimentally determined close-coupled characteristics of Pinsley 9 provides a method to
Close-coupled characteristics refer here to compressor characteristics measured with a system having a very low value of B, and thus much resistant to surge. This allows the quasi-steady
performance to be measured beyond the surge line for systems with higher B-parameters. The close-coupled 70 K rpm speedline used in the stability analysis is shown in Figure 2.1. Steady state plenum temperature was determined from the pressure ratio and a nominal 65% adiabatic efficiency; the effect on the results for any reasonable assumption for the efficiency is
negligible.
a. Fixed Wall Compression System
The stability of the fixed wall system can be predicted using the above stability matrix in the limit of either W = 0 or Q = oo. Either has the effect of making the wall appear massive and the spring constant stiff,or essentially rigid. For the fixed wall system, the stability criteria,
developed in Appendix A, is given as:
ý B2 2TI
(2.21) The maximum stable compressor slope is determined by the B-parameter and steady state operating conditions.
The root locus plot for a fixed wall system with B=1.0, plotted as a function of mass flow, is shown in Figure 2.2. The root locus plot is based on a 3rd degree polynomial curve fit of the measured 70K speedline shown in Figure 2.1 .The abscissa and ordinate of the root locus plots are non-dimensionalized by the system Helmholtz resonator frequency. The roots are plotted for mass flow coefficients ranging from .175 to .07 in increments of.005.As the mass flow decreases, corresponding to increasing the compressor slope, the poles are driven from the left half plane (stable) to the right half plane (unstable), with the imaginary axis defining the neutral stability point. Also, as shown by the root locus plots, the Helmholtz frequency is predicted to be a good estimate of the system natural frequency over the range of
mass flow coefficients. The system behaves like a damped (positive or negative) second order oscillator. The neutral stability point for the fixed wall system (
4
= .116), shown on the compressor characteristic in Figure 2.1, occurs near the peak of the compressor characteristic which is located at)
= 0.120.b. Flexible Plenum Wall System
The introduction of a flexible plenum wall introduces a second mode of oscillation to the compression system. In the limiting case, where the aeroelastic coupling is small, the frequencies of the structural and fluid modes are far apart .However, in the range of
parameters for which the wall is effective in suppressing surge, the modes show strong fluid structural interaction and cannot be readily linked to either of the two modes of oscillations in the absence of the coupling.
To optimize the flexible wall compression system performance, a parametric study was performed. In most compression systems, the physical dimensions of the machine are
independent of compressor operating conditions. However, for compression systems with a fixed inlet duct length and plenum volume, as was the case here, the tip Mach number and B-parameter are not independent, but scale directly with tip speed. The relationship between the Mach number and the B-parameter depends on the Helmholtz frequency and the inlet duct length. The relation between these two parameters used in this study is based on selecting values for the dimensions of the compression system which were both typical of modern compression machines and convenient from an experimental view point. This relation is shown in Figure 2.3.
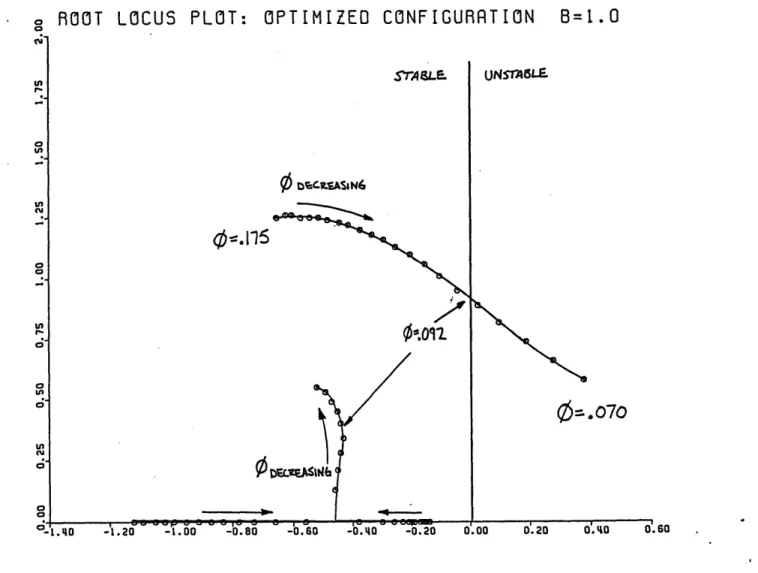
The result of the parameter search showed that the flexible wall performance is optimized over the range of B-parameters and Mach numbers with the following control parameters: W=.11, ý=1.5, and Q=.51. The root locus plot of the two mode system (B=1.0,
Mt=.4) is shown in Figure 2.4. The 70K compressor speed characteristic shown in Figure 2.1 was used here also. The Helmholtz frequency is again close to the characteristic frequency
of the system, but now the system behaves as two second order oscillators and the neutral stability point occurs well past the peak of the characteristic in the positively sloped region, as shown in Figure 2.4. The frequency of the mode that first becomes unstable is approximately 0.9 of the fixed wall Helmholtz frequency.
Away from instability (high mass flow), the flexible wall system has one oscillatory mode and one non-oscillatory mode; these are close to the Helmholtz mode and an over-critically damped wall mode. Near instability, the two modes show more fluid-structure coupling and both become oscillatory.
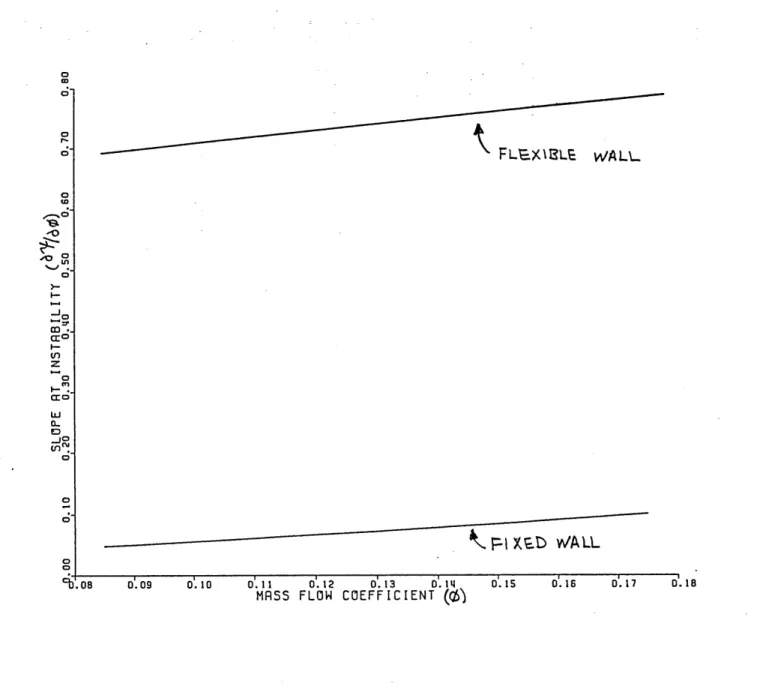
As noted previously, the maximum controllable slope before deep surge is a more appropriate measure of the control system performance than the minimum mass flow before deep surge. This is demonstrated in Figure 2.5, where the maximum controllable slope for the optimized and fixed wall configurations is shown to vary little over a large range of mass flow coefficients. The maximum controllable slope in the figure is calculated by increasing the non-dimensional compressor slope at a given operating point until the system developed a positive real root. Figure 2.5 shows that the steady state mass flow coefficient (by itself, for a given
slope) is not a dominant stability parameter for the optimized flexible wall system, however, it is an important parameter for the fixed wall compression system as indicated by equation (2.21).
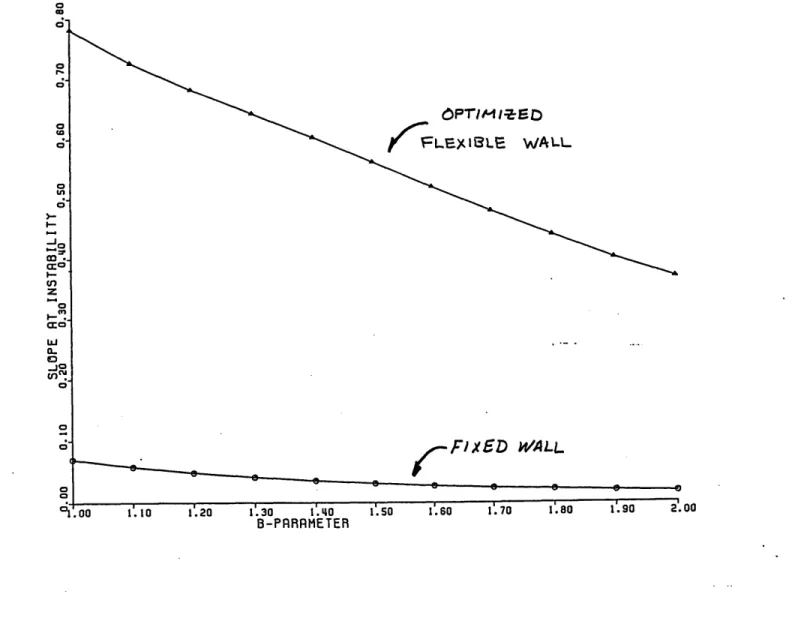
Determining the maximum controllable slope versus the B-parameter, (as suggested by Pinsley ), is much more useful. The larger the positive compressor slope before instability or surge, the more effective the control system. The maximum controllable slope versus B-parameter for the uncontrolled system and the optimized flexible wall system is shown in Figure 2.6. As shown, the maximum controllable slope is shown to be a function of the B-parameter for each system,with the optimized system capable of operating at much larger positive compressor slopes than the fixed wall system.
Plotting maximum controllable slope versus each of the control parameters about the optimized configuration in parameter space demonstrates that the result of the parameter study
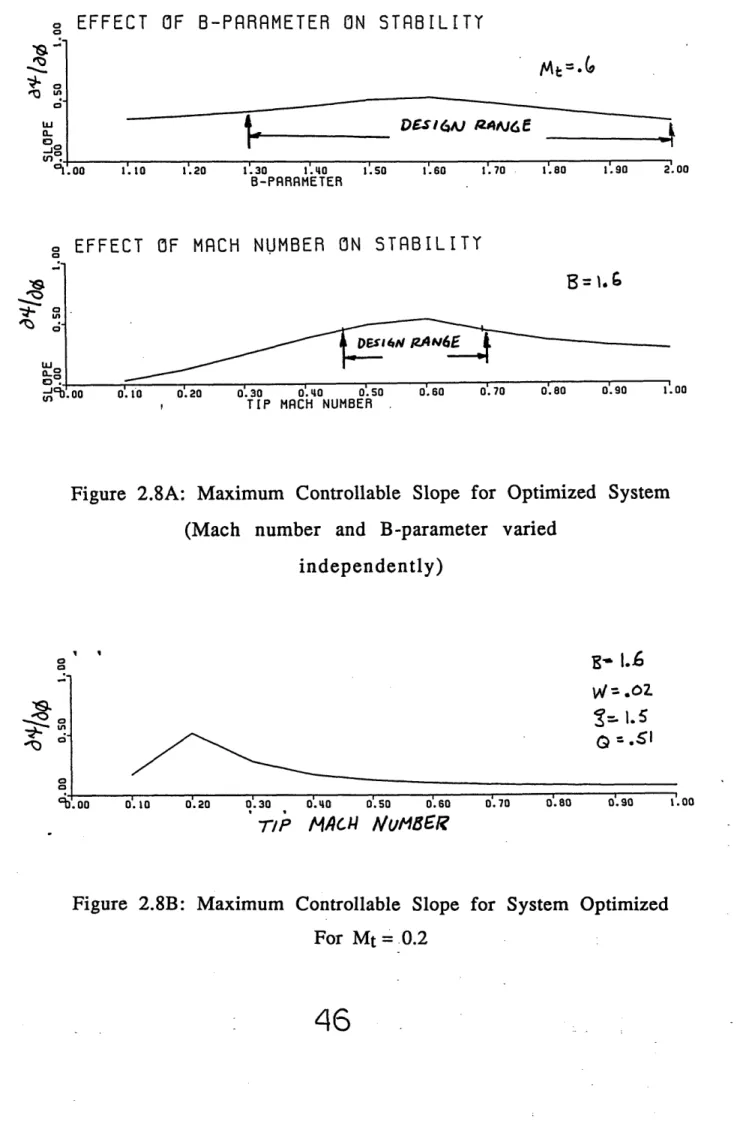
is at least a local maximum in parameter space. Figure 2.7 shows the maximum controllable slope versus W, t, Q varied respectively. The optimized values are indicated by arrows. As shown, any substantial changes in the structural control parameters away from the optimized configuration destabilizes the system. However, the linear analysis predicts the stabilization to be fairly insensitive to small changes in the control system parameters. The isolated effect of the B-parameter and the tip Mach number for system with a fixed set of control parameters is shown in Figure 2.8A , where one parameter is held constant and the other varied. Although this is not physically practical study since it would require varying the dimensions of the compression system with the operating point, it does demonstrate that the tip Mach number is an important parameter governing the stability of the flexible wall system over this range of parameters.
The parameter study yielded a system optimized over a range of Mach numbers (0.4 to 0.7). Over this range,which was selected because it is representative of the conditions in the intended experimental test rig, the aeroelastic coupling parameter was held constant,
maintaining the independence of compression system geometry with operating point. The control system could have been optimized for a different range of Mach numbers, and the same range of B-parameters, by modifying the system Helmholtz frequency. Changing the range of design Mach numbers would require re-optimization of the system's control parameters,
mainly modifying the aeroelastic control parameter, W. Figure 2.8B demonstrates this by plotting the effect of Mach number on the stability of the optimized flexible wall compression
system with a modified aeroelastic coupling parameter. As shown, for the system with the smaller aeroelastic coupling parameter (W =.02), the maximum control occurs at a Mach number of 0.2. For the system with W =.11, the maximum control occurs at Mach number = 0.6. Although the Mach number for which the system is optimized varies between the two systems, the maximum controllable slope remains fairly constant.
2.4 ENERGY BALANCE
The idea of an optimized configuration introduces the question of identifying the physical limitations on the maximum effectiveness of a flexible plenum control system. To address this issue, one must examine the physical mechanisms which stabilize the system. The dynamics of each mode of the flexible plenum wall compression system can be analyzed individually12,13. From an energy viewpoint, the system is said to be unstable when more energy is fed into any mode of oscillation over a cycle than is removed.
If the net energy input over a cycle is positive, the oscillation grows until non-linearities force the system into a limit cycle or surge. Therefore, if one considers the net energy input to a mode over a cycle, neutral stability will correspond to zero net energy input. Using the
orthogonality of the modes, it is only necessary to consider one mode at a time. If any mode is unstable,the system is unstable.
First, consider the fixed wall system. This model contains only one possible mode of oscillation and only two mechanisms for energy input and dissipation, flow through the compressor and throttle, respectively. The relative unsteady energy flows over a cycle can be calculated for neutrally stable modes with pure imaginary roots. Using the eigenvector of the nuetrally stable mode, the energy input by the compressor and dissipated by the throttle is calculated using the following relations.
The work transferred to the fluid by the compressor over a cycle can be expressed as:
WC = power dt = A rhi dt
SMo
(2.22)
t-2/sl
Wc = Po
U
3Ain
(+ -
801 ) Z1
tdt
Jo
-o (2.23)where: 801 = 1 eet i ; as given by the eigenvector of the neutrally stable mode. Performing the integration over an cycle yields:
= Po U3 Ain aY 2
CO DDI (2.24)
Similarly, for the throttle:
Wt = po U3 Ain 2% 2
= o 2 (2.25)
where Dland 02 , are components of the neutrally stable eigenvector and co is the frequency of the neutrally stable mode. (The energy expressions given above, assume that density remains constant through the compression system.) At the neutral stability point the relative
unsteady energy fed into the system by the compressor balances the unsteady energy dissipated by the throttle10.
A more interesting analysis results from looking at energy balances between the compressor, throttle, and the flexible wall in the controlled system. The relative unsteady energy dissipated by the flexible plenum wall for oscillations in the neutrally stable mode is given by:
Wwall = Fdq =c
f
q2 dt(2.26)
where (1= i ei' t and 0 is the wall motion component in the eigenvector of the
neutrally stable mode. Performing the integration yields:
WwaU= c c
(2.27)
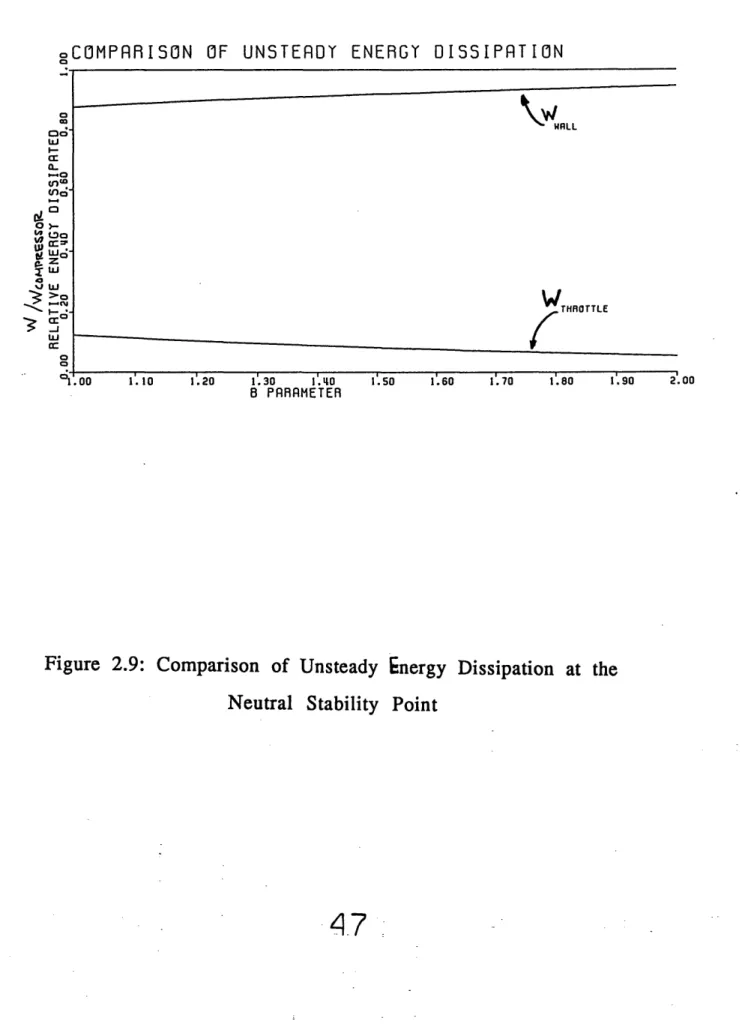
Figure 2.9 shows the relative energies input and dissipated over a cycle at the neutral
stability point as function of the B-parameter for the optimized system. The energies calculated
were based on the eigenvector of the neutrally stable mode. The flexible wall is the dominant
unsteady energy dissipator for the tuned wall, dissipating approximately 10 - 15 times as much
as the throttle over a large range of B-parameters. Also, the energy analysis shows that main
stabilizing mechanism of the flexible plenum wall compression system is the plenum wall
itself, rather than modification of the system dynamics to cause the throttle to dissipate more
unsteady energy, as in Pinsley's experiments
9For the wall to remove unsteady energy input by the compressor, the two components
must have sufficient aeroelastic coupling to transfer the energy from the pressure fluctuations to
the damper where it is dissipated. It is in this coupling where the limit to the effectiveness of
the control scheme lies. To investigate the limitations of the method for suppressing surge, the
flexible plenum wall dynamics can be uncoupled from the rest of the compression system and
the aeroelastic coupling term can be viewed as an external forcing function. The format is shown below:
-s
1
8v
0
po Pp po0 ? I
(2.28)
The magnitude of the external forcing function is dictated by the rest of the system dynamics
through the solution to the complete eigenvalue problem.
For the purpose of the study, it was first necessary to characterize the energy
dissipation in a simple mass-spring-damper system driven by a constant sinusoidal forcing
function. The energy dissipation by the dashpot, the only non-conservative component in the system, increases with decreasing mass, if the forcing function, damping constant and
frequency parameter are held constant. This indicates that the less massive the wall, the more effective it would be in suppressing surge. However, in the coupled system. the effective forcing function is dependent on wall motion through the system dynamics. When the system dynamics are considered, the aeroelastic coupling (or forcing function acting on the wall) decreases with decreasing plenum wall mass (Mt = constant). The amount of energy
dissipation in the wall is limited by the amount which can be transferred into the wall through the coupling of the two systems. Therefore, unsteady energy dissipation by the wall has a finite limit or maximum at some optimized condition. The limit on energy dissipation in the dashpot limits the maximum effectiveness of this device.
2.5 NON-LINEAR ANALYSIS
The results of the linear stability analysis yielded a set of optimized, non-dimensional control parameters. Large increases in the maximum controllable slope and, hence, large increases in the stable flow range were predicted These predictions, however, were based soley on a linearized model of the flexible wall compression system.
A non-linear, numerical, time marching integration of the equations of motion was also performed. The equations of motion (Eq 2.29 -2.34) were integrated using the Newmark time-averaged acceleration method. The equations presented below incorporate an
aerodynamic spring in the flexible plenum wall dynamics. The spring restoring force is provided by a sealed chamber of air being compressed isentropically, as developed in Chapter 3. The equations of motion in state variable form are shown below.
j Am
S =Ain (APc(il) - Pp +P0)
(plenum continuity) (wall dynamics) Pp=' i -r -rh ppApx) PP VP V (Ap(Pp -Paux) - c x ) m
(definition)
q = x
with the following algebraic relations to close the system:
(plenum volume) Vp = Vp+ Ap q
APt(rm2) = - • (throttle characteristic) 2 P4A and from the isentropic relation applied to the aerodynmamic spring
- constant PY
the following relation can be derived:
(isentropic spring)
Paux = :Fau{x Vaux
Vaux -Ap q
Again, knowledge of a compressor constant speed characteristic was needed to perform these calculations. As in the linear analysis, the characteristic shown in Figure 2.1 was used.
The non-linear analysis was used mainly in the conceptual design phase of building a demonstrator rig to assess the effects of finite amplitude disturbances and Coulomb friction. The effect of finite amplitude disturbances was analyzed by perturbing the pressure at the inlet of the compressor and calculating the time response of the system. The non-linear analysis
(2.30) (2.31) (2.32) (2.32a) (2.33) (2.33a) (2.34)
predicted the system stability to be rather insensitive to the magnitude of inlet disturbances. Figure 2.10, shows the predicted time history response of a linearly optimized system to a 20% ambient pressure pulse disturbance at the inlet operating near the linearly predicted stability line (ý = .096). A 20% ambient pressure disturbance was much larger than any anticipated ambient or internal disturbance. As shown, the wall motion and pressure perturbations exhibit classical damped harmonic motion. To suppress this disturbance, the maximum non-dimensional wall motion required corresponded to 0.1% of the plenum volume. The non-linear analysis also showed that introducing wall motion into a fixed wall system undergoing deep surge cycles, could suppress the surge.
An important assumption in the linear analysis was linear wall motion. However, in physical devices Coulomb friction is always present. The presence of Coulomb friction, in a strict sense, invalidates the linearity assumption. However, the degree to which the accuracy of the linear model is affected is a function of the magnitude of the Coulomb friction forces compared to the other, essentially linear, forces in the systeml2. To assess this effect, the equations of motion of the system were modified to include a Coulomb friction term. A friction force of constant magnitude was imposed on the wall in the direction opposite to its motion to model the sliding friction that would be present in an actual design.
An important result of this friction force is that it prevents the wall from responding to disturbances below a certain threshold. Disturbances must grow to a critical amplitude before the wall can respond. Therefore, in the strictest sense, operating points to the left of the natural surge line remain linearly unstable for the actual (non-ideal) control system.
The linear instability resulting from the presence of Coulomb friction, grows into a limit cycle, the amplitude of which is independent of system excitation and depends only on system parameters 12,13. For a given compression system and set of control parameters, the
amplitude of the limit cycle is a function of the non-dimensionalized friction force and the slope of the compressor characteristic. Using the dynamic pressure based on wheel speed and the wall area, the non-dimensional friction force is defined as:
F= f
pOU2Ap (2.35)
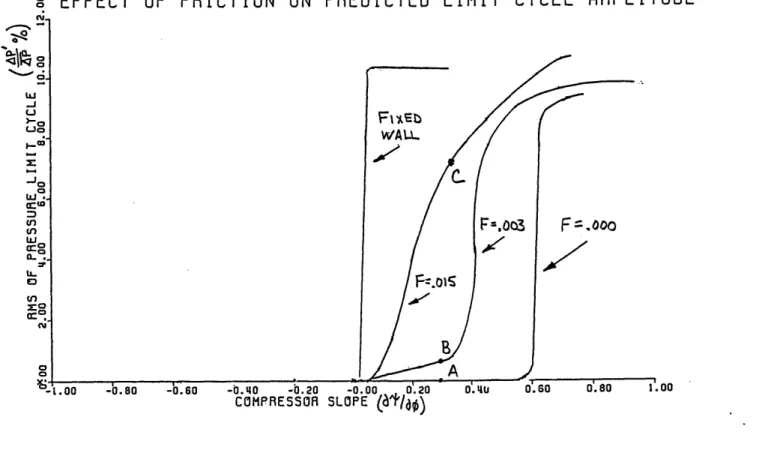
The effect of Coulomb friction on surge suppression is demonstrated in Figure 2.11 where the root mean square of the (calculated) limit cycle pressure fluctuations divided by the steady state pressure rise is plotted versus local compressor slope for various non-dimensional friction levels. For a given friction force, the limit cycle has a region in which its amplitude grows very little with increasing slope until the slope reaches a critical value at which the amplitude changes rapidly into the large values associated with deep surge. The maximum value of the compressor slope before deep surge occurs decreases with increasing friction levels. In the limit of increasing Coulomb friction levels, the performance of the flexible plenum wall system approaches that of the fixed wall system.
As an example of limit cycle predicted by the non-linear equations of motion due to a different levels of Coulomb friction, the time response of identical systems with various levels of Coulomb friction to a small disturbance is shown in Figure 2.12. The transients are predicted for the optimized system operating at B = 1.5 and
)
= 0.105 on the 70 K speedline. The amplitude of each limit cycle is shown on Figure 2.11. The disturbance decays in the system without Coulomb friction, but grows into a limit cycle in the systems with Coulomb friction. For the system with a small amount of Coulomb friction (F = .003) the limit cycle is small and approximately sinusiodal (mild surge) with a frequency near the predicted Helmholtz frequency. However, for the system with a larger amount of Coulomb friction ( F = .015),the limit cycle is more complex, containing regions of reversed flow (deep surge).
The deep surge boundary for the non-linear system with Coulomb friction and the predicted linear stability boundary for the linearly modeled system agree well in the limit of zero friction. However, as the friction term is increased, the non-linear analysis predicts deep surge at smaller positive compressor slopes. In the limit of large friction forces, the flexible wall system is predicted to encounter deep surge near the linear stability boundary of the fixed wall system. Analysis showed that the flexible plenum wall became unable to suppress surge
past the rigid wall surge line for non-dimensional friction levels greater than F =.02.
The non-linear analysis identified two additional requirements needed to design a test facility. For the wall to suppress finite amplitude disturbances, there should be a minimum range over which the wall responds quasi-linearly. In addition, the analysis shows the
importance of minimizing the non-dimensional Coulomb friction in actual applications of the flexible plenum wall control strategy.
2.6 SUMMARY
The present analytical investigation of the flexible plenum wall has shown that:
* There is a substantial potential for increases in the maximum controllable slope for a large range of compression systems.
* Maximum controllable slope is a more appropriate measure of a control system's performance than minimum mass flow at instability.
* The use of the flexible plenum wall to suppress surge is predicted to be robust and
insensitive to large amplitude disturbances and small changes in control parameters or operating conditions.
*Only a relatively small amount of wall motion is required to suppress large amplitude disturbances, resulting in little power being dissipated by the wall in the controlled regions.
* Coulomb friction in the wall is highly destabilizing, causing the system to go into deep surge at lower compressor slopes than linear theory predicts and causing mild surge to exist over the entire stabilized regions.
* The damper in the flexible wall, not the throttle, is the dominant unsteady energy dissipator in the optimized flexible plenum wall compression system.
* The maximum effectiveness of a flexible plenum wall to suppress surge is limited by the finite amount of coupling between the wall dynamics and the compression system dynamics.
* The tip Mach number governs the degree to which wall motion modifies the basic compression system dynamics.
0 0
9-0 0 wc- o I)-.
cncý
LL 0in 0j-0 LiL·i U*) OCD 0 Ur, 0i 0 M'9•1l I" 2oUMJDIRI BJ~D~R~1 13Or-DF-Z 4
CP-VEF1-r
2.D2.q -18.8ewP
v
73.S 5'01 .70 0.03 0.06 0.09 0.12 0.15 0.18MASS FLOW COEFFICIENT,
0.21 0.2 2 0.27 0.30
Figure 2.1: 70 K rpm Speedline Recorded with Close-Couple
Throttle (from Pinsely 1988)
39
Orn~MitED
S5T~ ISIL ,T~
'1.00.4-. C-LF
ROOT LOCUS PLOT: FIXED WALL SYSTEM B=1.0
DPEREASIIr
Q
=
,175-1.20 -L.00 -0.80 -0.60 -0.40 -0.20 0.00 0.20 0.q40 0.60
Figure 2.2:
Root Locus Plot of Fixed Wall System (B
=
1.0)
40
UIJ4TA I LE 0 Z.,10 0 C -I .U -I I I ~-.rtb0
ti A r I I i | ISB-PARAMETER / MACH NUMBER RELATION
1.10 1"20 1'30 1'.4o
B-PARAMETER 15so 16o0 1.70 180 1o90 2.00
Figure 2.3: B-parameter / Tip Mach Number Relation
4]
U) I. 0 .0 -U-0 -ni*0 a a aC zr -1.00 ~ o° ... ° ... .. ... - . .-o o ° ... - ... °... °... ... .... • ... . .. .- .. .. .. ... ... .. .. .. ... - - - ... ... -.- ... ... ... I--- ....--- ...--- ... ... 11~~-~... ... ---. ,. .. ,. .. ., .. . h.-... .. .... °... ... J~... ., ... •...o... ... . ... .o. ...o ..o. . .... -- - _ _ a __ROOT LOCUS PLOT: OPTIMIZED
STrA•-e. I UNs•rALE
0
•r•ISASIN6--.115
0= .070
Figure 2.4: Root Locus of Optimized system (B =1.0)
42
xFLXBLE WALU
Z
-I
X
S 1 YVALL
o'.09 o'.10o 0.11 0. 12 0. 13 0. 14MRSS FLOW COEFFICIENT (S)
0.15 0.16 0.17 0.18
Figure
2.5:
Effect of Mass Flow Coefficient on Maximum
Stable Compressor Slope for Fixed Wall
and Optimized Systems (B
=
1.0)
,I:) 0 I--Jo cro toZ I-U, z crc a-(_n *.jO C,, '0.08 · II
OPrTIM -ED
JF0*FtLS0F WALL
r FIXED WALL
00
Figure 2.6: Maximum Controllable Slope versus B-Parameter
(Fixed Wall and Optimized Systems )
(B= 1.0)
EFFE -v In e0 0 -J 0-0,
CT OF COUPLING PARAMETER ON STABILITT
0.04o 0.06 0.08 0.10 0'.12
COUPLING PARAMETER (W) 0.14 0.16 0.18 0.20
OF FREQUENCY PARAMETER ON STABILITY
00oo o'.s o.30so o'.Us o6'.o o7 s 0o.90
FREQUENCY PRRAMETER (0)
EFFECT OF DAMPING CONSTANT ON S
°EFFECT e,-: . L.0 Ea-n y-o g 0. a .J Cto 0 1.05 1.20 1.35 1.50 TABILITY 0.30 0.60 0.90 1.20 1s50 DAMPING CONSTANT 1.80 2.10 2.40 2.70 3.00
Figure 2.7: Maximum Controllable Slope for the Optimized System (structural control parameters
independently)
(
B=1.5)
45
-D. oU 0.02 -t. oo varied · · L'.
..
.
..
.
..
.
..
.
..
.
...
...
..
.
...
....
...
..
..
.
..
...
...
! f 4e1
o
EFFE
LU.. • o · O 0 0tA 1,.00 ICT
OF B-PRRRMETER
ON STABILITY to D6S16AJ QAAJdE .10to 1.20 1.30 1.40 B-PARAMETER 1'.50 1.60 1I.70 1'.80 1.90 2.00CT OF MACH NUMBER ON STABILITT
0.10 0'.20 0o'.30 o'. o 0'.so ,TIP MACH NUMBER
.
so
0'.70 .80 o0.9o 1'.06 . 0.80 0.90 .O
Figure 2.8A: Maximum Controllable Slope for Optimized System
(Mach number and B-parameter varied
independently)
-
1.6
= Z.0. g- --.•
-. 00 0'.10 0.20 0'.30 O'.40 0.50 0o.60
TIP
AlCH NUMBER
o. 70 0. 80 0. 90 1.00
Figure 2.8B: Maximum Controllable Slope for System Optimized
For Mt = 0.2
46
=EFFEI
0'
w _J9 (0 0.00 0 a · · · --· · · I L " __ I ·- 1 · '.1
oCOMPRRISON OF UNSTERDOY ENERGY OISSIPATION a Do tLJ I-C0~ -V.to w > crz crd -j cr-HALL THROTTLE
f6
0o -. 00 1 .10 1.20 1. 30 I :0 8 PRRFIRMETERFigure 2.9: Comparison of Unsteady Energy Dissipation at the
Neutral Stability Point
47
•w
· · ·
1.sIo f.60 1.70 1.80 1.90 2.00
----
7
100oo 2'.00 3.00 '.oo00 s.00 6.00 7.00 8.00 9.00 10.00
kLI Yot LTz PESo/JAToM
- - 0.1 lo plenuM voluoe.
0 1'.00 2'.00 3'00 'O0 5'.00 6.00 7.00 8.00 9.00 10.00
I ELMI/O4 LT RESOAIA-/R
Figure 2.10: Time History Response to a 20% Ambient Pressure
Disturbance (B = 1.5)
48
a. a a' -0.00j2
7
aO
ae.Ca
0. PEZ IoDS '4'7'·
1_
L--Z--i--EFFECT OF FRICTION
LLI
-o Lo
>_0
ON PREDICTED LIMIT CYCLE FMPLITUDE
1.00
. 60 -0.40 -0.20
COMPRESSOR
Figure 2.11: Predicted Limit Cycle Amplitude Versus Local
Compressor Slope for Various Friction Levels
r
i
A
2.00 '.o00 6.00 8.00 10b.00 1.00
HELMHOLTZ RESONATOR PERIODS
a'.oo ,'.oo 6.oo 2.HEL00HOLTZ 0:oo RESONATOR PERIODS.00Ib.oo 12.oo
HELMHOLTZ RESONATOR PERIODS
1;i.00 1*.00
Q 7ilr
18.00 2b.00
16.00 18.00 20.00
Z(NT
Figure 2.12: Predicted Limit Cycles for Various Friction Levels
50
(n~ a C;. a U, 0~ -. UU o U, C:: .0 i.D 'I L C·^^ r" --7rt c 1==.0153. DESIGN OF THE EXPERIMENTAL FACILITY 3.1 INTRODUCTION
The analyses predict that a properly tuned, flexible plenum wall could substantially increase the stable flow range of typical compression systems. To investigate this
experimentally and thus demonstrate passive surge control, a design study was undertaken to match the non-dimensional control parameters, while minimizing the effects of non-linearities, in a physically realistic device.
3.2 EXISTING FACILITIES
The conceptual design of the rig was based on an existing centrifugal compressor facility, constructed to investigate active throttle control of surge. The facility is described in detail by Pinsley 9, however, for completeness, the major components will be outlined in this thesis.
The centrifugal compressor was a Holset model H1D turbocharger developed for diesel engines. The impeller has an inlet area of .00125 m2 with a hub to tip radius ratio of .37. The impeller exit tip diameter is .055 m. The compressor has no inlet guide vanes, 6 blades, 6 splitter blades, and a vaneless diffusor. A performance map supplied by Holset is shown in Figure 3.1. The compressor is driven by a radial inflow turbine supplied by the high pressure lab air supply at the inlet. The turbine exhaust was connected to low pressure suction pulled by the laboratory steam ejector.
A schematic of the basic compression system facility is shown in Figure 3.2. During operation, air is drawn into the turbocharger through a bellmouth inlet, pressurized across the compressor and discharged into a plenum. From the plenum, the air exhausts across a
throttling valve into a settling chamber. The air then exhausts to the atmosphere across a low pressure drop office plate. The settling chamber was designed to be dynamically isolated from the surge dynamics, also described by Pinsley 9.
The design of the compression system allowed for modification of the inlet duct length, plenum volume, and for the capacity to operate over a wide range of conditions. There was thus a large amount of freedom in selecting the system dynamic characteristics.
3.3 DESIGN OF FLEXIBLE PLENUM WALL a. Aerodynamic Spring
With the basic compression system already existing, most of the design challenges were in designing a flexible plenum wall that could respond to pressure fluctuations in a linear manner as the model required. The basic analysis only required that the plenum volume respond to pressure perturbations, with the dynamics as dictated by the non-dimensional control parameters. In the conceptual design phase, several different ways to mechanically implement this control scheme were reviewed. A major constraint was that the wall had to be capable of withstanding large steady state and transient pressure loading, yet still respond to
small amplitude perturbations in plenum pressure. A rigid plenum wall and an aerodynamic spring were determined to be practical solutions to these constraints.
To serve as the flexible wall, the rigid piston was mounted on a shaft, guided by linear bearings, and allowed to float between the main plenum and an auxilliary plenum. The seal between the two plenums was made with a low friction, convoluted diaphragm. Although the two plenums were effectively isolated for high frequency pressure disturbances (i.e. surge oscillations), the steady state pressures were equalized by a small diameter tube, so that there was no steady state load on the piston. The compressiblity of the air in the auxilliary plenum could thus serve as a self-adjusting spring and the mass of the piston itself could serve as the mass.
A small mechanical spring was necessary to maintain a constant equilibrium position for the piston over various operating conditions since, in the steady state limit the aerodyamic spring had no preferred equilibrium postion. The mechanical spring also allowed the steady state position of the wall to be adjustable.