HAL Id: hal-00304653
https://hal.archives-ouvertes.fr/hal-00304653
Submitted on 1 Jan 2002HAL is a multi-disciplinary open access archive for the deposit and dissemination of sci-entific research documents, whether they are pub-lished or not. The documents may come from teaching and research institutions in France or abroad, or from public or private research centers.
L’archive ouverte pluridisciplinaire HAL, est destinée au dépôt et à la diffusion de documents scientifiques de niveau recherche, publiés ou non, émanant des établissements d’enseignement et de recherche français ou étrangers, des laboratoires publics ou privés.
water: sampling, storage, fractionation and sensitivity
H. P. Jarvie, J. A. Withers, C. Neal
To cite this version:
H. P. Jarvie, J. A. Withers, C. Neal. Review of robust measurement of phosphorus in river water: sampling, storage, fractionation and sensitivity. Hydrology and Earth System Sciences Discussions, European Geosciences Union, 2002, 6 (1), pp.113-131. �hal-00304653�
Review of robust measurement of phosphorus in river water:
sampling, storage, fractionation and sensitivity
Helen P. Jarvie
1, Paul J.A. Withers
2and Colin Neal
11Centre for Ecology and Hydrology, Wallingford, Oxfordshire OX10 8BB, UK 2ADAS Bridgets, Martyr Worthy, Winchester, Hampshire SO21 1AP, UK
Email for corresponding author: [email protected]
Abstract
This paper reviews current knowledge on sampling, storage and analysis of phosphorus (P) in river waters. Potential sensitivity of rivers with different physical, chemical and biological characteristics (trophic status, turbidity, flow regime, matrix chemistry) is examined in terms of errors associated with sampling, sample preparation, storage, contamination, interference and analytical errors. Key issues identified include:
z The need to tailor analytical reagents and concentrations to take into account the characteristics of the sample matrix.
z The effects of matrix interference on the colorimetric analysis.
z The influence of variable rates of phospho-molybdenum blue colour formation.
z The differing responses of river waters to physical and chemical conditions of storage.
z The higher sensitivities of samples with low P concentrations to storage and analytical errors.
Given high variability of river water characteristics in space and time, no single standardised methodology for sampling, storage and analysis of P in rivers can be offered. ‘Good Practice’ guidelines are suggested, which recommend that protocols for sampling, storage and analysis of river water for P is based on thorough site-specific method testing and assessment of P stability on storage. For wider sampling programmes at the regional/national scale where intensive site-specific method and stability testing are not feasible, ‘Precautionary Practice’ guidelines are suggested. The study highlights key areas requiring further investigation for improving methodological rigour.
Key words: phosphorus, orthophosphate, soluble reactive, particulate, colorimetry, stability, sensitivity, analytical error, storage, sampling, filtration, preservative, fractionation, digestion
Introduction
Phosphorus (P) plays a key role in eutrophication of surface waters (OECD, 1982; Hecky and Kilham, 1988). Elevated P concentrations in rivers have been linked to increasing rates of plant growth, changes in species composition and proliferation of planktonic and epiphytic and epibenthic algae, resulting in shading of higher plants (Mainstone and Parr, 2002). Phosphorus exists in a wide variety of forms in natural waters, in both dissolved and particulate phases, and in inorganic and organic forms, including biomass. These forms are highly inter-reactive with each other and with the aquatic ecosystem. Extensive and reliable measurements of P fractions in rivers are required to:
z Assess the fate and behaviour of P, including cycling between dissolved and particulate phases;
z Evaluate the impacts of point and diffuse sources on in-stream P concentrations and fluxes;
z Examine river water P concentrations in relation to environmental standards within statutory national water quality monitoring programmes.
However, the various P species have to be measured on a pragmatic/operational basis due to the complex chemical properties of P in natural waters. Thus, the different chemical species of P are rarely resolved analytically and the P fractions, which are measured routinely in water quality
studies, are defined to include various chemical species of similar type (Burton, 1973). Indeed, there is controversy and speculation about what these operationally-defined fractions measure precisely in terms of P species and whether any of these measurements can be equated with immediately bioavailable P taken up by algae or other organisms (e.g. Bostrom et al., 1988). The linkages between these operationally-defined P fractions and bioavailable P are poorly understood. There is also, presently, a mis-match between accurate determination of P species required for describing geochemical equilibria in complex environmental systems and providing pragmatic, but precise, routine measurements of operationally-defined P fractions, which are important for gaining understanding of the state of freshwater quality and for defining the ecological status of surface waters.
Phosphorus fractions are highly sensitive to changes in ambient conditions following sampling. Processes such as sorption, hydrolysis, precipitation, complexation, and microbial uptake and release during storage, mean that the concentrations of P fractions at the time of analysis may not be representative of those within the river at the time of sampling (Maher and Woo, 1998). Furthermore, matrix chemistry, biological status and colloidal content can have an important influence on P-stability on storage (Haygarth
et al., 1995).
This paper reviews current knowledge and research undertaken to produce objective and precise measurements of P fractions in river water. Sampling, storage and analysis procedures for measuring river-water P fractions are examined in the light of potential sensitivities of different river-types and water compositions/matrix chemistries to errors of measurement. The review assesses robust methodologies for P measurement in rivers in response to the new UK Environment Agency (EA) Eutrophication Strategy (Environment Agency, 2000), which focuses attention on sensitive flowing water systems. The study provides some broad guidelines upon which to base evaluation of P stability and analytical precision and accuracy, and highlights key areas which require further investigation in terms of improving methodological rigour for measuring concentrations of key P fractions.
Phosphorus speciation and
fractionation
The types of chemical species for P are highly variable within natural waters but most routine water quality monitoring programmes rely on operationally-defined P
fractions which actually measure a broad combination of
species.
PHOSPHORUS SPECIATION
Phosphorus is present in a wide variety of chemical forms in natural waters (American Public Health Association (APHA), 1976; Maher and Woo, 1998). Dissolved P species include orthophosphate (H2PO4-, HPO
42-, PO43-), inorganic
condensed P (pyro-, meta- and polyphosphates) and organic condensed phosphates (e.g. ATP). Organic P (e.g. sugar P, inositol P, phospholipids, phosphoproteins, phosphoamides) may be found in both dissolved and particulate forms, associated with plant, animal and bacterial cellular material. Particulate P may also be composed of mineral P (e.g. hydroxyapatite, brushite, fluoroapatite, variscite, stringite and wavellite) and may be sorbed to mixed phases (e.g. clays, clay-organic complexes and metal oxides and hydroxides) (Maher and Woo, 1998).
PHOSPHORUS FRACTIONATION
Separation of ‘dissolved’ and ‘particulate’ P phases is based mainly on filtration using 0.45 µm (mainly) or 0.7 µm membrane filters. Analytical determination of P in natural waters is based on the phosphomolybdic acid methodology, as modified by Murphy and Riley (1962).
The following determinations are made routinely: (i) Soluble Reactive Phosphorus (SRP), a measure of
monomeric inorganic phosphorus (orthophosphate) in solution. Other terms commonly used within the literature to describe this fraction include: ‘Dissolved Reactive Phosphorus (DRP)’, Dissolved Inorganic Phosphorus (DIP)’, ‘Filterable Reactive Phosphorus (FRP)’ and ‘Reactive Phosphorus for a filtered sample to a defined filter size (e.g. RP(<0.45µm))’.
(ii) Total Dissolved Phosphorus (TDP). This is also commonly termed ‘Total Filterable Phosphorus (TFP)’, and is a combination of dissolved monomeric inorganic (SRP) and dissolved hydrolysable (polymeric and organic) phosphorus (DHP).
(iii) Total Phosphorus (TP): the total dissolved plus particulate (PP) phosphorus in a water sample. Dissolved Hydrolysable Phosphorus (DHP) is the difference between TDP and SRP, and Particulate Phosphorus (PP) is the difference between TP and TDP. DHP is also referred to in the literature as ‘Dissolved Unreactive Phosphorus (DUP)’, ‘Soluble Unreactive Phosphorus (SUP)’ and ‘Unreactive Phosphorus for a filtered sample to a defined filter size (e.g. UP (<0.45µm))’. Differentiation between inorganic and organic forms of PP (Particulate Inorganic Phosphorus [PIP] and Particulate Organic Phosphorus [POP]) has also been made (MEWAM,
1980), although these are not covered within this paper as this review focuses on the P fractions measured routinely as described above.
The term ‘Molybdate Reactive Phosphorus (MRP)’needs to be classified separately. The term MRP is used, ambiguously, in two distinct ways: (a) for filtered samples, MRP is equivalent to SRP measurements; (b) for unfiltered samples, MRP is equivalent to SRP plus a fraction of particulate P which is reactive to the phosphomolybdenum blue method reagents. MRP determined on unfiltered samples is routinely referred to as ‘Orthophosphate as P’ by the Environment Agency in England and Wales.
Clearly, there is a strong requirement for standardisation of the terminology to describe P fractions. The present system is confusing and inexact: for example, differentiation of ‘dissolved’ or ‘soluble’ and ‘particulate’ P phases is based on membrane filtration, since P is associated with a continuum of <0.45µm sized particles and colloids (Haygarth et al., 1997; Haygarth and Sharpley, 2000).
Analytical determination of P
fractions
TDP determination involves digestion of filtered water samples to decompose organic, polymeric and colloidal P species to orthophosphate, which is then analysed by the phosphomolybdenum blue method. Total P determination involves the same digestion procedure applied to an unfiltered sample, to convert particulate and dissolved P to orthophosphate, which is also determined by the phosphomolybdenum blue method (Murphy and Riley, 1962; Eisenreich et al., 1975). However, the relative effectiveness of digestion methods is variable. Hence, the TP or TDP value will vary according to the rigour of the digestion method used (see below). Inductively-coupled plasma-optical emission spectrometry (ICP-OES) is also used for determination of total dissolved P concentrations. However, the relative insensitivity of the ICP-OES technique frequently limits its use to waters containing >100 µg-P l-1
(Rowland and Haygarth, 1997), although ICP-MS (mass spectrometry) does offer the possibility of greater accuracy. Detection limits for the Murphy and Riley (1962) methodology for SRP and for TDP and TP following the standard acid-persulphate digestion are typically 5–10 µg-P l-1 (Methods for the Examination of Waters and
Associated Materials (MEWAM), 1980; Rowland and Haygarth, 1997; Pote and Daniel, 2000).
Digestion method
Oxidative digestion procedures used for TDP and TP
analysis include perchloric acid, hydrogen peroxide, sulphuric acid-nitric acid and peroxydisulphate (Maher and Woo, 1998). The release of phosphate on digestion is dependent on the rigour of the reaction: for example, the perchloric acid digestion is extremely rigorous but poses a significant safety hazard (Rowland and Haygarth, 1997). Potassium peroxydisulphate (also known as persulphate), although classified as a mild oxidant (MEWAM, 1980), is most commonly used as the oxidant for P digestion, based on the method of Menzel and Corwin (1965). The rate of persulphate decomposition increases with increasing temperature and a reduction in pH. Therefore, conversion of particulate, organic and condensed phosphate into orthophosphate requires a combination of high temperature, by conventional heating (MEWAM, 1980), autoclaving (Rowland and Haygarth, 1997) or using a microwave (Johnes and Heathwaite, 1992) and high acidity (mineral acids). Batch digestion of samples with acid-persulphate using autoclave or microwave heating is used most commonly and is recommended by Johnes and Heathwaite (1992), Rowland and Haygarth (1997) and Maher and Woo (1998) for reasons of accuracy, precision, ease and simplicity. Some workers recommend the use of microwave digestion because of the higher pressures and temperatures generated as well as the speed for digesting large numbers of samples (Johnes and Heathwaite, 1992; Maher and Woo, 1998). UV photo-oxidation is another commonly used digestion technique (McKelvie et al., 1989; Benson et al., 1996) and the use of persulphate in conjunction with UV photolysis may also improve the effectiveness of oxidisation due to the formation of reactive radicals in the presence of UV light (Maher and Woo, 1998).
The effectiveness of the digestion procedure in releasing P from these forms depends on oxidant concentration, digestion temperature and the nature of the sample matrix. While a variety of reagent recipes and digestion techniques appears within the literature, it is important to ensure that complete oxidation of organic material and hydrolysis and release of P from polyphosphates occurs before the persulphate has decomposed fully (Goulden and Anthony, 1978). Samples with high organic carbon or particulate concentrations may require higher concentrations of persulphate than those typically used for digestion of non-turbid samples, for complete oxidation and release of P. Poor recovery of P has been reported for samples containing high carbon concentrations (>200 mg l-1) (Williams et al., 1995)
and high concentrations of suspended sediment (Lambert and Maher, 1995). The incomplete measurement of TP in waters containing particulate inorganic materials has been documented widely owing to failure of acid-persulphate digestion to release all P occluded within oxides and hydrous
oxides (e.g. Jeffries et al., 1979; Lambert and Maher, 1995). Therefore, the efficiency of P recovery by acid-persulphate digestion tends to decrease as concentrations of suspended solids increase (Maher and Woo, 1998).
The phosphomolybdenum blue method
When a solution containing phosphate and molybdate ions is acidified with H2SO4, 1,2-molybdophosphoric acid is formed. In the presence of a reducing agent, 1,2-molybdophosphoric acid is reduced to the phosphomolybdenum blue complex. The intensity of the blue colour is proportional to the amount of orthophosphate ions incorporated into the complex and hence, the reacted orthophosphate can be determined colorimetrically. Two types of reducing agent have been used in this technique: stannous chloride and ascorbic acid. Murphy and Riley (1962) advocated the use of ascorbic acid, given the advantages that ascorbic acid produces colour development which is more stable than that for stannous chloride and the reaction using ascorbic acid is independent of temperature and salt concentrations. The major disadvantage of using ascorbic acid is the slow rate of colour development. Colour formation can be speeded up by the use of SbIII as a catalyst (usually as potassium antimonyl tartrate). However, slow colour formation has been described as an “insidious” source of analytical error, which can lead to serious underestimation of true P concentrations if readings are carried out before complete colour development has occurred (Sjosten and Blomqvist, 1997). This is of particular relevance for automated procedures, where the timing of analysis needs to be controlled carefully. The formation rate of the phosphomolybdenum blue complex is dependent on reagent and reactant concentrations and the temperature of the solution: at lower P concentrations and low temperatures, it takes longer to reach full colour development. It is, therefore, essential that colorimetric readings be postponed until full colour development has been achieved under the prevailing reaction conditions (Sjosten and Blomqvist, 1997).
Another potential source of analytical error is the use of different concentrations of acid and molybdate, which can have important effects on the kinetics of formation of the phosphomolybdenum blue complex. Although the concentrations of reagents used by different researchers vary considerably, Pai et al. (1990) found that the molar ratio between [H+] and [MoO
42-] in the reagent recipe was the
crucial parameter, influencing the form of the final reduced complex and the reaction kinetics. Normal colour formation occurred for [H+]:[MoO
42-] molar ratios of between 60 and
80. Below a molar ratio of 60, interference effects may occur due to self-reduction of the MoO42- ion to form a
molybdenum blue colour independent of the P concentration (“non-phosphate sensitized reduction”, Going and Eisenreich, 1974). Above a molar ratio of 80, the reaction becomes slow and incomplete, due to the formation of molybdenyl cationic species which are unreactive with phosphate. It is important to remember that the effective [H+] reagent concentration may be affected by factors such
as the acid-neutralisation capacity of the sample matrix. The phosphomolybdenum blue method is also subject to interference effects from other determinands within the sample matrix, including arsenic, fluoride, silicon, chromium, oxidising agents, nitrite, nitrate and sulphide (MEWAM, 1980; Blomqvist et al., 1993; Noriki, 1978; Neal
et al., 2000b). Arsenic forms a blue molybdate complex,
although the rate of formation is slower than for the phosphomolybdenum blue complex and, therefore, by carefully timing the colorimetric analysis, it is possible to avoid interference (Sjosten and Blomqvist, 1997). The fluoride ion slows down the development of the phosphomolybdenum blue complex (although does not affect the maximum absorbance level) (Blomqvist et al., 1993). Silica, in the form of undissociated orthosilicic acid, can also have important interference effects. MEWAM (1980) report that the Murphy and Riley (1962) method should tolerate concentrations of 10 mg l-1 silicon as silicate,
but where phosphate concentrations are very low, high silicon to phosphorus ratios may also cause significant errors. These effects are complex and have been documented by Neal et al. (2000b) in relation to heating of reagents and samples to speed up the rate of formation of phosphomolybdic acid, and the strength of sulphuric-acid within the reagent recipe. Chromium interference has been reported at 1 mg l-1 levels (APHA, 1976). Interference with
sulphide is complex and variable (MEWAM, 1980). Sulphide reacts with both antimonate and molybdate, and therefore its complete removal by oxidation to sulphate or aspiration with nitrogen is recommended. However, within well-oxygenated river waters, sulphide interference is unlikely to be a major problem. The interference from oxidising agents is complex (MEWAM, 1980) and may result in the destruction of the reducing agent or subsequent re-oxidisation of the phosphomolybdenum blue complex. Nitrate and nitrite may both cause interference effects but typically only at very high concentrations (above 1 mg-N l-1 for nitrite and 20 g-N l-1 for nitrate, MEWAM,
1980), which are rarely encountered in river waters. In general, the extent of interference in colorimetric P determination depends on the concentration of the interfering agent (particularly Si, As and F) in the sample matrix, the temperature of the reaction and the concentration of P. Samples from polluted rivers with high concentrations
of interfering agents and from those rivers with low P concentrations are likely to be more sensitive to interference (MEWAM, 1980).
A disadvantage of using the phosphomolybdenum blue method for determining orthophosphate concentrations as ‘SRP’ is the potential for hydrolysis of labile organic-P and condensed-P compounds and displacement of P from colloids in the <0.45 µm fraction filtrate, resulting in possible over-estimation of orthophosphate concentrations (Tarapchak, 1983; Baldwin, 1998; Denison et al., 1998). Many organic-P and condensed-P compounds may be hydrolysed in the low-pH conditions used in the colorimetric procedure and the molybdate ion can catalyse the hydrolysis of organic-P compounds (Tarapchak, 1983). Use of ion exchange resins offers the possibility of separating inorganic orthophosphate in natural waters (Westland and Boisclair, 1974). Since adsorption to the ion exchange resin is not accompanied by major changes in solution chemistry (e.g. pH), Westland and Boisclair (1974) suggested that this procedure allows determination of orthophosphate by the phosphomolybdenum blue method without interference from other phosphate-containing compounds.
Estimates of bioavailable-P
An alternative approach to P measurement in river water is to estimate the bioavailable P concentration in river water. Bioavailable P (BAP) is the component of total P which is available to biological uptake, including components of dissolved inorganic and organic P and well as bioavailable particulate P (Bostrom et al, 1988). Bioavailable P therefore does not correspond directly to any one of the routinely measured P fractions (TP, TDP, SRP) or the derived PP and DHP fractions. Moreover, BAP is not linked to a constant proportion of any of these fractions (Sharpley, 1993a) and therefore must be determined separately (Dils and Heathwaite, 1998). Numerous techniques have been employed to estimate BAP, including bioassays (e.g. Chamberlain and Shapiro, 1969; Ekholm, 1994), ion exchange resin-impregnated membranes (e.g. Abrams and Jarrell, 1992) and chemical extractions using NaOH and NH4F (Sharpley, 2000). However, iron oxide-impregnated paper strips provide a relatively simple chemical extraction technique, which has been used widely to estimate biovailable P concentrations (e.g. Sharpley, 1993 a,b; Sharpley et al., 1995; Dils and Heathwaite, 1998). Phosphorus adsorbs to the amorphous Fe oxides and hydroxides on the filter paper strips. The Fe-oxide impregnated filter paper strip is therefore shaken with a sample of unfiltered river water, removed, rinsed free of particulates and dried. Once dried, the P content of the filter
is stable, facilitating storage prior to extraction and analysis. This adsorbed P can then be extracted later using a dilute acid solution and the extract analysed by the phosphomolybdenum blue method.
Sampling : collecting a representative
sample
The collection of river water quality samples generally necessitates compromise between coverage of spatial and temporal variability and resource limitations (Chapman, 1996). Transformations in dissolved and particulate P fractions also need to be minimised during sampling and the subsequent period between sampling and laboratory analysis (Bartram and Balance, 1996; Chapman, 1996). Given seasonal and storm-period variability in P concentrations in river water (e.g. Svendsen et al., 1995; Jarvie et al., 1998), gaining acceptable representation of temporal variability requires understanding of the bias and precision of different sampling strategies, particularly the frequency of sampling (Kronvang and Bruhn, 1996; Stevens and Smith, 1978; Walling and Webb, 1982). New developments in continuous monitors (Wiryawan, 2000; Hanrahan et al., 2001) offer improved means of sampling short-term variations in P concentrations. The variability in water quality in a river cross-section is also often significant because of incomplete mixing of upstream tributary or point-source inputs and groundwater seepage. Variations in velocity and channel geomorphology may also affect distribution and transport of particulates (Horowitz, 1996). Surface grab-sampling methods are commonly employed for stream water sampling, owing to speed and efficiency of sample collection. Good grab-sampling practice necessitates that samples are collected from mid-stream, away from the more quiescent margins of the river (Leeks
et al., 1997). However, surface-grab sampling may result
in profound underestimation of concentrations of sediment-associated water-quality determinands, compared with more time-consuming methods of cross-sectionally integrated sampling (e.g. Martin et al., 1992; Bartram and Ballance, 1996).
Automatic water samplers can provide a valuable addition to manual sampling programmes, particularly for intensive sampling campaigns in remote areas and at times when deployment of personnel is problematic. Automatic water samplers can be linked to continuous stage or turbidity loggers and programmed to sample at different frequencies according to changing river flow or turbidity conditions (Evans et al., 1997). Successful automated sampling for P monitoring has been reported (e.g. Svendsen et al. (1995); Dils and Heathwaite (1996) and House et al. (1997)).
Drawbacks to automated sampling include the logistical constraints that mean that it may be some days before samples can be retrieved, filtered and returned to the laboratory for analysis. This introduces potential for storage errors, where physical, chemical and biological processes can alter the speciation of both dissolved and particulate forms of P (e.g. Lambert et al., 1992). The variable length of storage in the autosampler means that potential storage errors increase from the last to the first bottle in the sampling series. In one study, losses of up to 67% in total P were reported after 6 days’ storage in an autosampler; these were attributed to adsorption associated with microbial uptake and chemical precipitation on internal container surfaces (Kotlash and Chessman, 1998). Other drawbacks of automated sampling relate to the efficiency of pumping of water from the river to the sample bottle (which may result in preferential sampling of finer particulate material in suspension) and the fact that the sampler inlet tube may have to be located close to the riverbank, rather in the mid-stream to minimise disruption to river traffic. Both of these factors may result, in some circumstances, in poor representation of concentrations of sediment-associated P within the sample. Automated sampling should be run alongside periodic conventional manual sampling to facilitate crosschecking and rigorous quality assurance is essential to ensure minimal sample degradation on storage.
Storage of samples prior to P analysis
Phosphorus fractions can be highly unstable on storage. Phosphorus is sensitive to transformations between different species as well as to uptake by micro-organisms and adsorption and desorption from particulates and the surfaces of the container vessel during both long- and short-term storage (Bull et al., 1994; Haygarth et al., 1995). Transformations in individual P species during storage can, therefore, result in increases or decreases in concentrations of the P fractions that are measured routinely in water quality programmes (Gilmartin, 1967). Phosphorus transformations may occur during storage because of several processes. These processes include:z Hydrolysis of organic/polymeric P (Ron Vaz et al., 1994), producing increases in SRP but decreases in DHP.
z Adsorption or desorption interactions producing decreases or increases in SRP (Latterell et al., 1974). z Chemical precipitation reactions resulting in loss of SRP
(Johnson et al., 1975; Avanzino and Kennedy, 1993). z Microbial uptake (SRP/TDP loss) and mineralisation
(SRP gains) (Gilmartin, 1967; Jansson, 1988).
z Cell lysis, resulting in increases in SRP and TDP (Fitzgerald and Faust, 1967; Nelson and Romkens, 1972).
Although many studies report degradation of SRP on storage (see next section on filtration), additional losses of TP and TDP may occur because of uptake onto the walls of the containing vessel and/or algal biofilms that form on these internal surfaces. For example, Neal et al. (2000a) report losses of TDP and TP in overnight storage of the order of 10% for samples collected in a lowland UK river (the River Wear). To ensure that measured concentrations are representative of those within the river at the time of sampling, water samples should be analysed immediately following sampling. In most field studies, such rapid analysis is not achievable. While field analysis equipment is available (e.g. Worsfold et al., 1987; Hanrahan et al., 2001), in situ analysis is not used widely owing to cost and high maintenance requirements. Hence, samples are generally returned to the laboratory for analysis. It is, therefore, critically important to minimise the physical, chemical and biological processes that can alter P speciation during this period of storage between field sampling and chemical analysis.
Many factors are involved in designing optimum storage conditions for P. These factors include:
z Filtration technique;
z Storage container and its pre-treatment;
z Physical conditions of storage (temperature, light, storage time);
z Use of chemical preservatives (Maher and Woo, 1998; Gardolinski et al., 2001).
The potential for degradation of samples and the rate of transformations (particularly in relation to SRP and TDP) are highly variable, and are linked to a variety of factors associated with sample composition, which may include initial P concentrations, matrix chemistry, biological status of the sample and the content of organic matter, sediment and colloids. It is, therefore, difficult to design a single standardised storage protocol for natural waters due to the contrasting physico-chemical and biological characteristics of water samples (Lambert et al., 1992; Haygarth et al., 1995; Maher and Woo, 1998; Gardolinski et al., 2001). Indeed, within one major research programme, the Land Ocean Interaction Study (LOIS), the standard protocol used for was for SRP to be determined as soon as possible after sampling and certainly on the day of sampling (Leeks et
al., 1997); this is standard procedure within organisations
FILTRATION
Filtration is required for the determination of dissolved P (SRP and TDP) concentrations and the most common method of filtration uses 0.45 µm cellulose-nitrate-acetate (CNA) filters. A filtration step is required to remove two types of material. Firstly, bacteria and phytoplankton, which may alter dissolved P concentrations by uptake, breakdown of organic/polymeric fractions and release P on death by lysis. Secondly, particulate materials which may adsorb or release P on standing. Lambert et al. (1992) demonstrated very rapid changes in SRP and TDP concentrations following sampling of Australian lake waters; he concluded that, if samples were not filtered within one hour of sampling, SRP and TDP measurements may be meaningless. However, in other studies, concentrations of unfiltered samples changed very little over time scales of up to two hours, but may be subject to transformations after several days or weeks of storage (Bull et al., 1994; Haygarth et al., 1995). As a precautionary approach, for samples that will be analysed for dissolved P fractions, field filtration is recommended immediately upon sampling and prior to storage (e.g. Lambert et al., 1992, Haygarth et al., 1995; Maher and Woo, 1998).
Nonetheless, there are several important filtration issues for determination of P fractions. For example, although filtration through 0.45 µm membranes screens out a large proportion of the particulates and micro-organisms from the water sample, the filtration process may neither remove femtoplankton and picoplankton completely from water samples (Stockner et al., 1990) nor colloidal particulate materials (Lambert et al., 1992; Haygarth et al., 1997). Therefore, a 0.45µm operational separation fails to discriminate truly dissolved P concentrations (Olsen, 1967) and care must be exercised in interpreting SRP and TDP for partitioning of P between solid and solution phases. Furthermore, filtration itself may be responsible for changes in dissolved P concentrations measured in the filtrate, due to:
z Retention of dissolved-P by the filter (Schierup and Riemann, 1979).
z Wetting agents in certain filter membranes interfering with the colorimetric measurement of P (Bickford and Willett, 1981).
z Mechanical effects of vacuum pressure, causing destabilisation of colloids and flocs (Broberg and Pettersson, 1988) and rupture of algal cells, releasing dissolved P (Bloesch and Gavrielli, 1984).
z Reductions in effective pore size by progressive blocking of filters during the filtration process, affecting
the passage of colloids through the membrane. The nature of pore size reduction is dependent on the volume of sample filtered and its sediment loading. However, these effects may be reduced by centrifuging samples prior to filtration (Eisenreich et al., 1975). Such filtration artefacts have been well documented for metals (e.g. Danielsson, 1982; Horowitz et al., 1992, 1996; Jarvie
et al., 2000). However, the effects on ‘dissolved’ P
concentrations of changes in colloid transmission associated with progressive blockage of filter papers are poorly understood. Given the strong association of P with sediments and colloids (Haygarth et al., 1997; Shand et al., 2000), these effects are potentially important sources of error in determining SRP and DHP concentrations.
STORAGE CONTAINER AND PRE-TREATMENT During the collection and storage of samples, SRP is subject to sorption to the surfaces of the container. Given its relatively high charge density, the orthophosphate ion has a high affinity for adsorption compared with many other anions found in natural waters (Latterell et al., 1974). The magnitude of adsorption depends on the container material, its pre-treatment, the surface area to volume ratio of the container and the concentration of P in the sample and its matrix chemistry. Phosphorus sorption is related primarily to anion exchange reactions: both plastic and glass bottles have positively charged ion-exchange sites, which become balanced by sorption of negatively-charged counter ions from the sample solution. Preferential electrostatic bonding occurs for counter ions with highest valance, lowest solvated volume and greatest polarisability, since these ions form the most stable soluble complexes (Latterell et al., 1974). Therefore, in samples of high ionic strength, there is greater potential for competition between anions in solution for the ion exchange sites on the container surface and adsorption of P is reduced. In samples of low ionic strength, greater P sorption losses have been observed (Maher and Woo, 1998). Indeed, adsorption of P by containers is also greater for P standards prepared in distilled water than in natural waters during storage (Ryden et al., 1972).
Proportional losses are greatest in samples with low P concentrations (Ryden et al., 1972; Latterell et al., 1974), while samples stored in small bottles with a high surface area to volume ratio may also be subject to higher surface adsorption losses (Latterell et al., 1974; Maher and Woo, 1998). Haygarth et al. (1995) demonstrated significantly greater losses of SRP for smaller (30 ml) bottles, compared with larger (25 l) bottles during storage. It is therefore recommended that bottles for storage of samples for SRP
and TDP analysis should be as large as practicable to minimise sorption effects.
Pre-treatment of bottles can have an important effect on P sorption during sample storage. Only phosphorus-free detergents, such as Decon, are recommended during cleaning of sampling and storage vessels for P monitoring programmes (Haygarth and Edwards, 2000). Rinsing plastic bottles with dilute acid (e.g. 10% v/v H2SO4 or HCl) reduces adsorption by saturating sorption sites and killing micro-organisms which may grow on the walls of the container (Clementson and Wayte, 1992). However, this treatment, when applied to glass bottles, can actually increase P adsorption by creating active adsorption sites (Ryden et al., 1972). Pre-treatment of glass bottles with HF has been reported to reduce sorption of P (Hassentuefel et al., 1963). Heron (1962) and Latterell et al. (1974) demonstrated reduced adsorption of SRP in bottles treated with iodine in potassium iodide solution. Pragmatic issues, such as the difficulties in using glass bottles in the field, and safety issues, related to use of HF and other bottle treatment procedures, need to be considered carefully in relation to the effectiveness of reducing sorption effects. It seems that acid-washed low-density polyethylene containers are generally suitable for the storage of most types of water samples, although PTFE storage vessels were slightly better at minimising P-sorption effects than polyethylene bottles of the same capacity (Haygarth et al., 1995; Haygarth and Edwards, 2000). Surface adsorption may be important quantitatively only for samples of low ionic strength and low P concentrations. Desorption of P can be problematic where sample bottles are re-used and, therefore, thorough treatment of polyethylene bottles with dilute HCl and washing with deionized water is recommended before re-use (Latterell et al., 1974).
PHYSICAL CONDITIONS OF STORAGE
Refrigeration is commonly used for storing water samples prior to analysis, with freezing used as an alternative method for long-term sample storage (Gardolinski et al., 2001). Low temperatures reduce the activity of micro-organisms present in the sample thereby reducing microbially-mediated P-transformations. Refrigeration (at 4oC) is generally the
preferred means of storage of samples on timescales of hours to days. However, the effectiveness of refrigeration reported in publications is variable. One study showed that river and lake samples could be stored at 4oC for up to eight days
without decreases in SRP or TP (Fishman et al., 1986). However, other studies have demonstrated changes in SRP within (a) 24–48 h for refrigerated soil water samples (Haygarth et al., 1995), (b) 12 hours, especially where
samples contained significant quantities of suspended material (Johnson et al., 1975) and (c) four hours of refrigeration (a 28–45% loss of TDP and a 36–58% loss of SRP in lake water samples; Lambert et al., 1992).
Freezing is generally used only as a method of long-term preservation, on timescales of weeks, months or even years. Again, the reported effectiveness of freezing for storage of samples for P determination is variable. For example, in certain circumstances, frozen storage may be a very effective means of SRP storage for periods of up to four–eight years (Avanzino and Kennedy, 1993). However, for certain types of samples, changes in SRP concentration occur during the freezing process, making frozen storage unsuitable. For example, many hard waters can form a calcium carbonate precipitate on freezing, which may co-precipitate or occlude SRP in the process and Johnson et al. (1975) report a 33–78% loss of SRP on freezing. Similarly, significant losses in SRP on freezing may occur, due to oxidation and ferric ion precipitation with phosphate (Avanzino and Kennedy, 1993). Freezing may also rupture cells, releasing P (Nelson and Romkens, 1972), so it is important to filter samples for TDP and SRP determination before freezing (Maher and Woo, 1998). Light exclusion, which is common to both refrigerated and frozen storage, reduces algal growth and thus SRP and TDP uptake by inhibiting photosynthesis and is therefore a highly desirable component of any storage regime (Haygarth et al., 1995).
CHEMICAL PRESERVATIVES
The main purpose of addition of chemical preservatives is to improve P stability on storage by stopping metabolic processes and thus reducing the transformation of P species by micro-organisms within the sample. Preservatives commonly used for sample stabilisation (with varying degrees of success) include chloroform (Gilmartin, 1967; Pichet et al., 1979), mercuric chloride (Skjemstad and Reeve, 1978; Fishman et al., 1986), iodine (Mackereth et
al., 1978) and H2SO4 (Henriksen, 1969). However, the application of chemical preservatives may be problematic (Haygarth et al., 1995). Chloroform can result in the immediate release of SRP from particles and algal cells (Fitzgerald and Faust, 1967) and can interfere with the colorimetric determination of P (Skjemstad and Reeve, 1978). Mercuric chloride and H2SO4 can hydrolyse organic compounds during storage, releasing SRP (Henriksen, 1969). Mercuric chloride can also precipitate bacteria and proteins (Maher and Woo, 1998) and interfere with the colorimetric determination of P (Skjemstad and Reeve, 1978; Haygarth et al., 1995). Potassium persulphate has been used by Neal et al. (2000a) to reduce losses of TDP and TP
on storage. Addition of potassium persulphate immediately following sampling (for TP) and after field filtration (for TDP) overcame problems of TDP and TP losses for storage periods of up to three days prior to analysis (Neal et al., 2000a). This improved stability of TP and TDP following potassium persulphate treatment is possibly because the sterilising effect of the strongly oxidising environment inhibited biological activity within the sample and reduced development of algal biofilms on the internal surfaces of the container. The use of potassium persulphate as a chemical preservative in the storage of samples for TDP and TP determination clearly merits further investigation, although this method cannot be used for preservation of samples for SRP, owing to the hydrolysis of organic and polymeric forms of P to SRP in the presence of a strong oxidant.
Following this review, it is reasonable to conclude that, in general, the use of chemical preservatives for SRP determination should be approached only with extreme caution, given the risks of accelerated release of SRP from sediment particles, bacteria and algae, even in filtered samples, and contamination and colorimetric interference problems (Haygarth et al., 1995; Maher and Woo, 1998).
Synthesis: examining potential
sensitivities of different waters to
sampling, storage and analytical
errors
River waters are highly heterogeneous in terms of their physical, chemical and biological composition and reactivity. Geology, land use, agriculture and sewage inputs have a major control on river-water quality in terms of matrix chemistry, P and suspended sediment concentrations. The biological status of river waters ranges from ultra-oligotrophic to hyper-eutrophic, and there are large contrasts in sensitivity of river water samples to degradation on storage (Maher and Woo, 1998). The microbial composition and water chemistry of river water often exhibits pronounced seasonal variability, leading to temporal changes in sensitivity to storage and analytical errors (e.g. Henriksen, 1969). The following section examines potential sensitivity of different river waters to errors associated with sampling, storage and analysis of P in terms of three river water types: oligotrophic waters, turbid waters and eutrophic waters. In addition, the effects of matrix chemistry are examined in terms of potential for storage and analytical error.
OLIGOTROPHIC WATERS
Oligotrophic rivers in the UK are classified as having mean annual SRP concentrations of less than 20µg-P l-1
(Environment Agency, 2000). Rivers with these low or background P concentrations are most vulnerable to storage and analytical errors since percentage errors are greatest where initial concentrations are low. Given the limited supply of nutrients in the sample, biological loss of P on storage may be a problem and, at SRP concentrations of less than 20 µg-P l-1, adsorption to containers may be another
important source of P loss (Maher and Woo, 1998). Low P concentrations result in slower formation rate of the phosphomolydenum blue complex (Sjosten and Blomqvist, 1993) and underestimation of concentrations is a risk if readings are made before colour formation is complete. This may be a particularly important source of analytical error when using automated analytical systems. The relatively low intensity of colour formation at low P concentrations also makes samples more sensitive to matrix (e.g. Si) interference effects (Neal et al., 2000b).
TURBID WATERS
In rivers carrying high suspended-sediment loads, relatively high proportions of the total P load are transported in the particulate phase. Sampling to gain accurate representation of the concentrations of determinands in the particulate phase may be hampered by the cross-sectional heterogeneity in particulate concentrations (Martin et al., 1992) requiring cross-sectionally integrated sampling. High suspended-sediment concentrations are also significant for automated sampling, where the efficiency of the pumping mechanism can affect the recovery of particulates and, thus, sampled TP concentrations. As turbidity increases, concentrations of colloids available to pass through the membrane filter also tend to increase. Blocking of filter membranes and increased pressure required for filtration can lead to destabilisation of flocs and generation of microparticulates. However, further clogging of filters can also serve to reduce effective membrane pore size progressively and reduce the passage of colloids into the filtrate (Horowitz et al., 1992, 1996; Haygarth et al., 1997; Jarvie et al., 2000), although the implications of these effects for P concentrations are, at present, poorly understood.
High suspended-sediment loadings must be considered when designing sample digestion procedures for TP, particularly in relation to reagent concentrations and digestion temperature. The digestion technique must be tailored to the suspended sediment/carbon content within the sample, to ensure complete oxidisation of the sample and release of P. Indeed, some workers recommend the use
of microwave digestion for recovery of P from turbid samples because of the higher pressures and temperatures generated (Maher and Woo, 1998; Johnes and Heathwaite, 1992). In cases where mineral particulates remain in suspension after the digestion process, particulate interference with the colorimetric determination of TP concentrations may be an important source of analytical error. Possible solutions to particulate interference include centrifugation (Eisenreich et al., 1975), or sample filtration to remove particulates prior to addition of the colour reagent. However, at present, there seems to be no standardised recommendations for overcoming these problems of particulate interference following sample digestion. EUTROPHIC WATERS
Water samples collected from eutrophic rivers (which are defined as having mean annual SRP concentrations typically > 200µg-P/l, Environment Agency, 2000), and which are also microbiologically enriched, may be particularly susceptible to loss of SRP during storage by uptake by bacteria and algae. The rate of growth of these microbiological populations (and hence sample degradation) can be reduced by immediate filtration on sampling, refrigerated storage on transport to the laboratory and minimising the time between sampling and analysis (Haygarth et al., 1995).
MATRIX CHEMISTRY
Ionic strength and Ca2+ concentration are important aspects
of sample matrix chemistry in terms of sample storage. Ionic strength can control surface adsorption of P to the sides of storage containers, with reduced phosphate adsorption in samples of high ionic strength as a result of greater anionic competition for surface sorption sites (Maher and Woo, 1998). Samples from hard-water areas with high Ca2+
concentration (typically >100 mg l-1) may be susceptible to
loss of SRP on freezing, because of co-precipitation of CaCO3 with P (Avanzino and Kennedy, 1993; Gardolinski
et al., 2001). Acidity determines whether ligands complex
with P, and DOC, Ca, Fe and Al can all act as P-complexation agents, bringing about reductions in the molybdate reactive P-fraction on storage (Haygarth et al., 1995). Certain matrix chemistries are particularly susceptible to changes in physical and chemical conditions on sampling or storage. For example, samples with high Fe concentrations collected from strongly reducing environments, can undergo large losses of SRP on oxidation due to ferric ion precipitation with phosphate (Avanzino and Kennedy, 1993). Degassing of carbon dioxide following sampling can result in
co-precipitation of CaCO3 with P and loss of SRP from solution (House et al., 1986). The efficiency of sample digestion for TDP and TP analysis may also be affected by the DOC concentrations within the matrix. In samples with high DOC concentrations, the effectiveness of the oxidising agent may be diminished by mineralisation of organic carbon in solution (Williams et al., 1995; Maher and Woo, 1998).
The acid-neutralisation capacity/alkalinity of the sample and the concentrations of interfering species, such as Si, As and F, can have important effects on the accuracy and precision of the colorimetric analysis of P concentrations (Blomqvist et al., 1993). The acid neutralisation capacity/ alkalinity of a sample may have important implications for the formation of the blue complex in response to P concentrations, by altering the effective [H+]:[MoO
42-] molar
ratio. Where reagent acid-strength fails to take account of a high acid-neutralisation capacity, the [H+]:[MoO
42-] molar
ratio may be reduced to levels where self reduction of the molybdate ion (‘non-phosphate sensitised reduction’) occurs (Going and Eisenreich, 1974); this may cause over-prediction of P concentrations within the sample. Si and As are both responsible for formation of a blue complex during the molybdate reaction, which may interfere with the colorimetric response to P concentrations, especially where P concentrations are low (Neal et al., 2000b). Fluoride slows down the development of the phosphomolybdenum blue complex (although it does not affect the maximum absorbance level) (Blomqvist et al., 1993). The rate and intensity of response to Si matrix interference effects are particularly problematic in automated analytical procedures, when reagents and samples are heated to speed up the rate of formation of phosphomolybdic acid, and where the strength of the sulphuric acid reagent is too low, given the matrix control on acid neutralisation (Neal et al., 2000b).
Recommending guidelines for
sampling, storage and analysis of
phosphorus
The following pragmatic considerations need attention in the design of any monitoring programme for P:
z Is P fractionation necessary, or would TP measurements suffice?
z What kind of monitoring and analysis programmes is required for modelling P fractionation and sediment-water interactions?
z How valuable are measurements of bioavailable P compared with conventional P measurements? z What levels of accuracy and precision of P fraction
concentrations are acceptable/desirable given the restrictions on resource availability?
z Can reliable P measurements be made by conventional means when samples are collected from remote sites, given storage problems and distance from analytical facilities? In these cases, are alternative methods of P determination required (e.g. stabilisation using Fe impregnated paper strips or in-situ/field testing kits)? Given the very wide range of river water characteristics, susceptibility to storage transformations, analytical interference effects and sensitivity to analytical conditions, it is not possible to recommend one standardised protocol for sampling, storage and analysis of P in river waters. Here, two ways forward are proposed, based on ‘good practice’ and ‘precautionary practice’ guidelines. The ‘good practice’ approach involves developing a suite of procedures tailored to site-specific conditions. Guidelines for ‘precautionary practice’ are based on some of the more stringent practices necessary to minimise storage and analytical errors, for initial monitoring and where site-specific method testing is not practicable.
‘GOOD PRACTICE’ GUIDELINES: A STARTING POINT FOR DESIGNING SITE-SPECIFIC PHOSPHORUS MONITORING PROTOCOLS The aim of ‘good practice’ recommendations is:
z To encourage the researcher to consider potential sources of error in relation to the characteristics of the sample being analysed;
z To provide a decision-support framework for site-specific method testing, based on rigorous quality control and assurance, so as to develop a suite of procedures to minimise errors of sampling, storage and analysis for the river system being monitored.
River water characteristics
A summary of some of the major sources and risks of error for monitoring P in river waters is provided in Table 1 in relation to five key river water characteristics (oligotrophic, turbid, eutrophic, calcareous and organic) and, where appropriate, suggestions for problem minimisation are offered. Table 1 is not intended to provide an exhaustive account of sources of sampling, storage and analytical error; it is simply a guide to highlight potential sources of error.
Site-specific method testing
For each monitoring programme, the sampling, storage and analysis protocols must be tailored to site-specific conditions and the expected variability in those conditions over the monitoring period. This tailoring is needed to minimise errors to within acceptable limits as defined explicitly according to the rationale of the monitoring programme. Site-specific effects may be linked to:
z The inherent spatial and temporal variability in riverine P concentrations and sample composition;
z The effects of filtration methods on sample concentrations;
z Sample stability on storage;
z The formation rate of the phosphomolybdenum blue complex;
z Matrix interference effects.
Table 2 illustrates the possible sampling, storage and analysis procedures which might be adopted for analysis of SRP, TDP and TP in river water, and highlights the issues requiring rigorous quality control.
‘PRECAUTIONARY PRACTICE’ GUIDELINES
The aim of ‘precautionary practice’ is to suggest some guidelines for sampling, storage and analysis procedures for P, in situations where full method and stability testing is not immediately available; for example, where a monitoring programme needs to start at short notice and where it is anticipated that waters will be highly susceptible to storage and/or analytical errors. The following ‘precautionary practice’ guidelines are offered as suggestions, based on large-scale monitoring programmes carried out by the Centre for Ecology and Hydrology for east-coast British rivers draining into the North Sea (Leeks et al., 1997; Jarvie et
al., 1998) and for the Thames basin (Neal et al., 2000b;
Jarvie et al., 2002). Many of the practices listed below are standard for many researchers in environmental chemistry and environmental biology. However, for each monitoring programme, the onus is on the researcher to adopt suitable quality control and quality assurance schemes alongside any monitoring programme.
1. Sampling. Manual sampling is recommended as a
precautionary measure, with pre-washing of bottles with the river water prior to collection of the sample. Either sampling should be cross-sectionally or depth integrated or, at the very least, collected from the mid-stream, away from quiescent margins of the river.
Table 1.
Potential problems and possible solutions in monitoring phosphorus concentrations in oligotrophic, turbid, eutrophic, calcareou
s and or ganic waters W ater T ype Potential pr oblems Pr oblem minimisation 1. Oligotrophic
Low SRP concentrations can result in:
(SRP concen- trations
z
Greater proportional loss on storage by biological uptake
Use PTFE bottles or pre-wash polyethylene bottles with 10% v/v H
2 SO 4 , followed by < c.20 µ g-Pl -1)
and physico-chemical adsorption.
thorough rinsing in distilled deionised water
. Use lar
gest bottles possible (with lowest surfa
ce
area:volume ratio), preferably >100ml capacity
z
High potential for desorption and sample contamination
Bottle type and treatment as above
when sample bottles are re-used. z Slower rates of formation of phosphomolybdenum blue
Ensure that calibration standards cover the appropriate range of expected S
RP concentrations.
complex, which may lead to serious underestimation of SRP
Postpone spectrophotometric analysis until full colour development of
the
phospho-concentrations, particularly if the phosphate concentration
molybdenum blue complex has been achieved, or ensure that the reacti
on solution
and the temperature of the analysed sample are lower than
reaches an appropriate temperature upon mixing (Sjosten and Blomqvist,
1997). Heating
the calibration standard.
can be used to speed up reaction rates, but introduction of a heating step needs to be carefully monitored as this may increase matrix interference ef
fects.
z
Low intensity of colour formation, making samples more
A pragmatic approach to dealing with interference ef
fects, based on use
of mixed-matrix
sensitive to matrix interference ef
fects and over-estimation
standards is described in the ‘precautionary practice’ guidelines.
Interference ef
fects
of SRP concentrations.
for Si may be overcome by adjusting acid concentrations in the reagent recipe. Due to dif
ferences in formation rate of interference complexes, it is important that
spectrophotometric analysis is timed to coincide with maximum development of the phosphomolybdenum blue complex.
2. T
urbid
High particulate concentrations:
(suspended sediment z High cross-sectional and temporal variability in
Representative sampling for particulates may require depth/cross-sectionally in
tegrated
concentrations
sediment-associated P concentrations (compared with
sampling and intensive storm-event sampling
>c. 100mg l
-1)
dissolved concentrations). zProgressive blocking of filter membranes may result in
Pre-wash filter using 30 ml of sample and discard this initial filtrate. reduction in ef
fective pore size (this will depend on
Filter fixed-volume aliquots
suspended-sediment concentration and volume filtered) zDestabilisation
of flocs and colloid generation as a
Careful vacuum filtration. Haygarth and Edwards (2000) recommend that the p
ressure of
result of the mechanics of filtration
filtration should not ordinarily exceed 80 kPa
z
Incomplete digestion of sample for TP analysis when
Need to ensure digestion reagent concentrations are suf ficiently high; use of microwave
sediment concentrations are high may cause (i)
under-digestion (greater temperatures and pressures generated) or change to a mo
re rigorous oxidant.
estimation of TP concentrations and (ii) particulate
To
minimise particulate interference, samples may be filtered after digesti
on and prior to
interference of spectrophotometric analysis.
3. Eutrophic
Samples with high microbiological components are
(SRP sensitive to: concentrations > c. 200 µ g-P l -1) z T
ransformations in phophsorus fractions by biological
Filter
in
the field immediately following sampling. Refrigerate samples in
the dark during
uptake and breakdown of or
ganic compounds
transport and on arrival back at the laboratory
. Analyses to be undertaken within 24h
of
sampling. If possible SRP analysis to be undertaken on same day of sampling.
z
Adsorption/uptake by microbial populations on internal
Pre-treat
bottles
(with
dilute acid, see above) to inhibit microbial grow
th on internal bottle
surfaces of bottle
surfaces.
z
L
ysis of microbial cells on death can release SRP and
Careful filtration to minimise mechanical disruption (see above). A void us e of biocidal TDP into sample chemical preservatives. A
void freezing unfiltered samples, as freezing can rupture cells.
4. Calcareous z Samples collected from hardwater areas are susceptible
Do not use frozen storage for preservation of calcareous samples for P an
alyses. Store samples
(Ca
2+
concentra-to loss of SRP on degassing of CO
2
and on frozen storage
in air-tight containers, completely filled, to minimise degassing of samples during transit.
tions > 100 mg l
-1)
(by co-precipitation of CaCO
3
-P).
z
High alkalinity/acid-neutralisation capacity may reduce
Adjust reagent acid concentration to ensure that, following reaction wit
h Ca 2+ in sample, the ef fective [H +]:[MoO 4 2-] molar ratio, af fecting reaction [H +]:[MoO 4
2-] ratios lie within the prescribed range between 60 and 80
kinetics. 5. Or ganic z Samples with high or ganic content may be susceptible
As above, filter in the field and refrigerate prior to analysis If possibl
e undertake all P
to degradation of particulate or
ganic P or DHP on storage,
analyses on the same day as sampling
releasing SRP
.
z
Dissolved or
ganic carbon may act as a ligand for removal
Minimise storage by undertaking analyses on same day as sampling of molybdate reactive P , reducing SRP concentrations on storage. zE ffectiveness of the oxidizing agent may be diminished
As above, need to ensure digestion reagent concentrations are suf
ficientl
y high; use of
by mineralization of excessive or
ganic carbon
microwave digestion (greater temperatures and pressures generated)
Table 2. Summary of the major quality control issues for monitoring phosphorus in rivers
Procedure Quality control issues
Sampling:
zManual (grab versus cross-sectionally integrated) How representative is the sampling strategy in space
zAutomated and time for both dissolved and particulate
zTemporal frequency components?
How stable are P fractions during storage in an autosampler?
Filtration (for SRP/TDP):
zField versus laboratory filtration How stable are samples which remain unfiltered zFilter type, diameter and pore size during storage, compared with filtered samples? zFiltration method (pre-washing, volume,
sediment loading of sample) How important is particulate/colloid retention during filtering and how reproducible are the results?
Sampling/storage container
zMaterial (PTFE, polyethylene, glass) Have type and size of container been considered? zSize (surface area: volume)
zPre-treatment (dilute acid, iodine etc.) Is additional pre-treatment of container necessary to inhibit microbial activity or inhibit adsorption to container sides?
Storage conditions
zLength of time of storage prior to analysis How stable are samples under different storage zStorage temperature and light conditions conditions over different time scales?
zUse of preservatives (not generally recommended) Digestion method (for TDP and TP)
z Oxidant (acid-persulphate versus more rigorous How accurate and precise is the digestion method? digestion techniques) and reagent concentrations
zHeating environment (autoclave, microwave) How rigorous is the digestion method? Phosphomolybdenum blue method
zReagent recipes for optimal production of the How important are matrix interference effects for phosphomolybdenum blue complex both dissolved and particulate P fractions? zHeating step to speed up rate of colour development
zTiming of spectrohotometric analysis How are rates of colour development affected by zCalibration with or without mixed-matrix standards sample P concentrations, matrix interference (see guidelines for ‘precautionary practice’) effects?
What is the accuracy and precision of each method?
2. Filtration. Field filtration of samples for SRP and TDP,
using 0.45µm CNA filters (45 mm diameter). Filters should be pre-flushed with 30 ml of sample, prior to sample collection.
3. Transportation and storage. Samples should be
transported back to the laboratory in a cool opaque box and then kept in a refrigerator at 4oC on arrival. SRP
analysis should be performed on the same day as sample
collection. This effectively bypasses storage problems for SRP. TDP and TP analysis should be carried out within 24 hours of sample collection.
4. Analysis. Regarding the matrix interference effects
associated with the analytical determination of P fractions, the major elements of concern for river waters (as indicated above) are arsenic, fluoride, and silica. For most river waters, these interferences would be low,
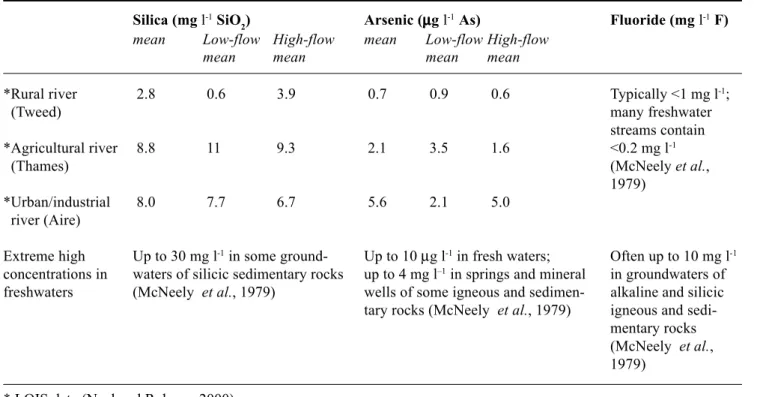
but there may be problems for certain methodologies, particularly where P concentrations are very low. Although most P analyses are based on the Murphy and Riley (1962) method, different reagent recipes and sample processing techniques can result in differences in sensitivity to interference effects. For example, problems with silica interference can occur when the reagent acid strength is too low (Neal et al., 2000b). The standard way of testing or allowing for matrix interferences is to make up calibration solutions containing the various interfering chemical species and to determine whether there are any differences in the colorimetric absorption patterns. For many phosphate analyses undertaken, there may be no concentration data for the interfering chemical species and hence it is not possible to determine accurately what levels of interfering components should be added to a mixed standard. For pragmatic purposes, it is recommended that a simple test comparing calibration samples with and without matrix interferences are performed using representative concentrations for surface waters. Table 3 shows typical concentrations of As, F and Si for UK rivers representative of a range of catchment characteristics (urban/industrial, agricultural and rural) based on literature searches and the comprehensive
analysis of UK surface waters within the Land-Ocean Interaction Study (Neal and Robson, 2000), which may be used in the mixed standards. If both the standards with and without interfering matrix components have the same absorbance (within analytical error) then the interference effects are negligible and normal calibration procedures may be used without the presence of the interference matrix. However, if the two types of calibration differ, then mixed standards are required for the calibration. In areas with potentially very high concentrations of interfering species (e.g. granitic areas with high mineralisation may be considerably enriched in arsenic and fluoride), then stringent interference testing is required. In addition, under exceptional (highly reducing) conditions, sulphide might also interfere. This can be eliminated simply by aeration until no hydrogen sulphide odour can be detected.
Conclusions
River waters exhibit a high degree of heterogeneity in composition and characteristics in both space and time. This inherent variability needs to be considered in the design of protocols for P sampling, storage and analysis. River water composition can control the fractionation and stability of P
Table 3. Typical concentrations of Si, As and F in representative (rural, agricultural and urban) rivers and expected
high-concentration extremes
Silica (mg l-1 SiO
2) Arsenic (µµµµµg l-1 As) Fluoride (mg l-1 F)
mean Low-flow High-flow mean Low-flow High-flow
mean mean mean mean
*Rural river 2.8 0.6 3.9 0.7 0.9 0.6 Typically <1 mg l-1;
(Tweed) many freshwater
streams contain
*Agricultural river 8.8 11 9.3 2.1 3.5 1.6 <0.2 mg l-1
(Thames) (McNeely et al.,
1979)
*Urban/industrial 8.0 7.7 6.7 5.6 2.1 5.0
river (Aire)
Extreme high Up to 30 mg l-1 in some ground- Up to 10 µg l-1 in fresh waters; Often up to 10 mg l-1
concentrations in waters of silicic sedimentary rocks up to 4 mg l–1 in springs and mineral in groundwaters of
freshwaters (McNeely et al., 1979) wells of some igneous and sedimen- alkaline and silicic tary rocks (McNeely et al., 1979) igneous and
sedi-mentary rocks (McNeely et al., 1979)