HAL Id: hal-03003377
https://hal.archives-ouvertes.fr/hal-03003377
Submitted on 20 Nov 2020
HAL is a multi-disciplinary open access
archive for the deposit and dissemination of
sci-entific research documents, whether they are
pub-lished or not. The documents may come from
teaching and research institutions in France or
abroad, or from public or private research centers.
L’archive ouverte pluridisciplinaire HAL, est
destinée au dépôt et à la diffusion de documents
scientifiques de niveau recherche, publiés ou non,
émanant des établissements d’enseignement et de
recherche français ou étrangers, des laboratoires
publics ou privés.
Structural reorganization of the antigen-binding groove
of human CD1b for presentation of mycobacterial
sulfoglycolipids
L Garcia-Alles, A Collmann, C Versluis, B Lindner, J Guiard, L Maveyraud,
E Huc, Jin S. Im, S Sansano, T Brando, et al.
To cite this version:
L Garcia-Alles, A Collmann, C Versluis, B Lindner, J Guiard, et al.. Structural reorganization of the
antigen-binding groove of human CD1b for presentation of mycobacterial sulfoglycolipids. Proceedings
of the National Academy of Sciences of the United States of America , National Academy of Sciences,
2011, 108 (43), pp.17755 - 17760. �10.1073/pnas.1110118108�. �hal-03003377�
Structural reorganization of the antigen-binding
groove of human CD1b for presentation of
mycobacterial sulfoglycolipids
Luis F. Garcia-Allesa,b,1, Anthony Collmannc, Cees Versluisd, Buko Lindnere, Julie Guiarda,b, Laurent Maveyrauda,b, Emilie Huca,b, Jin S. Imf, Sebastiano Sansanoc, Thérèse Brandoa,b, Sylviane Juliena,b, Jacques Prandia,b,
Martine Gillerona,b, Steven A. Porcellif, Henri de la Salleg,h,i, Albert J. R. Heckd, Lucia Moric,j, Germain Puzoa,b, Lionel Moureya,b,1, and Gennaro De Liberoc,1
aCentre National de la Recherche Scientifique, Institut de Pharmacologie et de Biologie Structurale, F-31077 Toulouse, France ;bUniversité de Toulouse,
Université Paul Sabatier, Institut de Pharmacologie et de Biologie Structurale, F-31077 Toulouse, France;cExperimental Immunology, Department of
Biomedicine, Basel University Hospital, CH-4031 Basel, Switzerland;dBiomolecular Mass Spectrometry and Proteomics Group, Bijvoet Center for Biomolecular
Research and Utrecht Institute for Pharmaceutical Sciences, Utrecht University, and Netherlands Proteomics Centre, 3584 CH, Utrecht, The Netherlands;
eDivision of Immunochemistry, Research Center Borstel, D-23845 Borstel, Germany;fDepartment of Microbiology and Immunology, Albert Einstein College
of Medicine, Bronx, NY 10461;gBiology of Human Dendritic Cells, Institut National de la Santé et de la Recherche Médicale, Unité Mixte de Recherche S725,
F-67065 Strasbourg, France;hUniversité de Strasbourg, F-67000 Strasbourg, France;iEtablissement Français du Sang-Alsace, F-67065 Strasbourg, France; and jSingapore Immunology Network, Agency for Science Technology and Research, Biopolis 138648, Singapore
Edited by Peter Cresswell, Yale University School of Medicine, New Haven, CT, and approved September 23, 2011 (received for review June 24, 2011)
The mechanisms permitting nonpolymorphic CD1 molecules to present lipid antigens that differ considerably in polar head and aliphatic tails remain elusive. It is also unclear why hydrophobic motifs in the aliphatic tails of some antigens, which presumably embed inside CD1 pockets, contribute to determinants for T-cell recognition. The 1.9-Å crystal structure of an active complex of CD1b and a mycobacterial diacylsulfoglycolipid presented here provides some clues. Upon antigen binding, endogenous spacers of CD1b, which consist of a mixture of diradylglycerols, moved considerably within the lipid-binding groove. Spacer displacement was accompa-nied by F’ pocket closure and an extensive rearrangement of resi-dues exposed to T-cell receptors. Such structural reorganization resulted in reduction of the A’ pocket capacity and led to incomplete embedding of the methyl-ramified portion of the phthioceranoyl chain of the antigen, explaining why such hydrophobic motifs are critical for T-cell receptor recognition. Mutagenesis experiments sup-ported the functional importance of the observed structural alter-ations for T-cell stimulation. Overall, our data delineate a complex molecular mechanism combining spacer repositioning and ligand-induced conformational changes that, together with pocket intri-cacy, endows CD1b with the required molecular plasticity to present a broad range of structurally diverse antigens.
three-dimensional structure
|
groove shrinking|
diacylglycerol endogenous ligand|
T lymphocyte activation|
CD1b mutant transfectantT
lymphocytes have developed the capacity to recognize as antigens a large variety of molecules including peptides, (glyco)lipids, and phosphorylated metabolites (1). Specific rec-ognition of peptides or lipids by T-cell receptors (TCR) occurs when these molecules form antigenic complexes with dedicated antigen-presenting molecules belonging to MHC or CD1 fami-lies, respectively. Diversity has forced the immune system to develop appropriate strategies to present antigens in immuno-genic form. Polymorphic MHC molecules cope with the peptide repertoire by constraining the ligand conformational space (2). Less clear is how the immune system adapts to the large glyco-lipid antigenic range and forms antigenic complexes using the functionally nonpolymorphic CD1 molecules.Human antigen-presenting cells (APC) display the CD1a, CD1b, CD1c, and CD1d proteins on their plasma membranes (1, 3). CD1 ectodomains consist of a heavy chain, which folds into three extracellular domains (α1–α3) noncovalently associated with β2-microglobulin (4). Antigen-binding grooves nestle bet-ween the α1 and α2 domains and are mostly lined by hydro-phobic residues. This allows the antigenic lipids to be anchored
via their hydrophobic chains, so that polar motifs protrude to-ward the aqueous milieu. Consequently, polar heads but not hydrophobic tails are assumed to establish stimulatory contacts with TCRs. Nevertheless, modifications in the lipid chains may also indirectly impact on TCR recognition (5).
The number, shape, and connectivity of pockets vary among CD1 molecules. CD1b has the most voluminous and intricate groove, being composed of A′, C′, and F′ pockets and a T′ tunnel that interconnects the deep ends of A′ and F′ pockets (6). In agreement with groove structural complexity, human CD1b presents the greatest diversity of antigenic structures among CD1 proteins, including mycobacterial lipoarabinomannans and phosphatidylinositol mannosides (7–9), diacylsulfoglycolipids (Ac2SGL) (10), mycolic acids (MA) (11), glucose- and glycerol-monomycolates (GMM and GroMM, respectively) (12, 13), and self-lipids such as GM1 gangliosides (14) and sulfatides (15). The polar heads of these antigens vary in size from the small car-boxylic group of MA to the pentasaccharide of GM1 or poten-tially larger structures in lipoarabinomannans. Hydrophobic tails, which decisively govern CD1-restricted presentation of some antigens (16, 17), also greatly differ in length and structural complexity. For example, up to C80 long tails, which are not trimmed before presentation (18), compose MA and GMM, whereas short 18:1/16:0 tails are found in GM1.
Mycobacterium tuberculosis (Mtb) Ac2SGL lipids are known to stimulate specific T cells from Mtb-infected donors (10) and therefore are good candidate for novel lipid-based vaccines. Herein, we investigated how CD1b generates T-cell–stimulatory complexes with a synthetic sulfoglycolipid analog of Ac2SGL. Our study clarifies how CD1b copes with antigens of variable tail length and complexity and why in some cases T cells are strongly sensitive to the structure of antigen hydrophobic tails. Thesefindings are relevant for the development of new-generation subunit vaccines.
Author contributions: L.F.G.-A. and G.D.L. designed research; L.F.G.-A., A.C., C.V., B.L., E.H., T.B., S.J., L. Mori, and L. Mourey performed research; J.G., J.S.I., S.S., J.P., M.G., S.A.P., H.d.l.S., L. Mori, G.P., and G.D.L. contributed new reagents/analytic tools; L.F.G.-A., A.C., C.V., B.L., L. Maveyraud, A.J.R.H., L. Mori, G.P., L. Mourey, and G.D.L. analyzed data; and L.F.G.-A. and G.D.L. wrote the paper.
The authors declare no conflict of interest. This article is a PNAS Direct Submission.
Data deposition: The atomic coordinates and structure factors reported in this paper have been deposited in the Protein Data Bank,http://www.rcsb.org(PDB ID3T8X). 1To whom correspondence may be addressed. E-mail: alles@ipbs.fr, Lionel.Mourey@ipbs.fr,
or Gennaro.DeLibero@unibas.ch.
This article contains supporting information online atwww.pnas.org/lookup/suppl/doi:10. 1073/pnas.1110118108/-/DCSupplemental.
www.pnas.org/cgi/doi/10.1073/pnas.1110118108 PNAS Early Edition | 1 of 6
IMM
Results
Stimulation of Specific T Cells by shCD1b Loaded in Vitro with Ac2SGL
or SGL12.In the present study we investigated the structural and functional characteristics of native recombinant soluble human CD1b (shCD1b, expressed from mammalian cells) in complex with the Ac2SGL antigen or the synthetic analog SGL12 (Fig.
S1A). Complex formation was confirmed by isoelectric focusing (IEF) (Fig. S1Band ref. 17) and found to be optimal at pH 4.0 (Fig. S1C), in agreement with previous findings proving that presentation requires CD1b and Ac2SGL to encounter in acidic compartments of living APC (10). Importantly, plate-bound shCD1b–SGL12 elicited strong cytokine release from Ac2 SGL-specific T cells (Fig. S1D). These experiments also confirmed the antigen specificity, the CD1b restriction of the T-cell response, and ruled out potential effects of the CD1b-expression system (Fig. S1D–F).
Stimulatory shCD1b–SGL12 Complex Contains an Endogenous Spacer.
Immunogenic shCD1b–antigen complexes were characterized by native mass spectrometry (n-MS) (19), an approach that per-mitted identification of phosphatidylcholine (PC) and a spacer molecule (UL) as major endogenous ligands associated to shCD1b (20). We focused on complexes with SGL12, because naturally occurring Ac2SGL is molecularly heterogeneous in fatty acids linked at positions 2 and 3 of the sulfotrehalose (Fig. S1A).
To further facilitate the interpretation of MS data, shCD1b– SGL12 was enriched by chromatofocusing.
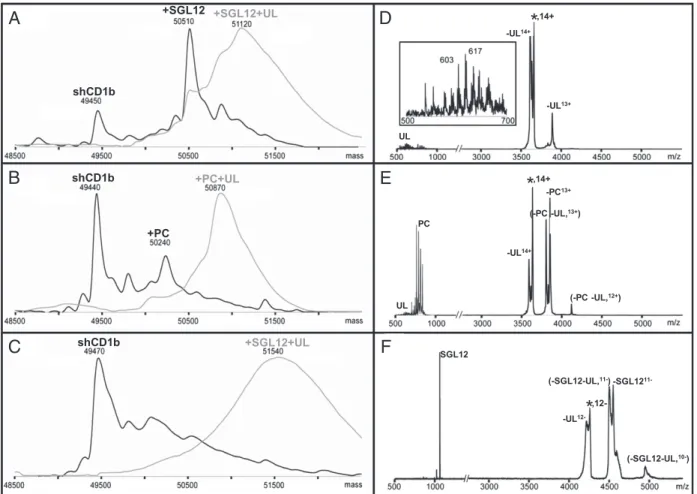
In positive-ion mode electrospray ionization (ESI) n-MS, the mass of the major species observed for fully glycosylated shCD1b–SGL12 (Fig. 1A, black line) supported the association of SGL12 (1,064 Da) with ligand-free shCD1b (major species with unloaded shCD1b; Fig. 1B, black line). The shCD1b– SGL12 species nearly disappeared when the desolvation energy was reduced, and a peak that suggested simultaneous UL pres-ence emerged (Fig. 1A, gray line). The prespres-ence of shCD1b– SGL12–UL in solution was supported by the negative-ion mode ESI data. Thus, whereas ligand-free shCD1b was detected as major species (Fig. 1C, black line), a broad peak was again ob-served at lower desolvation energy (Fig. 1C, gray line). The higher than expected weight of this species is likely due to un-specific binding of water and buffer molecules onto the gas phase ions at low energies (21).
Tandem MS-MS studies helped to corroborate the identity of the shCD1b–SGL12–UL species. Subjecting the presumed shCD1b–SGL12–UL14+ pseudomolecular ions to collision-in-duced dissociation led to the precursor ion (indicated by an as-terisk in Fig. 1D) and to two peaks indicative of dissociation of 600- to 640-Da ligands, which were directly detected in the low m/z region (Fig. 1D, Inset). In these experiments, dissociation of the anionic SGL12 was likely prevented by the tight interaction
shCD1b +SGL12 +SGL12+UL shCD1b +PC +PC+UL shCD1b +SGL12+UL
F
E
A
C
B
-UL14+ ,14+ -UL13+ UL ,14+ -UL14+ -PC13+ (-PC -UL,13+) (-PC -UL,12+) UL PC SGL12 (-SGL12-UL,10-) -SGL12 11-(-SGL12-UL,11-) ,12--UL12-*
*
*
D
Fig. 1. Presence of combined SGL12 and endogenous spacer in stimulatory complexes. Neutral mass spectra obtained after averaging over all charged states the positive- (A and B) and negative-ion mode (C) ESI-MS native data. Spectra are from fully glycosylated shCD1b after incubation with SGL12 (A and C) or before addition of any lipid (B). Spectra recorded using harsh or low desolvation energies are drawn with black or gray lines, respectively. (D–F) Tandem MS-MS data recorded after selection of 14+ (D and E) or 12- (F) precursor ions corresponding to the most abundant species detected at low desolvation energies in A and B or C, respectively. Ligand dissociation from precursor ions (indicated with an asterisk) lead to appearance of additional protein peaks in the high-mass range. In addition, these ligands could be directly detected in the low-high-mass range, provided that the ligand charge is compatible with the ion mode detection. The 500- to 1,000-Da mass region of D and E is 20-fold enlarged on the y axis and 200-fold enlarged for Inset in D. The faint PC signals observed in D are attributed to<5% contaminant shCD1b–PC–UL.
with the positively charged protein surface. Definitive proof for the simultaneous presence of SGL12 was attained when the shCD1b–SGL12–UL12−ions were subjected to tandem MS-MS. The precursor ion decomposed by loss of approximately 1,070 Da and a negative charge (-SGL12; Fig. 1F). Additional signals arose from neutral loss ofca. 550 Da (-UL) or a simultaneous loss of approximately 1,600 Da (-SGL12 -UL). Further sup-porting the presence of SGL12, its molecular ion was observed in the lowm/z region of the spectrum, whereas no signal attribut-able to UL was detected.
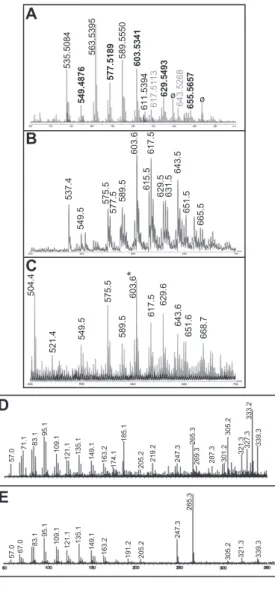
Identification of the Spacer Lipid.Weak signal intensities and the difficulties to fragment UL species dissociating from shCD1b impeded their characterization by n-MS. We then attempted the characterization of protein extracts by Fourier transform ion cyclotron resonance (FT-ICR) MS, a technique that could per-mit direct attribution of molecular formula from mass values. UL species could be recovered in petroleum ether (PE) after com-plete digestion of shCD1b with proteinase K, whereas PC was mostly found in subsequent extractions with chloroform. UL signals were detected in positive-ion mode ESI FT-ICR MS (Fig. S2A), atm/z values matching well those observed for species that dissociate from shCD1b in n-MS experiments (Fig. 1D andFig. S2B). Relative intensities varied notably between the two spec-tra. This was attributed to instrumentation effects (see below), because data obtained by n-MS on the PE extract resembled closely the spectra recorded from shCD1b (compareFig. S2B andC).
Elemental composition analysis permitted grouping of UL species detected by FT-ICR MS as belonging to three families. First-group masses invariantly furnished as best hit C35–43H67– 73O3molecular formula (Table S1, in plain black letters). For the second family, masses matched within the instrument accuracy (<3 ppm) to C35–43H65–75O4formula (Table S1, bold black let-ters). Some of these masses also fitted to CxHyO4Na+ or CxHyO3Li+ adducts. Conversely, hits with four or six nitrogen atoms (e.g., C38H68N4Na form/z 603.5341 species) were ruled out because unprecedented in the literature and in public lipid databases. Finally, two peaks were assigned to C37–39H70–72O5Na (Table S1 in gray), suggesting diacylglycerol sodium adducts (diAcGro).
With the exception of a few CxHyO3Li+ hits, all species in
Table S1furnished formula with odd carbon atom number. We
interpreted this as indicative of the presence of glycerol-based moieties (C3). Extracted UL species continued to be reluctant to fragmentation in tandem MS experiments. Exploitable data could only be obtained for the species atm/z 603.5 (Fig. S2D), which furnished almost identical spectra to those obtained after selection of them/z 603.5 signal present in commercial triolein, which arises from elimination of a single oleic acid (Fig. S2E).
Major UL species migrated on silica TLC plates comparably to synthetic diradylglycerols and were more retained than wax esters (i.e., stearyl-stearate) (Fig. S2F). The retention factor (Rf) of the most abundant species revealed with a CuSO4universal reagent was compatible with alkylacylglycerols (AkAcGro) and diAcGro. Although FT-ICR MS species intensities suggested that diAcGro (CxHyO5Na+ adducts) could be less abundant, experiments with synthetic AkAcGro and diAcGro indicated that [M+H-H2O]+dehydration peaks could become prominent under FT-ICR MS conditions but not in n-MS experiments. Accordingly, CxHyO3and CxHyO4species ofFig. S2Acould arise from CxHy+2O4(AkAcGro) and CxHy+2O5(diAcGro) species, as proposed in Table S1. To clarify this point, a 1H NMR spectrum was recorded overnight on a PE-extracted UL sample and compared with a control sample (Fig. S2G,Top vs. Middle). Signals in the 2.2- to 5.2-ppm interval supported that UL mostly consisted of a mixture of 1,2- and 1,3-regioisomers of AkAcGro and diAcGro. Indeed, the UL spectrum closely resembled the 1H-NMR data recorded for a mixture of synthetic AkAcGro and diAcGro. Of note, such diradylglycerol structures are fully
compatible with the linear electron densities attributed to UL in high-resolution structures of shCD1b (ref. 20 and below).
Determination of the Structure of the CD1b–SGL12–Spacer Complex.
MS experiments identified shCD1b–SGL12–UL with 1:1:1 stoi-chiometry as the T-cell stimulatory complex. To clarify how diacylsulfoglycolipid presentation to T cells is compatible with the presence of UL, a strongly stimulatory sample containing fully glycosylated shCD1b loaded to approximately 75% occu-pancy with SGL12 was crystallized, and the structure was solved at a resolution of 1.90 Å (Table S2). Two molecules (copy A and B) were found per crystallographic asymmetric unit. All main structural features were similar for both molecules (rmsd of 0.40 Å on backbone atoms) and were common to published CD1b structures (6, 20, 22). The C′ portal was closed in both copies.
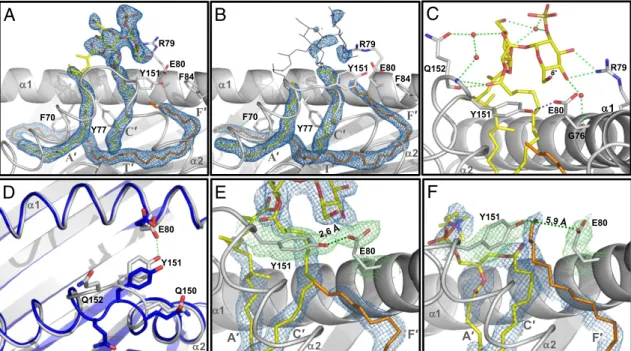
SGL12 was unequivocally identified in copy A (Fig. 2A). Electron density consistent with the sulfotrehalose polar head and disconnected stretches of the lipid tails was present in this copy from the earliest electron density maps. Conversely, weak electron density was found at the same relative location in the second copy (Fig. 2B), suggesting low SGL12 pocket occupancy. For that reason, the polar head for this second copy was omitted from the final structure. Extra electron density indicative of spacers presence was also foundfilling the T′ channel and the F′ pocket in both copies (Fig. 2A). The species and length hetero-geneity of spacers and the impossibility of predicting its insertion orientation within the groove led us to build into such electron density a C40-long carbon chain representative for the average length of diradylGro species.
The electron density of the SGL12 sulfotrehalose head in copy A connected during refinement to the electron density tube present in the C′ pocket but not with those extending downward to the A′ or F′ pockets. Nonetheless, such lack of connectivity was not a source of structural ambiguity concerning the lipid insertion mode, because the structural constraints imposed by the well-defined sulfotrehalose head dictated an unequivocal arrangement with the palmitic acid in the C′ pocket and the phthioceranoyl-like tail in the A′ pocket. The gap of electron density between the A′ entrance and the polar head corre-sponded to the tetramethyl-branched portion of the fatty acid tail that esterifies position 3 of SGL12 (Fig. S1A). This hydro-phobic patch is located in an unfavorable water-exposed envi-ronment that must prevent the establishment of a privileged conformation. In addition, its emplacement at the entrance of the A′ pocket must fluctuate depending on the length hetero-geneity of accompanying spacer molecules. These two factors might explain the poor definition in the electron density map for this patch.
Polar Head Exposure and Positioning Above the Groove.Hydrogen bonds between the guanidinium group of Arg79 and the 3′- and 4’-OH groups of the sulfated glucose stabilized in copy A the SGL12 polar head in a conformation that may favor the in-teraction of the sulfate with the TCR (Fig. 2C), in agreement with its essential role in T-cell activation (10). Arg79 is conserved in CD1b and CD1d of other species and plays a key ligand-binding role in CD1d structures (23–25). However, unlike CD1d, which often holds lipid polar heads by establishing hydrogen bond interactions with several residues (23–28), no further direct polar head-anchoring residues were found in the SGL12-loaded CD1b structure. The interaction between the SGL12 sulfo-trehalose and Arg79 was solely reinforced by indirect hydrogen bonds, mediated by water molecules, with Gly76 and Gln152.
Polar heads are usually weakly defined in 3D structures of CD1b–lipid complexes (6, 20, 22). In relation to this, the SGL12 sulfotrehalose isca. 3 and 10 Å more elevated above the pocket main portal than, for instance, the galactosyl rings ofαGalCer and sulfatides bound to CD1d (27) and CD1a (29), respectively. Taken together, these data indicate that CD1b weakly interacts with
Garcia-Alles et al. PNAS Early Edition | 3 of 6
IMM
polar groups of anchored ligands, which might be required to fa-cilitate the presentation of antigens with a range of polar heads.
Antigen Binding Induces Conformational Changes in CD1b. Re-markably, the presence of SGL12 was accompanied by an im-portant shift toward the α1-helix of backbone and side-chain atoms of residues 149–152 that connect two helical segments of the α2-domain (Fig. 2D). The rmsd of backbone atoms from these four residues in copy A compared with their position in natively folded shCD1b was 2.4 Å (20). In contrast, the confor-mation of these residues in copy B, in shCD1b and in other published CD1b structures (6, 22), was essentially identical (rmsd below 0.6 Å). The displacement in the SGL12-loaded copy resulted in the establishment of a hydrogen bond between the Glu80 side-chain carboxylate and the Tyr151 hydroxyl group (Fig. 2 D and E). The interatomic distance between the two closest oxygen atoms from each residue decreased from 5.9 Å in natively folded shCD1b (Fig. 2F) to 2.6 Å in the SGL12-loaded copy. Accompanying these movements, the side-chain of Gln152 oriented toward the TCR-contacting interface, compared with other published structures (6, 20, 22), suggesting that this residue might play a role in modulating the interaction with TCR.
The conformational change of residues 149–152 had impor-tant structural consequences. It occluded the F′ pocket entrance, preventing spacer egress toward the TCR contacting surface. Compared with unloaded shCD1b, spacers repositioned by the length of at least 6 methylene units toward the A′ pocket in copy A, clearing above the F′ pocket the necessary space to accom-modate the SGL12 sulfated glucose (compare Fig. 2E and F). The groove volume decreased from approximately 2,400 Å3in natively folded shCD1b to<2,200 Å3in the presence of SGL12. Overall, this conformational rearrangement appears
incompa-tible with full embedding of the SGL12 phthioceranoyl-like tail inside the A′ pocket and thus forces its methyl-branched motif to remain exposed above the CD1b surface.
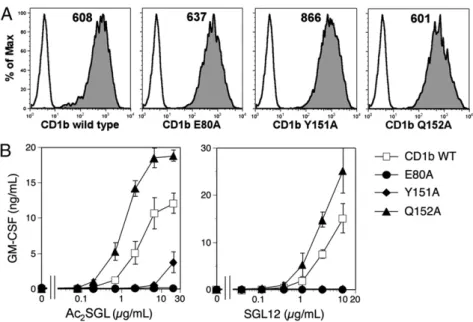
Influence of CD1b Conformational Dhanges on T-Cell Stimulation.To investigate whether such groove structural reorganization is im-portant for Ac2SGL/SGL12 presentation to T cells, we evaluated T-cell responses using CD1b with Ala point mutations at resi-dues Glu80 or Tyr151 (implicated in F′ pocket closure) or at Gln152 (residue thatflipped toward the TCR in copy A). Stably transfected C1R cells expressing matched surface levels of wild-type and mutant CD1b were selected (Fig. 3A), and their capacities to activate the Ac2SGL-specific T cells were evaluated (Fig. 3B).
Replacement of Glu80 or Tyr151 with Ala fully abrogated T-cell responses to Ac2SGL and SGL12, supporting the impor-tance of the conformational changes observed in the CD1b– SGL12–UL structure for productive Ac2SGL presentation. Dif-ferently from E80A and Y151A, the Q152A mutation resulted in increased T-cell responses to Ac2SGL and SGL12 at all antigen doses. Enhanced cytokine secretion at saturating Ac2SGL doses argued against differences in the number of antigenic complexes displayed by Q152A CD1b at the APC surface, compared with wild-type CD1b, and suggested that complexes with stronger stimulatory capacity were formed. These results collectively in-dicate that the conformational changes of CD1b residues 149– 152 control T-cell responses to Ac2SGL antigens.
Discussion
CD1b presents a remarkable variety of (glyco)lipids to T cells (1, 3). Previous structural studies described the intricacy of the
G76 1 R79 Q152 2 E80 Y151 6'
B
F′ T′ A′ C′ F70 Y77 F84 Y151 E80 1 2 R79A
F′ T′ A′ C′ F70 Y77 F84 Y151 E80 1 2 R79C
Y151 1 2 E80 Q152 Q150D
F′ A′ C′ Y151 E80 1 2F
F′ A′ C′ Y151 E80 1 2E
Fig. 2. Ligand binding and pocket alterations in shCD1b–SGL12–UL. (A) Electron density for the SGL12 and spacers in copy A (final 2Fo-Fcmap contoured at
1.0σ, blue mesh). Modeled lipids are drawn as sticks. SGL12 is colored by atom type (carbon yellow, oxygen red, sulfur orange), spacer in orange. The α2 domain helices are represented as thin ribbons. Gray letters indicate the groove channels occupied by nearby portions of electron density. (B) Electron density in the lipid-binding groove for copy B. Only ligand portions shown as yellow or orange sticks were modeled. For comparison, a full SGL12 molecule in the conformation observed in copy A (black lines) is superimposed onto the groove of copy B. (C) Hydrogen bonds established between SGL12 and CD1b. Hy-drogen bonds between the lipid and Arg79 or Gln152, as well as indirect interactions mediated by water molecules (red spheres) with Gln152 and Gly76, are depicted as green dashed lines. (D) Comparison of the conformation adopted by residues from the α1-α2 domains of shCD1b–SGL12–UL (copy A, in gray) with those from shCD1b–PC–UL (20) (Protein Data Bank entry 2H26, in blue), after superimposition of backbone atoms of residues 6–180 from each structure. For clarity, lipid ligands are omitted from this top-view representation. (E) A Tyr151-Glu80 hydrogen bond prevents spacer protrusion in the SGL12-loaded structure. The 2Fo-Fcmap (1.0σ contour) is represented as a green mesh for side-chain atoms of Tyr151 and Glu80, in blue for ligand atoms. The interatomic
distance between the two closest oxygens from Tyr151 and Glu80 is indicated. (F) Similar representation to that of E prepared using data from the crystal structure of shCD1b–PC–UL. PC atoms are colored exactly as SGL12 atoms in B, and with phosphorus in orange.
CD1b groove (6, 20, 22), providing initial hints as to the mech-anism of CD1b adaptation to lipid antigen. A detailed compre-hension could not be attained because crystallized complexes were refolded in the presence of lipids and detergent, and the latter coincidentally occupied major portions of the T′ and F′ pockets (6), and also because the T-cell–stimulatory potential of the in vitro-refolded complexes was not assessed.
The data presented herein were obtained from a CD1b–anti-gen complex prepared from natively folded protein and having T-cell-stimulatory activity. A major finding was that CD1b presents Ac2SGL antigens to T cells with the participation of endogenous spacers. Our structural investigations indicated that spacers are 1,2- and 1,3-diacyl- and alkylacyl-glycerols, which are abundant components of cellular lipids (30). This ligand seemed to play an unpredicted functional role. In the presence of SGL12 and constrained by F′ pocket closing, spacers repositioned within the F′-T′-A′ superchannel toward the A′ pocket, compared with its position in unloaded shCD1b. Such movement not only allowed the accommodation of the bulky antigen polar head but also reduced the capacity of the A′ pocket for the SGL12 tail. This can be stated regardless of the length heterogeneity of spacers (C36–44or C37–45for 1,2- or 1,3-diradylGro, respectively), because (i) no mass differences were noted between spacer species dissociating from shCD1b–PC–UL and shCD1b–SGL12– UL complexes, and (ii) because F′ closing unambiguously blocks spacer egress in the SGL12-loaded structure. Considering that the A′-T′-F′ superchannel has the potential to accommodate approximately C56–60-long tails (6) and that the mean spacer length is C40, the repositioning of the latter is assumed to cause exposition of the methyl-ramified portion of the C24-long tail of SGL12. Such possibility would explain why methyl ramifications in Ac2SGL and SGL are essential for antigenicity (17).
Binding of SGL12 to shCD1b was accompanied by confor-mational changes of residues 149–152 that brought closer the α1 andα2 helices and shut the F′ pocket entrance. Supporting the functional importance of these alterations, both E80A and Y151A CD1b mutants failed to elicit T-cell responses to Ac2SGL/SGL12. Although still compatible with two residues that coincidentally contacted the Ac2SGL-specific TCR, our combined functional and structural data rather suggest that Glu80 and Tyr151 are important because they sustain F′ closure and spacer displacement, alterations that would be mandatory for presentation of diacylsulfoglycolipids. Interestingly, F′ clo-sure implicating the same two residues has been observed in the crystal structure of bovine CD1b3 (31). Such mechanism of groove tailoring to ligand structure thus differed from a
pro-posed mechanism involving an alternate side-chain conformation of Phe84 (6).
Among residues 149–152, the Gln152 residue underwent a remarkable revolution of approximately 90° in the presence of SGL12 and adopted a position pointing toward the TCR. In-deed, residues 149–152 are at the most protruding region above the CD1b lipid-binding cleft. Any rearrangement of their con-formation is expected to impact recognition by T cells. This was proven by the considerably stronger T-cell responses elicited with the CD1b Q152A mutant compared with wild-type CD1b. Fur-ther experimentation will be required to explore the role of Gln152 in restraining T-cell responses. Interestingly, a similar rearrangement of α2 interhelical residues of HLA-A2 was also noted in the crystal structure of a ternary complex HLA-A2/ peptide/TCR (32). The conformation of residues Ala150-Val152 was found to switch in the face of the same TCR depending on the identity of the antigenic peptide, highlighting a mechanism whereby the antigen tuned the dynamic properties of the MHC molecule, and ultimately of the TCR, and facilitated cross-re-activity. Similarly, the flexibility of that interhelical segment could be exploited in CD1b as a means to further expand the structural diversity of antigens presented to T cells.
An intriguing question is how the structural reorganization of the SGL12-occupied groove was triggered (20). F′ closure and spacer repositioning might be consequence of the PC/antigen exchange process. Concomitant with PC discharge, spacers are predicted to slide within the groove to stabilize emptied portions. The Tyr151 would then interact with Glu80, thus closing the F′ entrance, a mechanism that could serve to prevent insertion of lipid tails into the F′ pocket. Eventually, spacer displacement might be reinforced by strong hydrogen bonds between diradyl-Gro molecules and CD1b groove residues (Fig. S3). Short-tailed antigens would then bind to A′ and C′ pockets in combination with fully embedded spacers. The mentioned Glu80-Tyr151 and spacer-CD1b hydrogen bonds would contribute to retain exposed above the A’ pocket medium-sized tails like those from Ac2SGL. Conversely, these bonds would break and spacers would be ex-pelled for presentation ofMtb MA, GMM, or GroMM.
In conclusion, this study revealed several unique structural features that confer CD1b with unusual pocket plasticity. These include an intricate pocket design, the presence of a reposition-able spacer, the rearrangement of key residues affecting TCR recognition, and the ability to switch from an open to closed state the main entrance toward the F′ pocket and the C′ portal. Al-together, these features endow CD1b with an extraordinary
Fig. 3. Mutation of amino acids that change con-formation upon antigen binding affects antigen pre-sentation. (A) CD1b surface levels on C1R cells expressing wild-type or mutant CD1b, stained with anti-CD1b (gray histograms) or isotype control (white histograms) antibodies. Numbers indicate mean fluo-rescence intensity. (B) Stimulation of the Z4B27 T-cell clone with Ac2SGL or SGL12 presented by C1R cells
expressing wild-type or mutant CD1b molecules. GM-CSF secretion is illustrated as mean of duplicates± SD. Results are representative of at least two independent experiments.
Garcia-Alles et al. PNAS Early Edition | 5 of 6
IMM
flexibility in adapting to foreign antigens, thus facilitating lipid antigen recognition and antimicrobial immune responses. Methods
Reagents, cell lines, the preparation of APC transfectants, T-cell activation assays, and other experimental details are described inSI Methods. Native Nano ESI Mass Spectrometry. Recombinant shCD1b loaded with SGL12 was purified by chromatofocusing on a MonoP column (GE Healthcare) using a pH gradient between 6.5 and 4.0. Enriched CD1b–SGL12 complex was re-covered as second eluting peak, concentrated, and buffer-exchanged against 10 mM Na acetate, pH 5.0. The last 18 residues belonging to the BirA extension tag were then removed by incubation of CD1b–SGL12 with LysC endoproteinase (Roche) (200:1 weight ratio) at 30 °C for 6 h, in 25 mM Tris/5 mM EDTA, pH 8.5. Details concerning the analysis by n-MS are given in
SI Methods.
Extraction of the Endogenous Spacer from shCD1b. Recombinant shCD1b (2 mg) was immunopurified as previously described (20), with modifications. After PBS, column wash was continued with deionized water (30 mL), and the protein was eluted with aqueous acetic acid (25 mL, 0.2 M, pH 2.6) and collected in glass tubes. After pH neutralization with ammonium hydroxide (30%), pooled fractions were concentrated under vacuum to 1 to 2 mL and treated overnight at 30 °C with proteinase K (20 U, from Tritirachium album; Sigma). Lipids were extracted by three successive steps with PE (HPLC grade, 2 mL per step). Upper organic phases were pooled and dried. The aqueous phase wasflowed with N2to remove remaining PE, and extraction was
pursued with 2 × 2 mL of CHCl3(HPLC grade). The bottom phases were
pooled and dried.
Analysis by FT-ICR MS. Protein ligands extracted with PE or CHCl3were
an-alyzed by ESI FT-ICR MS, using a hybrid APEX Qe Instrument (Bruker Dal-tonics) equipped with an actively shielded 7-T magnet and a dual ESI source. Mass spectra were acquired in the positive-ion mode using standard ex-perimental sequences as provided by the manufacturer. Samples were dis-solved in a 50:50:0.03 (vol/vol/vol) mixture of 2-propanol/water/AA (30 mM) at pH 4.5 and sprayed at aflow rate of 2 μL/min. Capillary entrance voltage was set to 3.8 kV and drying gas temperature to 200 °C. Mass scale
cali-bration was performed externally and controlled internally with compounds of known structure assuring a mass accuracy below 3 ppm.
Thin-Layer Chromatography. Silica gel TLC plates (SIL G/UV2540.20 mm, 10 cm
high; Macherey-Nagel) were prewashed by running successively to 9 cmfirst with CHCl3/MeOH (9:1, vol/vol) and second with PE/Et2O (15:5, vol/vol). After
the plate dried, samples (1–4 μg) were loaded and developed with PE/Et2O/
acetic acid (15:5:0.2, vol/vol/vol) to 8 cm. For visualization, the plates were dipped into 10% cupric sulfate in MeOH containing 4% phosphoric acid and 4% sulfuric acid, before being charred at 180 °C for 10 min.
Crystallization of the Glycosylated shCD1b–SGL12–UL Complex. Mouse-expressed shCD1b was loaded with SGL12 (SI Methods). After pH neutrali-zation, the protein was purified by anion-exchange chromatography (Bio-Scale Q2 column; Bio-Rad) using a linear gradient from buffer A (10 mM Bis-Tris/1 mM EDTA/pH 6.5) to buffer B (500 mM NaCl in buffer A). The best crystals were grown after 1–3 d at 20 °C, using the hanging-drop vapor-diffusion method, from drops containing 1μL shCD1b–SGL12 (5 mg/mL in 10 mM Bis-Tris/30–50 mM NaCl/1 mM EDTA/pH 6.5) and 1.0 μL precipitant [1.9 M (NH4)2SO4, 0.2 M NH4Ac, pH 6.6)]. Experimental details concerning X-ray
data collection, structure determination, analysis and presentation are given inSI Methods.
ACKNOWLEDGMENTS. We thank Dr. Dominique Lafont [Institut de Chimie et Biochimie Moléculaires et Supramoléculaires, Centre National de la Recherche Scientifique (CNRS)] and Prof. Gudmundur G. Haraldsson (Univer-sity of Iceland) for kindly providing synthetic lipids; Professors Raphael A. Zoeller (Boston University School of Medicine), Howard Goldfine (University of Pennsylvania), David A. Ford (St. Louis University), Robert C. Murphy (Uni-versity of Colorado), and Joseph A. Laszlo (National Center for Agricultural Utilization Research) for enriching discussions; the European Synchrotron Radiation Facility staff (Grenoble, France) for excellent data collection facil-ities; Stefano Vavassori and Paula Cullen for reading the manuscript; and Olivier Saurel (IPBS, CNRS) for acquisition of1H NMR data (spectrometers
financed by the CNRS, Université Paul Sabatier, Région Midi-Pyrénées, and European Regional Development Fund). This work benefits from constant support of the CNRS, the European Union (FP6 TB-VAC program), the Agence Nationale de la Recherche Emergence (ANR-07-EMPB-029-01, France), and of the Swiss National Foundation (Grant 3100AO-122464/1). S. A.P. receives support from National Institutes of Health/National Institute of Allergy and Infectious Diseases Grant AI45889.
1. De Libero G, Mori L (2005) Recognition of lipid antigens by T cells. Nat Rev Immunol 5:485–496.
2. McFarland BJ, Beeson C (2002) Binding interactions between peptides and proteins of the class II major histocompatibility complex. Med Res Rev 22:168–203.
3. Barral DC, Brenner MB (2007) CD1 antigen presentation: How it works. Nat Rev Immunol 7:929–941.
4. Silk JD, Salio M, Brown J, Jones EY, Cerundolo V (2008) Structural and functional aspects of lipid binding by CD1 molecules. Annu Rev Cell Dev Biol 24:369–395. 5. McCarthy C, et al. (2007) The length of lipids bound to human CD1d molecules
modulates the affinity of NKT cell TCR and the threshold of NKT cell activation. J Exp Med 204:1131–1144.
6. Gadola SD, et al. (2002) Structure of human CD1b with bound ligands at 2.3 A, a maze for alkyl chains. Nat Immunol 3:721–726.
7. Sieling PA, et al. (1995) CD1-restricted T cell recognition of microbial lipoglycan an-tigens. Science 269:227–230.
8. Gilleron M, et al. (2001) Acylation state of the phosphatidylinositol mannosides from Mycobacterium bovis bacillus Calmette Guérin and ability to induce granuloma and recruit natural killer T cells. J Biol Chem 276:34896–34904.
9. de la Salle H, et al. (2005) Assistance of microbial glycolipid antigen processing by CD1e. Science 310:1321–1324.
10. Gilleron M, et al. (2004) Diacylated sulfoglycolipids are novel mycobacterial antigens stimulating CD1-restricted T cells during infection with Mycobacterium tuberculosis. J Exp Med 199:649–659.
11. Beckman EM, et al. (1994) Recognition of a lipid antigen by CD1-restricted alpha beta+ T cells. Nature 372:691–694.
12. Layre E, et al. (2009) Mycolic acids constitute a scaffold for mycobacterial lipid anti-gens stimulating CD1-restricted T cells. Chem Biol 16:82–92.
13. Moody DB, et al. (1997) Structural requirements for glycolipid antigen recognition by CD1b-restricted T cells. Science 278:283–286.
14. Shamshiev A, et al. (2000) The alphabeta T cell response to self-glycolipids shows a novel mechanism of CD1b loading and a requirement for complex oligosaccharides. Immunity 13:255–264.
15. Shamshiev A, et al. (2002) Presentation of the same glycolipid by different CD1 molecules. J Exp Med 195:1013–1021.
16. de Jong A, et al. (2007) CD1c presentation of synthetic glycolipid antigens with for-eign alkyl branching motifs. Chem Biol 14:1232–1242.
17. Guiard J, et al. (2009) Fatty acyl structures of mycobacterium tuberculosis sulfogly-colipid govern T cell response. J Immunol 182:7030–7037.
18. Cheng TY, et al. (2006) Role of lipid trimming and CD1 groove size in cellular antigen presentation. EMBO J 25:2989–2999.
19. Heck AJ (2008) Native mass spectrometry: A bridge between interactomics and structural biology. Nat Methods 5:927–933.
20. Garcia-Alles LF, et al. (2006) Endogenous phosphatidylcholine and a long spacer ligand stabilize the lipid-binding groove of CD1b. EMBO J 25:3684–3692. 21. Benesch JL, Ruotolo BT, Simmons DA, Robinson CV (2007) Protein complexes in the
gas phase: Technology for structural genomics and proteomics. Chem Rev 107: 3544–3567.
22. Batuwangala T, et al. (2004) The crystal structure of human CD1b with a bound bacterial glycolipid. J Immunol 172:2382–2388.
23. Zajonc DM, Ainge GD, Painter GF, Severn WB, Wilson IA (2006) Structural charac-terization of mycobacterial phosphatidylinositol mannoside binding to mouse CD1d. J Immunol 177:4577–4583.
24. Zajonc DM, et al. (2005) Structure and function of a potent agonist for the semi-in-variant natural killer T cell receptor. Nat Immunol 6:810–818.
25. Zajonc DM, et al. (2005) Structural basis for CD1d presentation of a sulfatide derived from myelin and its implications for autoimmunity. J Exp Med 202:1517–1526. 26. Zajonc DM, Savage PB, Bendelac A, Wilson IA, Teyton L (2008) Crystal structures of
mouse CD1d-iGb3 complex and its cognate Valpha14 T cell receptor suggest a model for dual recognition of foreign and self glycolipids. J Mol Biol 377:1104–1116. 27. Koch M, et al. (2005) The crystal structure of human CD1d with and without
alpha-galactosylceramide. Nat Immunol 6:819–826.
28. Giabbai B, et al. (2005) Crystal structure of mouse CD1d bound to the self ligand phosphatidylcholine: a molecular basis for NKT cell activation. J Immunol 175: 977–984.
29. Zajonc DM, Elsliger MA, Teyton L, Wilson IA (2003) Crystal structure of CD1a in complex with a sulfatide self antigen at a resolution of 2.15 A. Nat Immunol 4: 808–815.
30. Jones DR, Pettitt TR, Sanjuán MA, Mérida I, Wakelam MJ (1999) Interleukin-2 causes an increase in saturated/monounsaturated phosphatidic acid derived from 1,2-diac-ylglycerol and 1-O-alkyl-2-ac1,2-diac-ylglycerol. J Biol Chem 274:16846–16852.
31. Girardi E, et al. (2010) Crystal structure of bovine CD1b3 with endogenously bound ligands. J Immunol 185:376–386.
32. Borbulevych OY, et al. (2009) T cell receptor cross-reactivity directed by antigen-dependent tuning of peptide-MHC molecularflexibility. Immunity 31:885–896.
Supporting Information
Garcia-Alles et al. 10.1073/pnas.1110118108
SI MethodsReagents and Cell Lines.Bovine brain sulfatides, gangliosides type II, 1,2-dipalmitoyl-sn-glycerol, 1,3-diolein, 1,2-di-O-hexadecyl-rac-glycerol, and stearyl stearate were purchased from Sigma, 1-O-hexadecyl-2-O-arachidonoyl-sn-glycerol from Enzo Life Sciences, 1,3-di-O-hexadecyl-rac-glycerol and 1-hexadecyl-3-O-stearoyl-rac-glycerol were respectively provided by Dr. Dominique Lafont (In-stitut de Chimie et Biochimie Moléculaires et Supramoléculaires, Centre National de la Recherche Scientifique, Villeurbanne, France) and Prof. Gudmundur G. Haraldsson (University of Iceland), and other lipids were from Avanti Polar Lipids.Mtb Ac2SGL was purified as previously reported (1). SGL12 was synthesized as previously re-ported (2).
Recombinant CD1b (shCD1b), expressed from either mouse J558 cells or S2Drosophila cells, and soluble CD1e were purified as previously described (3, 4). Recombinant soluble CD1d and CD1a were expressed from mouse cells as described for shCD1b.
Isoelectric-Focusing (IEF) Electrophoresis. The basic protocol to measure lipid loading onto CD1 molecules has been described (4). Briefly, N-glycosylated shCD1b (10–20 μM) and 100 μM lipid were shaken in glassware tubes buffered at pH 4.0, at 37 °C and 600 rpm. After 6 h, aliquots (2μL) were loaded onto the IEF 4–6.5 gel (Amersham Biosciences) and electrophoresed in a PhastGel system (Amersham Biosciences).
Native Nano Electrospray Ionization (ESI) Mass Spectrometry.
Recombinant shCD1b loaded with SGL12 was purified by chroma-tofocusing on a MonoP column (GE Healthcare) using a pH gradient between 6.5 and 4.0. Enriched CD1b–SGL12 complex was re-covered as second eluting peak, concentrated, and buffer-exchanged against 10 mM Na acetate, pH 5.0. The last 18 residues belonging to the BirA extension tag were then removed by incubation of CD1b–SGL12 with LysC endoproteinase (Roche) (200:1 weight ratio) at 30 °C for 6 h, in 25 mM Tris/5 mM EDTA, pH 8.5.
Before mass analysis, protein samples were buffer exchanged extensively into 50 mM aqueous ammonium acetate, pH 6.7, using 5-kDa Millipore centrifuge filters. Other details on instru-mentation and measurement conditions are described in ref. 4.
Structure Determination, Analysis, and Presentation.Crystals were briefly immersed into the crystallization solution supplemented with 20% glycerol before being transferred into a gaseous ni-trogenflux at 100 K. Diffracted intensities were collected from a single crystal at European Synchrotron Radiation Facility (Grenoble, France) on beamline ID23 EH2, tuned at 0.8726 Å, using a MarCCD detector. Diffraction images were processed using MOSFLM (5), scaled with SCALA (6), and further pro-cessed with the CCP4 programs package (7). Data processing statistics are summarized in Table S2.
The structure was solved by the molecular replacement method, with the program PHASER (8), using both polypeptidic chains from the crystal structure of native shCD1b [Protein Data Bank
entry 2H26 (4)]. A single unambiguous solution was identified with aZ-score of 64.2 for data between 35.0- and 3.0-Å resolution. This solution was refined using data between 20.0- and 1.9-Å resolution with REFMAC (9). TheFo-Fc electron density maps allowed modeling of portions of the GlcNAc(β1–2)Man(α1–6)[ GalNAc(β1–4)GlcNAc(β1–2)Man(α1–3)]Man(β1–4)GlcNAc(β1– 4)[Fuc(α1–6)]GlcNAc oligosaccharide onto Asn20 and Asn57 on each heavy chain. Two lipid molecules were included in the model for copy A and copy B, to account for electron density visible in the Fo-Fc map, at a contour level of 3.0σ. Final model includes 750 residues, 14 sugar moieties, four lipids [complete and partial SGL12, and two a spacer molecules (ULs)], four sulfates, one chloride and one acetate anions, three glycerol molecules, and 524 water molecules. Statistics for thefinal refined structure are given in Table S2. Ramachandran analysis shows 712 residues in pre-ferred regions (97.4%), 18 in allowed regions (2.46%), and one outlier (Asp33, chain C) (0.14%). Protein stereochemistry was validated using PROCHECK (10).
Molecular surface areas and volumes were calculated using the CASTp server (11). A solvent probe of 1.4 Å was used to map internal cavities and pockets of the proteins. Figure 3 was gen-erated with PyMOL (12).
Generation of APC Expressing CD1b Mutants.Three CD1b mutant molecules bearing a single amino acid substitution were gener-ated by site-directed mutagenesis of CD1B cDNA: E80, Y151, and Q152 were mutated into alanine. Nested PCR were per-formed to introduce the mutations usingCD1B cDNA as tem-plate,Advantage-HF 2 PCR kit (Clontech), and the primers 5′ SalICD1b-tatagtcgacatgctgctgctgcc-atttcaac; 3′BamHICD1b-agg-gatcctcatgggatattctgatatgacc; 5′CD1bE80A-cgagcagtacaagactttg-ccggtgatttc; 3′CD1bE80A-gtactgctcgagcgaatccaaagatgtagactc; 5′ CD1bY151A-acaagctcaaggt-atcatggaaactgtgag; 3′CD1bY151A-cttgagcttgtatgattagtgcacagaatttc; 5′CD1bQ152A-aatatgc-aggtat-catggaaactgtgagaa; and 3′CD1bQ152A-tacctgcatattgtatgattagtg-cacagaatttc. Mutant constructs were cloned in pCR2.1-TOPO (Invitrogen), sequenced, subcloned into BCMGShph, and used for transfection of C1R cells. Stable transfectants were selected and cell surface expression of CD1b analyzed byflow cytometry
using a CyAn ADP flow cytometer (DakoCytomation). Data
were analyzed using FlowJo software (Tree Star).
T-Cell Activation Assays.Transfectants with CD1b expression levels closely matching those of wild-type CD1b were used to activate Ac2SGL-specific and CD1b-restricted Z4B27 T cells (1). Briefly, APC (3× 10⁴per well) were preincubated for 2 h at 37 °C with different concentrations of Ac2SGL or synthetic SGL12 analog before addition of T cells (105per well in duplicate). Supernatants were harvested after 36 h, and GM-CSF release was measured by ELISA (R&D Systems). Data are expressed as mean ng/mL± SD. All transfectants were analyzed byflow cytometry within 24 h of each assay to confirm CD1b surface expression levels. Plate-bound activation assays were performed as described in ref. 2.
1. Gilleron M, et al. (2004) Diacylated sulfoglycolipids are novel mycobacterial antigens stimulating CD1-restricted T cells during infection with Mycobacterium tuberculosis. J Exp Med 199:649e659.
2. Guiard J, et al. (2009) Fatty acyl structures of Mycobacterium tuberculosis sulfoglycolipid govern T cell response. J Immunol 182:7030e7037.
3. de la Salle H, et al. (2005) Assistance of microbial glycolipid antigen processing by CD1e. Science 310:1321e1324.
4. Garcia-Alles LF, et al. (2006) Endogenous phosphatidylcholine and a long spacer ligand stabilize the lipid-binding groove of CD1b. EMBO J 25:3684e3692.
5. Leslie AGW (1987) Profile fitting. Proceedings of the Daresbury Study Weekend: Computational Aspects of Protein Crystal Data Analysis, eds Helliwell JR, Machin PA, Papiz MZ, pp 39e50.
6. Evans PR (1993) Data reduction. Proceedings of the CCP4 Study Weekend: Data Collection and Processing, pp 114e122.
7. Collaborative Computational Project Number 4 (1994) The CCP4 suite: Programs for protein crystallography. Acta Crystallogr D50: 760–763.
8. McCoy AJ, Grosse-Kunstleve RW, Storoni LC, Read RJ (2005) Likelihood-enhanced fast translation functions. Acta Crystallogr D Biol Crystallogr 61:458e464.
9. Murshudov GN, Vagin AA, Dodson EJ (1997) Refinement of macromolecular structures by the maximum-likelihood method. Acta Crystallogr D Biol Crystallogr 53: 240e255.
10. Laskowski RA, MacArthur MW, Moss DS, Thornton JM (1993) PROCHECK: A program to check the stereochemical quality of protein structures. J Appl Crystallogr 26:283e291.
11. Liang J, Edelsbrunner H, Woodward C (1998) Anatomy of protein pockets and cavities: Measurement of binding site geometry and implications for ligand design. Protein Sci 7:1884e1897.
12. DeLano WL (2002) The PyMOL molecular graphics system (DeLano Scientific, San Carlos, CA).
Fig. S1. Activation of specific T cells by CD1b–Ac2SGL and CD1b–SGL12 complexes. (A) Chemical structure of Mtb Ac2SGL and SGL12. Palmitic or stearic fatty
acids esterify the sulfotrehalose position 2 in Ac2SGL, only palmitic acid in the synthetic analog SGL12. The heterogeneous C20to C40hydroxyphthioceranoyl
appendage at position 3 is replaced by a tetra-methyl branchedα,β-unsaturated chain in SGL12. (B) Lipid binding to shCD1b monitored by IEF. (C) Efficient binding of Ac2SGL to CD1b requires pH 4.0. (D–F) Stimulation of Ac2SGL-specific T cells by immobilized CD1b–Ac2SGL and CD1b–SGL12 complexes. Various
shCD1 preparations were immobilized on plastic wells after incubation with or without indicated lipids. After addition of Z4B27 T cells, GM-CSF release was measured and expressed as mean of duplicates + SD. (D) Antigen specificity of stimulation of Z4B27 T cells with shCD1b. (E) Stimulation with Ac2SGL (Ag) is
CD1b-restricted. (F) Stimulation of Z4B27 T cells is independent of the CD1b-expression system. Purified shCD1b expressed from mouse cells, S2 Drosophila cells, or CHO cells were tested in the absence (-) or presence (Ag) of Ac2SGL. All data illustrated are representative of three independent experiments.
537. 4 549. 4876 563. 5395 577. 5189 589. 5550 603. 5341 617. 5113 629. 5493 643. 5268 655. 5657 ø 611. 5394 ø
B
C
A
D
E
57. 0 67.0 83. 1 95. 1 109. 1 121. 1 135. 1 149. 1 163. 2 174. 1 191. 2 269. 3 265. 3 247. 3 219. 2 305. 2 287. 3 301. 2 333. 2 327. 3 339. 3 321. 3 305. 2 339. 3 321. 3 265. 3 247. 3 205. 2 205. 2 149. 1 163. 2 185. 1 109. 1 121. 1 135. 1 83. 1 95.1 57. 0 71. 1 504. 4 521. 4 549. 5 668. 7 575. 5 589. 5 603. 6 * 617. 5 629.6 643. 6 651. 6 535. 5084 575. 5 549. 5 589. 5 577. 5 665. 5 603. 6 615. 5 629. 5 631. 5 643. 5 617. 5 651. 5G
F
1,3-d ir a d y lGr o Co n tr o lshCD
1b
St -s t 1 ,2-di ra dy lG ro 1,3-diAcGro 1-Ak-2-AcGro Front 1,2-diAcGro 1,2-diAkGro 1,3-diAkGro ppm 5.0 4.5 4.0 3.5 3.0 2.5Fig. S2. Characterization of the endogenous UL ligand of shCD1b. (A) Zoomed m/z 500–700 region of positive-ion mode ESI Fourier transform ion cyclotron resonance MS mass spectra recorded on a petroleum ether (PE) extract obtained from proteinase K-treated shCD1b (SI Methods). Peak labels are highlighted as in Table S1, according to molecular formula classification. The two peaks labeled with the ø symbol were not detected in a second independent experiment. (B) Legend continued on following page
For comparison, positive-ion mode ESI TOF-MS/MS data showing UL species dissociating from a glycosylated shCD1b 14+
-charged precursor ion. (C) The same PE extract of A was analyzed under similar experimental conditions by positive-ion mode ESI TOF-MS. (D) Fragmentation data recorded by TOF MS-MS after selection of the m/z 603.6 precursor species of C (labeled with an asterisk). Only the enlarged m/z 0–350 portion is presented, because no other signals were observed apart from those of precursor peaks. (E) For comparison, fragmentation data recorded after selection as precursor the m/z 603.5 species that ac-companies commercial triolein (trioleylglycerol). Of note, the m/z 603 species selected for D and E were similarly reluctant to fragment under our experimental conditions. Please note that peaks that are present in spectra from D but absent from E could be explained as originating from different m/z 603 isobars (e.g., arising from different fatty acid combinations), as well as from the possibility that other species with masses falling inside the selected mass window of ca. 5 mass units entered the fragmentation chamber. (F) UL species migrate on silica gel-TLC plates like synthetic diradylglycerols. One fifth of material extracted in PE from 2 mg proteinase K-treated shCD1b or from a control excluding CD1b was loaded in lanes 4 and 2, respectively. Synthetic standards loaded for comparison are (1μg per component, unless otherwise indicated): St-st: stearyl-stearate (2 μg); 1,2-diradylGro: mixture of 1,2-dipalmitoyl-sn-glycerol, 1-O-hexadecyl-2-O-arachidonoyl-sn-glycerol, and 1,2-di-O-hexadecyl-rac-glycerol; 1,3-diradylGro: mixture of 1,3-diolein and 1,3-di-O-hexadecyl-rac-glycerol. The plate was developed as indicated in SI Methods and bands revealed by charring with one of the most universal reagents: 10% CuSO4in H3PO4/H2SO4/MeOH. To
improve signal contrast, the bottom half of the plate was darkened slightly. (G)1H NMR data for UL species are compatible with a mixture of diradylglycerol
structures. Data were acquired overnight (Bruker Avance 600 MHz spectrometer) after dissolving the residue extracted from 2 mg of proteinase K-treated shCD1b (Top) or from a control without protein (Middle) in CDCl3.The 2.2- to 5.2-ppm window showing glyceryl and fatty acidα protons is presented. Bottom:
For comparison, the same region of a spectrum obtained for a mixture of 1,2-dipalmitoylGro (100μg), 1,3-diolein (400 μg), 1-O-hexadecyl-2-O-arachidonoylGro (200μg), and 1-hexadecyl-3-O-stearoylGro (200 μg) (15 min acquisition). Attribution of signals is indicated with labels and is based on comparisons with published data. Signal at 2.82–2.85 ppm are from internal arachidonoyl bis-allylic protons, which in the UL extract seem to happen with insufficient abundance as to permit detection. Black and gray labels are for diAcGro and AkAcGro, respectively. Signals assigned to diradylglycerols with 1,3-regioisomery are labeled with an asterisk, otherwise are from 1,2-regioisomer. The UL peak indicated with an arrow could not be attributed.
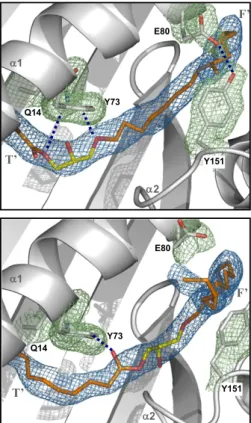
Q14 Y73 2 E80 Y151 F’ T’ 1 Q14 Y73 2 E80 Y151 F’ T’ 1
Fig. S3. Potential interactions between fully embedded 1,3-diradylglycerol spacer and shCD1b pocket residues. Top view showing a hypothetical 1-hexadecyl-3-O-arachidoyl-glycerol (AkAcGro) modeled at the emplacement of UL in copy A of the shCD1b-SGL12-UL structure (Upper). Lower: For comparison, a similar view of the same AkAcGro ligand modeled at the emplacement of UL in the reported structure of shCD1b with endogenous PC and UL (Protein Data Bank entry 2H26). The orientation of the AkAcGro relative to the groove was chosen arbitrarily, with the C16alkyl tail occupying the F’ pocket. Glyceryl carbon atoms
of AkAcGro are colored yellow with the intention to highlight their relative emplacement, and therefore the possibility that the oxygen atoms could establish hydrogen bonds with side-chain atoms of Gln14 and Tyr73 (shown as blue dashed lines). The Glu80-Tyr151 contact that closes the F’ pocket entrance and prevents spacer projection to the aqueous milieu in copy A (Upper) is also depicted. Electron density is from 2Fo-Fcmaps (1.0σ) obtained with C40-long linear UL
models. The mesh is colored blue around spacer atoms and in green for CD1b side-chain atoms. SGL12 (Upper) and PC (Lower) are not shown, for clarity. The AkAcGro molecule is drawn as sticks and colored in orange with oxygen atoms in red. Other details are as in Fig. 2.
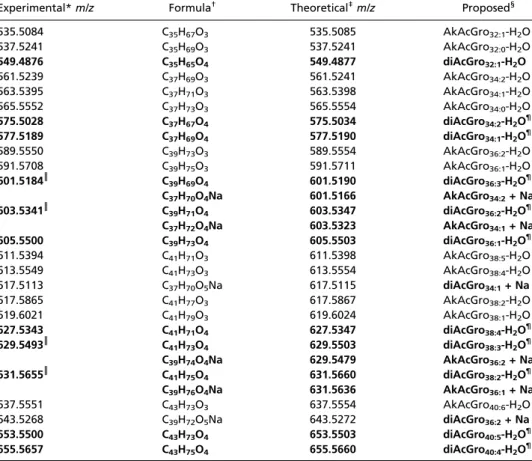
Table S1. Characterization of UL by positive mode Fourier transform ion cyclotron resonance MS Experimental* m/z Formula† Theoretical‡m/z Proposed§
535.5084 C35H67O3 535.5085 AkAcGro32:1-H2O 537.5241 C35H69O3 537.5241 AkAcGro32:0-H2O 549.4876 C35H65O4 549.4877 diAcGro32:1-H2O 561.5239 C37H69O3 561.5241 AkAcGro34:2-H2O 563.5395 C37H71O3 563.5398 AkAcGro34:1-H2O 565.5552 C37H73O3 565.5554 AkAcGro34:0-H2O 575.5028 C37H67O4 575.5034 diAcGro34:2-H2O¶ 577.5189 C37H69O4 577.5190 diAcGro34:1-H2O¶ 589.5550 C39H73O3 589.5554 AkAcGro36:2-H2O 591.5708 C39H75O3 591.5711 AkAcGro36:1-H2O 601.5184║ C39H69O4 601.5190 diAcGro36:3-H2O¶ C37H70O4Na 601.5166 AkAcGro34:2+ Na 603.5341║ C39H71O4 603.5347 diAcGro36:2-H2O¶ C37H72O4Na 603.5323 AkAcGro34:1+ Na 605.5500 C39H73O4 605.5503 diAcGro36:1-H2O¶ 611.5394 C41H71O3 611.5398 AkAcGro38:5-H2O 613.5549 C41H73O3 613.5554 AkAcGro38:4-H2O 617.5113 C37H70O5Na 617.5115 diAcGro34:1+ Na 617.5865 C41H77O3 617.5867 AkAcGro38:2-H2O 619.6021 C41H79O3 619.6024 AkAcGro38:1-H2O 627.5343 C41H71O4 627.5347 diAcGro38:4-H2O¶ 629.5493║ C41H73O4 629.5503 diAcGro38:3-H2O¶ C39H74O4Na 629.5479 AkAcGro36:2+ Na 631.5655║ C41H75O4 631.5660 diAcGro38:2-H2O¶ C39H76O4Na 631.5636 AkAcGro36:1+ Na 637.5551 C43H73O3 637.5554 AkAcGro40:6-H2O 643.5268 C39H72O5Na 643.5272 diAcGro36:2+ Na 653.5500 C43H73O4 653.5503 diAcGro40:5-H2O¶ 655.5657 C43H75O4 655.5660 diAcGro40:4-H2O¶
*Experimental masses of most intense peaks detected by positive-ion mode Fourier transform ion cyclotron resonance MS in a PE extract obtained from proteinase K-treated shCD1b. Only those peaks confirmed in two independent experiments are listed.
†Molecular formulafitting to the given experimental mass within instrument accuracy (below 3 ppm). The next
combinations of elements (maximal number) were considered: C (50), H (100), N (6), O (8), S (4), Li (1), Na (1), and K (1).
‡Calculated monoisotopic ion mass.
§Proposed chemical identity: AkAcGro: alkylacylglycerol; AkAcGro-H
2O: AkAcGro dehydration product; diAcGro:
diacylglycerol. Numbers indicate the cumulated length and number of insaturations in the two fatty acid chains (i.e., excluding those from carbonyls and dehydration). The proposition takes into account TLC and1H NMR data
discussed in the text.
¶AkAcGro [M+H]+species might also contribute to the indicated isobar.
║C
xHyO3Li formula alsofits within the instrument accuracy to this experimental mass.
Table S2. Data collection and refinement statistics for CD1b–SGL12–UL Data collection Space group C2 Cell dimensions a, b, c (Å) 203.25, 67.58, 88.19 α, β, γ (°) 90.00, 112.26, 90.00 Resolution (Å) 36.54–1.90 (2.00–1.90)* Rsym 0.070 (0.362) I/σ 11.2 (1.8) Completeness (%) 92.8 (71.1) Redundancy 2.9 (1.6) Refinement Resolution (Å) 20.00–1.90 No. reflections 80,866 Rwork/Rfree 0.1700/0.2208 No. atoms Protein 5884 Glycan 174 Ligand 183
Solvent (water, ions, glycerol) 571 B-factors (Å2)
Protein 34.6
Glycan 66.8
Ligand 57.1
SGL copy A (73 atoms) UL copy A (40 atoms) 68.1 44.4 SGL copy B (31 atoms) UL copy B (39 atoms) 53.3 52.8 Solvent (water, ions, glycerol) 46.1 rms deviations
Bond lengths (Å) 0.024
Bond angles (°) 2.039