HAL Id: hal-01180142
https://hal.archives-ouvertes.fr/hal-01180142
Submitted on 24 Jul 2015
HAL is a multi-disciplinary open access
archive for the deposit and dissemination of
sci-L’archive ouverte pluridisciplinaire HAL, est
destinée au dépôt et à la diffusion de documents
Reaction and Transport Interplay in Al MOCVD
Investigated Through Experiments and Computational
Fluid Dynamic Analysis
Theodora C. Xenidou, Nathalie Prud’homme, Constantin Vahlas, Nicholas C.
Markatos, Andreas G. Boudouvis
To cite this version:
Theodora C. Xenidou, Nathalie Prud’homme, Constantin Vahlas, Nicholas C. Markatos, Andreas G.
Boudouvis. Reaction and Transport Interplay in Al MOCVD Investigated Through Experiments and
Computational Fluid Dynamic Analysis. Journal of The Electrochemical Society, Electrochemical
Society, 2010, vol. 157 (n° 12), pp. 633-641. �10.1149/1.3493617�. �hal-01180142�
To cite this version : Xenidou, Theodora C. and Prud’homme,
Nathalie and Vahlas, Constantin and Markatos, Nicholas C. and
Boudouvis, Andreas G. Reaction and Transport Interplay in Al
MOCVD Investigated Through Experiments and Computational Fluid
Dynamic Analysis. (2010) Journal of The Electrochemical Society
(JES), vol. 157 (n° 12). pp. 633-641. ISSN 0013-4651
To link to this article : doi:
10.1149/1.3493617
URL :
http://dx.doi.org/10.1149/1.3493617
O
pen
A
rchive
T
OULOUSE
A
rchive
O
uverte (
OATAO
)
OATAO is an open access repository that collects the work of Toulouse researchers and
makes it freely available over the web where possible.
This is an author-deposited version published in :
http://oatao.univ-toulouse.fr/
Eprints ID : 14108
Any correspondance concerning this service should be sent to the repository
Reaction and Transport Interplay in Al MOCVD Investigated
Through Experiments and Computational Fluid Dynamic
Analysis
Theodora C. Xenidou,a,zNathalie Prud’homme,b,cConstantin Vahlas,b Nicholas C. Markatos,aand Andreas G. Boudouvisa
a
School of Chemical Engineering, National Technical University of Athens, Athens 15780, Greece
b
Centre Interuniversitaire de Recherche et d’Ingénierie des Matériaux, Ecole Nationale Supérieure d’Ingénieurs en Arts Chimiques et Technologiques, 31030 Toulouse Cedex 4, France
An improved reactive transport model of a metallorganic chemical vapor deposition process for the growth of aluminum films from dimethylethylamine alane is developed. The computational fluid dynamics model is built under PHOENICS software for the simulation of the coupled fluid flow, heat transfer, and chemistry. The growth mechanism of aluminum films is based on well-established, in the literature, reaction order and activation energy of gas-phase and surface reactions. The improvement of the model against a simplified model is established. The interplay of reaction and transport is elucidated. In particular, the important effects of the gas-phase reaction and of the showerhead system are revealed; accounting for gas-phase along with surface reactions for the flow details in the showerhead and for the three-dimensional geometry induced by the distribution of the holes in the showerhead yields substantial enhancement of the predictive capability of the model. The satisfactory agreement between model predictions and growth-rate measurements allows one to understand and improve the process. The model is further used to investigate the effect of key operating parameters on the characteristics of the aluminum films. Simulation results are suggestive of modifications in the operating parameters that could enhance the growth rate and its spatial uniformity.
Aluminum ~Al! is the major element in complex metallic alloys ~CMAs!, including quasicrystalline phases, such as the Al62Cu25Fe13
icosahedral one.1Such phases present strong technological potential due to their interesting properties and combination of properties.2 This is especially the case for CMA films, applied on complex-in-shape substrates. Metallorganic chemical vapor deposition ~MOCVD! is a promising technique to meet this challenge and for this reason the growth of Al films was selected as the first important step toward the establishment of a robust, innovative MOCVD pro-cess for the production of CMA films.
Although MOCVD is essentially a chemical surface process, transport phenomena are very complex in MOCVD reactors3and the accurate control of the growth of films brings together various as-pects of fluid flow, heat transfer, and chemical kinetics.4,5Extended experimentation is required to determine operating conditions for process optimization. Alternatively, modeling of the MOCVD pro-cess and simulation at appropriately selected conditions could make the time-consuming experimental investigation more efficient.6-9 Preliminary results of the supplementary use of growth experiments and computational fluid dynamics ~CFD! simulations of Al MOCVD process from dimethylethylamine alane ~DMEAA! have already been published by the authors.10The selection of DMEAA as the metal-organic precursor for Al, was based on the results of previous experimental studies on its decomposition11-19 and on the subse-quent deposition of aluminum films.20,21The published results con-cerned the simulation of Al growth in the narrow temperature range of 200–220°C and they provided an insight into the hydrodynamics and the thermal patterns of the MOCVD reactor to be used in the future production of the Al-based CMAs.
In the present work, the experimental investigation of Al growth in an expanded temperature range enhances the improvement of a simple starting model,10which is now ready to be used in the thor-ough investigation of the MOCVD of Al-based multinary interme-tallic films. Specifically, complementary measurements were ob-tained in the temperature range of 160–260°C at 10 Torr and concerned the dependence of the growth-rate profile on the process temperature, on the distance between the gas delivery system and
the heated substrate, and on the use of the perforated plate of the showerhead system. The complete set of the experimental data was utilized to formulate a comprehensive reactive transport model for Al-MOCVD based on PHOENICS CFD software.22,23The aim of this work is to reproduce the experimental measurements through realistic CFD modeling and, more importantly, to contribute to the understanding of Al from DMEAA under subatmospheric pressure conditions.
DMEAA has been experimentally investigated as a precursor for aluminum films by several groups.11-19Plausible reaction pathways of DMEAA dissociation were suggested to explain the observations.12,14,24Kinetic parameters, such as reaction order and activation energy, were reported for chemical reactions in the gas phase and on the surface.16,17According to these experimental ob-servations, the Al growth rate increased to a maximum around 150°C and then decreased at substrate temperature above 150°C.17 The activation energy of the surface reaction was found to be 9.96 kcal/mol when the substrate temperature was lower than 150°C, which is believed to be in the surface-reaction-limited re-gime. The gas-phase reaction mechanism in Al MOCVD from DMEAA was investigated using in situ real-time FTIR spectroscopy.16The gas-phase dissociation reaction of DMEAA into dimethylamine ~DMEA! and alane was found to be first order with activation energy of 9.56 kcal/mol. Moreover, the gas-phase DMEAA was unstable even at room temperature, resulting in disso-ciation into DMEA and alane, and the dissodisso-ciation rate accelerated at higher values of gas temperature. Matsuhashi et al.25revealed an increase of the pressure in a DMEAA container from 0.5 to 200 Torr in 500 h at ambient temperature. The alane is also known to be very unstable in the gas phase and forms a dimer, trimer, and even a polymer.26 When the substrate temperature is higher than 150°C, it is believed that alane can be readily polymer-ized and it is not readily adsorbed on the surface to form aluminum films.12The rapid dissociation of DMEAA in the gas phase brings about the decrease of the growth rate when the substrate temperature is above 150°C. A similar effect of temperature on the behavior of DMEAA was also reported by Jang et al.;18the temperature where the maximum growth rate was obtained was 160°C, to be compared with 150°C in the work by Yun et al.17 It was also reported that when temperature is below 160°C, it is very difficult to distinguish a mass-transport-limited regime from a surface-reaction-limited one.
cPresent address: University Paris Sud 11, LEMHE/ICMMO, Orsay Cedex, France zE-mail: thexen@central.ntua.gr
All these experimental findings are taken into account in the present reactive transport model, which is a more elaborate version of the one presented earlier.10The effect of reactive transport in the gas phase is added to the surface chemistry to account for the de-crease of the Al growth rate at higher values of temperature. The detailed description of the perforated plate of the showerhead sys-tem, in a three-dimensional reactor discretization, further improves the accuracy of the model predictions. The improved model is then used to investigate the effect of key operating parameters on Al growth rate and its spatial uniformity over the surface of the heated substrate.
Experimental
Growth experiments of Al films were performed in the experi-mental setup schematically illustrated in Fig.1. This MOCVD setup is composed of a stagnant flow, cylindrical, vertical, stainless steel reactor, the dimensions of which were reported previously.10The deposition chamber is made of double envelope, allowing the wall temperature to be monitored through the circulation of thermally regulated silicon oil. HF cleaned 5 3 10 mm silicon coupons were used as substrates. They were positioned horizontally at different places on a 58 mm diameter susceptor and heated by a resistance coil gyred just below the surface of the susceptor. The input gas is
distributed though a showerhead system containing a 60 mm diam-eter perforated plate. The base pressure of reactor is 10−6Torr,
while the total pressure was fixed at 10 Torr.
99% pure DMEAA ~Epichem! was used as received in a stainless steel bubbler. It was maintained at 9°C, corresponding to a saturated vapor pressure of 0.7 Torr. The DMEAA bubbler was maintained at this temperature during the entire period of its service in order to avoid degradation of the precursor.2599.9992% pure N2~Air
Prod-ucts! was fed through two electropolished stainless steel gas lines with VCR fittings. One line was used for bubbling through the Al precursor and the other for the dilution of the input gas. The flow rate of the dilution N2was 305 sccm, while the bubbling N2flow
rate was 25 sccm. Assuming saturation of the gas phase, these con-ditions lead to an upper limit of the flow rate of DMEAA equal to 2 sccm.
TableI summarizes the operating conditions and the results of the growth experiments. In the first four experiments ~expl, l = 1,4! the perforated shower plate of the gas delivery system was used, while in the last four experiments ~expl, l = 5,8!, the plate was removed from the showerhead system. Growth rate was measured at certain positions over the substrate, through the weight gain of each sample. Figure2depicts the average growth rate of Al films on Si substrates as a function of substrate temperature, in the range of 160–260°C. Only experiments corresponding to a 15 mm distance between the perforated shower plate and the heated substrate are included in the Arrhenius plot. As shown in Fig.2, the growth rate
!"#$%!$&' ()*+%&+$ ,(-. /%&. !"#$%!$&' ()*+%&+$ ,(-. /%&.
Figure 1. ~Color online! Schematic illustration of the experimental MOCVD setup.
Table I. Experimental operating conditions and results for the growth of Al films.
Case Sample name Growth temperature, Ts ~°C! Wall temperature, Tw ~°C! Inlet temperature, Tin ~°C! Plate– substrate distance, Dp–s~mm! Deposition duration, td ~min! Average growth rate, GR ~Å/min! I: with shower plate exp1 160 25 65 15 120 161.6 exp2 200 25 65 15 120 237.8 exp3 220 25 65 15 120 227.2 exp4 260 25 65 15 120 79.0 II: without shower plate exp5 220 25 67 15 120 544.6 exp6 240 75 75 20 30 335.3 exp7 260 25 25 15 120 453.5 exp8 260 50 75 21 50 418.5 2 4 6 8 0,0015 0,0018 0,0021 0,0024 0,0027 Series1
Series2without plate with plate Surface reaction rate limited a Gas phase competitive phenomena !" $ !%& ' ( $) * + ,-. /0 ,1 /2 $) !3 4( && " $-5& 394 283 203 144 97 2 4 6 8 0,0015 0,0018 0,0021 0,0024 0,0027 Series1
Series2without plate with plate Surface reaction rate limited a Gas phase competitive phenomena !" $ !%& ' ( $) * + ,-. /0 ,1 /2 $) !3 4( && ' ( $) * + ,-. /0 ,1 /2 $) !3 4( && " $-5& 394 283 203 144 97
Figure 2. Arrhenius plot of the growth rate of Al films as a function of substrate temperature, with and without the use of the shower plate.
of Al films increases as the substrate temperature increases up to 200°C when the shower plate is used. On the contrary, the Al growth rate decreases with further increase of substrate temperature above 200°C. This trend is observed for both cases examined, i.e., with and without the use of the shower plate, and is consistent with previous experimental findings cited in the introduction. It is worth mentioning that the objective of the reported experimental part was to provide data on the growth rate of Al films under different depo-sition conditions rather than to propose another value of the activa-tion energy of the growth process.
The Reactive Transport Model
The starting point for the present work is a simplified CFD model constructed by Xenidou et al.10to simulate the hydrodynamic and thermal flow of the MOCVD reactor, including an overall sur-face reaction to account for the growth of Al films from DMEAA. The present reactive transport model includes two important refine-ments that account more reliably for the reactor configuration and for the growth chemistry; the first refinement concerns the transport model while the second one is an addition to the reactive model. For reasons of completeness, the main features of the reactive transport model are presented below followed by the detailed description of the model improvements.
The reactive transport model for the MOCVD process relates the physicochemical phenomena occurring in the reactor to the proper-ties of the Al films. The core of the model is formed by the transport model describing the gas flow and transport of energy and species in the reactor. The basic components of the reactive model are ~i! a gas-phase chemistry part, including the reaction path and rate con-stant for the homogeneous reaction, which influences the species concentration distribution near the growth surface, and ~ii! a surface chemistry part which describes how reactions between gas-phase species and adsorbed species on the surface lead to the film growth. The coupling of transport phenomena and chemistry under the framework of computational fluid dynamics is the master approach followed in the simulation of chemical vapor deposition ~CVD! pro-cesses. Following the first publications on CVD reactor modeling in the late 70s and early 80’s,27-29the computational analyses of CVD processes have been based on CFD models that combine either mul-tidimensional flow with rather simple chemistry30-33or simple zero or one-dimensional flow with detailed gas-phase and surface chemi-cal reactions.34-37Since the late 90’s, however, the combination of multidimensional fluid dynamics with multireaction chemistry has become feasible due to the increasing availability of computational power and efficiency.5,38,39More detailed overview of the develop-ment of CVD simulation models in the past decades can be found in Ref.5. In recent years, successful attempts have been made in em-ploying CFD models to optimize CVD process conditions40,41and hydrodynamic design of CVD reactors42with respect to growth-rate uniformity. The present reactive transport model is based on the state-of-the-art approach that combines three-dimensional fluid dy-namics with homogeneous and heterogeneous reactions, enabling a realistic description of the transport phenomena and of the growth process inside the MOCVD reactor. Such an approach ensures that the present model can be used as a reliable tool in the optimization of the reactor design; the framework for this work has been recently developed combining the simplified model of the MOCVD process with evolutionary algorithms.43
The transport phenomena in the gas mixture are described by the conservation equations of mass, momentum, and energy, coupled to the conservation equations for the individual chemical species, un-der the following reasonable assumptions: the gas multicomponent mixture is treated as a continuum; laminar gas flow conditions exist; steady-state conditions prevail; the equation of state obeys the ideal gas law. The reader is referred to earlier work10for detailed discus-sion of the simplifying assumptions. The complete set of the non-linear partial differential equations is as follows:44
Mass balance: ¹ ·srud = 0 f1g Momentum balance: ¹ ·sruud = − ¹ P + rg + ¹ ·
F
ms ¹ u + s ¹ udTd −2 3ms ¹ · udIG
f2g Energy balance: cp¹ ·sruTd = ¹ · sl ¹ Td −o
i=1 N ji· DHi Mi −o
i=1 No
k=1 K HigikRk g f3g Species balance: ¹ ·sruvid = − ¹S
− rDi eff¹ v i− rviDi eff¹ sln Md + MviDieffo
j=1,jÞi N jjC MjDij − DiT¹sln TdD
+ Mio
k=1 K gikRk g f4g The transport equations are subject to the following boundary conditions for velocity field, temperature profile, and species con-centration distribution: ~i! at the inlet, the velocity distribution is considered uniform, the gas feed is assumed to be at constant tem-perature, and the species mass fractions are set to the experimental values; ~ii! the operating pressure is specified at the outlet, where zero normal derivatives are assumed for all other variables f sf = T,ux,uz,uy,vid; ~iii! the no-slip condition for gas velocity isap-plied at any solid surface; ~iv! the temperature is fixed at the outer walls of the reactor; and ~v! the temperature is fixed inside the susceptor at a position of 3–4 mm from the substrate surface; it is the position where the thermocouple is located. A conjugate heat transfer model is used to calculate the temperature inside the sus-ceptor and on the substrate surface.
The properties of the individual gas species and the binary dif-fusion coefficients are estimated using the kinetic gas theory.45 De-tailed description of mixing rules used for the calculation of the properties of the multicomponent gas mixture in terms of pressure, temperature, and composition is given in earlier work.46 The Lennard-Jones parameters of the individual chemical species are taken from Choi et al.47
The deposition rate was described by the formula adopted by many researchers48,49that combines surface reaction and gas-phase diffusion of reactive species through the boundary layer,
1 Rd = 1 RS +
o
i=1 N si RiD f5gThe calculated deposition rate Rdsmol/m2sd was converted to
the experimentally measured growth rate, GR ~Å/min! as GR = 6 3 1011Rd
Ms
rs
f6g The variation of the growth rate is calculated through the maxi-mum, minimaxi-mum, and average growth rate, i.e., by
DG =GRmax− GRmin
GR f7g
The transport equations for mass, momentum, energy, and chemical species described above have the general form50
¹ ·srufd = ¹ · sGf¹ fd + Sf0 + Sf8f f8g
In Eq.8, the Sf= Sf 0
+ Sf
8
fis the generalized source term,linear-ized in variable f. To numerically solve these equations, PHOEN-ICS CFD software was used,22which is based on the finite volume method.50The momentum and continuity equations were coupled through the SIMPLEST ~Semi-Implicit Method for Pressure-Linked Equations ShorTened! scheme and the upwind differencing scheme was used for the convective terms. The discretized transport equa-tions were solved in a segregated way, i.e., the coupling between the velocity components, the pressure correction, the temperature, and each of the species mass fractions is accounted for through iteration. To ensure convergence, linear relaxation was used for pressure cor-rection and temperature and false time step relaxation was applied to all other variables.
Improvement 1.— While the axial symmetry of the vertical MOCVD reactor supports the two-dimensional ~2D! approximation of the reactor, the nonuniform distribution of the holes over the shower plate requires a three-dimensional ~3D! simulation. In the starting simplified model,10the MOCVD reactor was spatially dis-cretized in 2D curvilinear coordinates based on the assumption of axial symmetry of the vertical reactor. The latter assumption was supported by the approximate treatment used to simulate the flow through the perforated plate. According to that approximation, the shower plate was not included in the solution domain and the cor-responding control volumes were treated as solid. To overcome the discontinuity of the flow in the solution domain, the pressure loss due to friction was specified using the Darcy–Weisbach equation for laminar flow,51
DP = 32muz
L
d2 f9g
In the present improved model, the reactor is discretized in 3D curvilinear coordinates to account for the detailed configuration of the perforated shower plate as shown in Fig. 3. The shower plate consists of 1450 holes of 0.76 mm diameter. The thickness of the plate is 1 mm. In this case, the approximate boundary condition described above was removed and the computational domain was extended inside the plate for the gas flow through the plate to be adequately resolved; this required a finer computational grid inside the holes of the plate.
Improvement 2.— In the preliminary analysis of the MOCVD reactor, in the temperature range of 200–220°C, a fast reaction was assumed to occur on the substrate surface in one step according to fsCH3d2C2H5gNAlH3sgd → Alssd + fsCH3d2C2H5gNsgd + 3/2H2sgd
f10g The rate constant was chosen to be large enough for the growth rate to be independent of its value. This assumption is valid in the transport-limited regime where the surface reaction is very fast and the growth rate approaches the diffusive flux of the species to the substrate surface. The rate of consumption of reactants and the rate of production of products were based on the stoichiometry of the overall surface reaction ~Eq.10!.
In the present work, to calculate the growth rate of Al films in the temperature range of 160–260°C, a reactive model was formulated. It considers both homogeneous and heterogeneous chemical reac-tions obtained from the literature.16,17Although plausible reaction mechanisms, including adsorption of DMEAA, surface reactions, and desorption of hydrogen and DMEA were reported,14the activa-tion energy is available only for the overall reacactiva-tion. Thus, the chemical reactions considered in the improved reactive model of the Al growth process are listed in TableII. The first reaction occurs in the gas phase, resulting in the DMEAA dissociation into DMEA and alane, while the second one occurs on the surface, resulting in the growth of Al films on the heated substrates. It was assumed that once DMEAA is dissociated in the gas phase, gas-phase alane
de-composes almost immediately without contributing to the film growth.12,26Thus, the first reaction is responsible for the degradation of DMEAA in the gas phase, resulting in the decrease of the growth rate at higher substrate temperatures. Moreover, the gas-phase reac-tion was considered to occur only in the forward direcreac-tion, because the reverse reaction can occur very slowly under a H2
environment.16Note that the activation energy was obtained from the cited references; the pexponential factor of the gas-phase re-action was extracted from the Arrhenius plot of the Al–N dissocia-tion reacdissocia-tion-rate constant ~see Fig. 6 in Ref. 16!. The pre-exponential factor of the surface reaction was fitted to the experimental data.
Results and Discussion
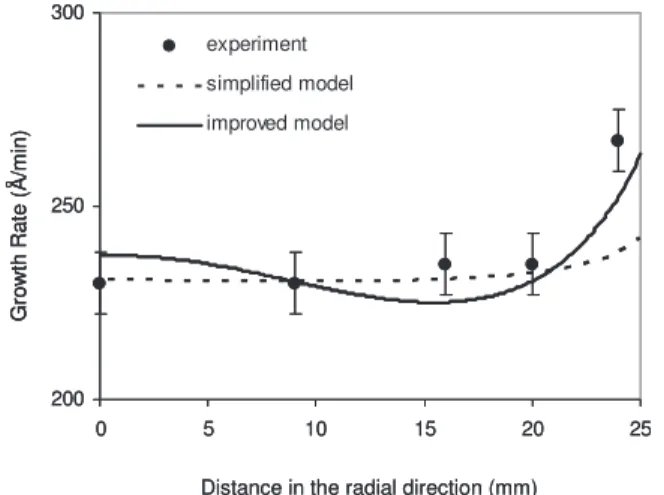
Comparison with the simplified model.— At first, the improve-ment of the present reactive transport model was evaluated in com-parison to the reference simplified one.10 Figure 4 compares the predictions of the two models with the experimental measurements in terms of the Al growth-rate profile at growth temperaturesTsd of
200°C and plate–substrate distancesDp–sd of 15 mm. The
continu-ous curve is the prediction of the improved model, while the dotted line corresponds to the simplified model. It can be seen that although the simplified model follows the evolution of the experimental growth rate in the radial direction, it fails to capture the rapid in-crease of the growth rate toward the edge of the substrate, i.e., at 25 mm. On the other hand, the improved model performs much better at the edge of the substrate. Taking into account the experi-mental error of the growth rate ~68 Å/min at 200°C!, the predic-tions of the improved model are very satisfactory.
Figure 3. ~Color online! Schematic illustration of the showerhead gas deliv-ery system.
Validation of the model.— The improved model is validated against experimental measurements obtained in the MOCVD setup. Remember that the first set of experiments was carried out with the use of the perforated plate while in the second set the plate was removed from the showerhead system. Figure5shows the compari-son of the model predictions with the experimental growth rates when the perforated plate is used ~case I!. As shown in Fig.5a, the
predicted growth rates at 160°C are very high compared to the perimentally measured ones. This significant divergence can be ex-plained by the incubation time of Al growth on silicon substrates. According to our experimental observations, the incubation time, during which no appreciable deposition had been observed at 160°C, was approximately 2 min at the center of the susceptor and almost 15 min at its edge; i.e., at 25 mm from the center. The incu-bation time was not taken into account in the calculation of the growth rate; that is, the incubation time was not subtracted from the total duration of each experiment. Similar incubation times of Al growth from DMEAA have also been observed on Si and SiO2.
14,18
In agreement with literature results, the incubation time decreases with increasing deposition temperature in the investigated range of temperature.
The agreement between experimental and predicted growth-rate profiles is satisfactory at higher values of temperatures200–260°Cd, as depicted in Fig.5b-5d. Note that growth rate decreases with in-creasing Ts, and this trend is also predicted by the improved model.
We emphasize that this is the important effect of the second modi-fication of the model, i.e., the addition of the gas-phase reaction which is responsible for the rapid degradation of the Al precursor in the gas phase.
Figure6presents the predicted Al growth rates with experimen-tally measured ones for case II, i.e., without the shower plate. Note that the model is modified to describe the plate-free showerhead system. According to the experimental measurements, when the shower plate is removed from the gas delivery system, growth rates
Table II. Chemical reactions and rate constants for reaction k „m = 1,2…, km= Amexp„−EmÕRT….
Reactions Classification Activation energy skcal mol−1d Pre-exponential factora Ref. 1 fsCH3d2C2H5gNAlH3sgd → fsCH3d2C2H5gNsgd + AlH3sgd Volumetric 9.56 2.4 3 107 16
2 fsCH3d2C2H5gNAlH3sgd → Alssd + fsCH3d2C2H5gNsgd + 3/2H2sgd Surface 9.96 4.0 3 100 18 aThe pre-exponential factor in the gas-phase reaction is given in units of s−1and that of the surface reaction in m s−1.
G ro w th R a te (A /m in )
Distance in the radial direction (mm) 200 250 300 0 5 10 15 20 25 experiment simplified model improved model G ro w th R a te (A /m in ) G ro w th R a te (A /m in )
Distance in the radial direction (mm) 200 250 300 0 5 10 15 20 25 experiment simplified model improved model
Figure 4. Al growth rate along the radial direction at Ts= 200°C and
Dp–s= 15 mm. Experimental measurements vs model predictions.
0 100 200 300 400 0 5 10 15 20 25 experiment model 0 100 200 300 400 0 5 10 15 20 25 experiment model 100 200 300 400 0 5 10 15 20 25 experiment model 0 100 200 300 400 0 5 10 15 20 25 experiment model G ro w th R a te (A /m in ) G ro w th R a te (A /m in ) G ro w th R a te (A /m in ) G ro w th R a te (A /m in )
Distance in the radial direction (mm) Distance in the radial direction (mm)
Distance in the radial direction (mm) Distance in the radial direction (mm)
(a) (b) (d) (c) 0 100 200 300 400 0 5 10 15 20 25 experiment model 0 100 200 300 400 0 5 10 15 20 25 experiment model 100 200 300 400 0 5 10 15 20 25 experiment model 0 100 200 300 400 0 5 10 15 20 25 experiment model G ro w th R a te (A /m in ) G ro w th R a te (A /m in ) G ro w th R a te (A /m in ) G ro w th R a te (A /m in ) G ro w th R a te (A /m in ) G ro w th R a te (A /m in ) G ro w th R a te (A /m in ) G ro w th R a te (A /m in )
Distance in the radial direction (mm) Distance in the radial direction (mm)
Distance in the radial direction (mm) Distance in the radial direction (mm)
(a) (b)
(d) (c)
Figure 5. Al growth rate along the radial direction, at ~a! Ts= 160°C, ~b! Ts
= 200°C, ~c! Ts= 220°C, and ~d! Ts
= 260°C. Experimental measurements vs model predictions, for the case with the perforated plate, case I. The plate– substrate distance is Dp–s= 15 mm.
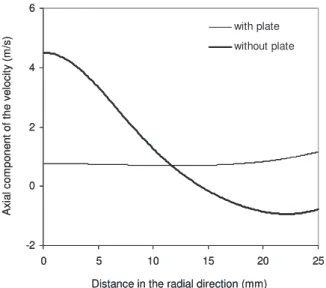
become higher at the center of the substrate while they decrease in the radial direction. This change in the growth-rate radial profile was observed for the temperature range investigateds220–260°Cd and is also confirmed by the model. To identify the origin of this change in the radial profile of the growth rate, the distribution of the DMEAA over the substrate was further investigated. As expected, the distri-bution of the DMEAA mass fraction follows a similar trend with that of the growth rate for both cases examined, i.e., with and with-out the shower plate. The significant increase of the DMEAA mass fraction at the center of the substrate, when the plate is removed from the showerhead system, is due to the dominant convection related to the high velocity of the gas mixture. This is shown in Fig.
7, which depicts the distribution of the axial component of the ve-locity along the radial direction of the reactor, with and without the
plate. The negative values of the axial velocity around 15 mm indi-cate the presence of a large recirculation zone that extends outside the showerhead system when the plate is removed, as shown in Fig.
8. The origin of this relatively large zone may be attributed to the local pressure drop due to the velocity increase and the change of the flow direction at the showerhead.
The relative effect of gas-phase and surface reaction in the tem-perature range of 160–260°C can be deduced from the DMEAA consumption, presented in Fig.9. Note that the points represent the model predictions at the experimental operating conditions tabulated in TableI. The straight lines are linear trend lines of the discrete points. The primary ~left! axis is used for the consumption of DMEAA through the gas-phase reaction, while the secondary ~right! axis is used for the surface reaction. As expected, the consumption of DMEAA in the gas-phase increases with temperature. Specifi-cally, the DMEAA degradation is almost 82.5% at 160°C, while it exceeds the value of 97.5% at 260°C when the shower plate is used. When the perforated plate is removed from the showerhead system, the DMEAA degradation follows a similar trend but the
correspond-0 200 400 600 800 1000 1200 0 5 10 15 20 25 experiment model 0 200 400 600 800 1000 1200 0 5 10 15 20 25 experiment model 0 200 400 600 800 1000 1200 0 5 10 15 20 25 experiment model 0 200 400 600 800 1000 1200 0 5 10 15 20 25 experiment model G ro w th R a te (A /m in ) G ro w th R a te (A /m in ) G ro w th R a te (A /m in ) G ro w th R a te (A /m in )
Distance in the radial direction (mm) Distance in the radial direction (mm)
Distance in the radial direction (mm) Distance in the radial direction (mm)
(a) (b) (c) (d) 0 200 400 600 800 1000 1200 0 5 10 15 20 25 experiment model 0 200 400 600 800 1000 1200 0 5 10 15 20 25 experiment model 0 200 400 600 800 1000 1200 0 5 10 15 20 25 experiment model 0 200 400 600 800 1000 1200 0 5 10 15 20 25 experiment model G ro w th R a te (A /m in ) G ro w th R a te (A /m in ) G ro w th R a te (A /m in ) G ro w th R a te (A /m in ) G ro w th R a te (A /m in ) G ro w th R a te (A /m in ) G ro w th R a te (A /m in ) G ro w th R a te (A /m in )
Distance in the radial direction (mm) Distance in the radial direction (mm)
Distance in the radial direction (mm) Distance in the radial direction (mm)
(a)
(b)
(c) (d)
Figure 6. Al growth rate along the radial direction, at ~a! Ts= 220°C, Dp–s
= 15 mm, ~b! Ts= 240°C, Dp–s= 20 mm, ~c! Ts= 260°C, Dp–s= 15 mm, and ~d!
Ts= 260°C, Dp–s= 21 mm. Experimental
measurements vs model predictions, for the case without the perforated plate, case II.
Distance in the radial direction (mm)
A x ia l c o m p o n e n t o f th e v e lo c it y (m /s ) -2 0 2 4 6 0 5 10 15 20 25 with plate without plate
Distance in the radial direction (mm)
A x ia l c o m p o n e n t o f th e v e lo c it y (m /s ) -2 0 2 4 6 0 5 10 15 20 25 with plate without plate
Figure 7.Axial component of the velocity along the radial direction of the reactor, at 5 mm distance above the substrate. Ts= 220°C and Dp–s
= 15 mm.
Figure 8. ~Color online! Velocity vectors in the MOCVD reactor at Ts
= 220°C with ~left! and without ~right! the perforated shower plate.
ing values are smaller. For example, at 220°C the DMEAA con-sumption is almost 90.6% ~without plate! to be compared with 94.1% ~with plate!. The enhancement of the gas-phase consumption of DMEAA, when the perforated plate is used, may be attributed to the trapping of the gas mixture components inside the large recircu-lation zone created in the showerhead system. These large percent-ages of DMEAA degradation in the gas phase are responsible for the decrease of DMEAA consumption through the surface reaction when temperature increases and subsequently for the decrease of the growth rate above 160°C. Note that the conversion of DMEAA into Al remains lower than 5% even for the lower temperature investi-gated ~i.e., 160°C!. The slight increase of the surface-reaction yield with increasing Ts is attributed to the corresponding decrease of
gas-phase degradation of DMEAA.
In the following, the improved reactive transport model is used for a systematic parametric analysis of the MOCVD reactor for Al growth. All simulations were performed by first selecting a set of reference conditions and then by varying the value of each one of the operating parameters. The reference conditions selected in the present study correspond to the experimental sample exp3 ~see Table
I!. The predictions of the model along with the experimental mea-surements at reference conditions are shown in Fig.5c.
Effect of substrate temperature.— Parameter continuation on Ts
was performed and growth rate profiles were calculated for values of temperature from 160 to 300°C in steps of 20°C. Note that the rela-tive growth rate is equal to unity at reference conditions sTs
= 220°Cd and that growth rate variation was defined through Eq.7. The growth rate is equal to 227.2 Å/min at reference conditions. The results in Fig. 10a indicate that any increase of the substrate temperature causes a decrease of the growth rate while its variation
increases significantly. The decrease of the growth rate is more rapid above 220°C, a consequence of the significant DMEEA degradation in the gas phase. The increased variation of the growth rate with temperature is also shown in Fig.10b, where the normalized growth rate profiles at different values of temperature are compared. It can be seen from Fig.10bthat the growth rate variation is greater at a distance of about 16 mm from the center of the substrate and at the edge of the substrate, i.e., at 25 mm. Moreover, there seems to be a particular distance ~around 22.5 mm! where the variation of the growth rate starts increasing in the opposite direction.
It appears that any temperature below the reference value per-forms much better, as accompanied by a greater growth rate with an improved spatial uniformity. However, recall that the experimental growth rate at 160°C is lower compared to 220°C due to the in-creased incubation time, as discussed previously. Therefore, a value in the range 200–220°C could be considered as an optimal value of substrate temperature.
Effect of reactor pressure.— Parameter continuation on P was performed and growth rate profiles were calculated for values of pressure in the range of 5–30 Torr, by steps of 5 Torr. The reference value of reactor pressure is 10 Torr. As shown in Fig.11a, the in-crease of pressure above the reference value causes a dein-crease of the growth rate, which approximates the value of 1.6 Å/min at 30 Torr. On the other hand, note the significant increase of the growth rate by a factor of 7 when pressure is decreased to the lowest value of 5 Torr. Growth rate uniformity is improved at the lower pressure investigated, as also depicted in Fig.11b. The intersection point of the curves is almost 1 mm away from the edge of the substrate. It is concluded that any value of the operating pressure lower than the reference one is expected to improve the properties of the Al films. Effect of dilution gas flow rate.— Parameter continuation on Fd
was performed and growth rate profiles are calculated for values of flow rate from 105 to 505 sccm in steps of 100 sccm. As shown in Fig. 12a, the reference value of Fdis 305 sccm. The results show
that any increase of the flow rate of dilution nitrogen causes an increase of the growth rate. It appears that the dominant convection related to higher flow rates, and thus higher velocities, yields higher DMEAA concentrations and therefore higher growth rates. This trend in the growth rate is followed by a decrease of growth rate variation, as depicted in Fig. 12b. The increased values of the growth rate, mainly in the center of the substrate, are responsible for the improvement of the growth rate uniformity at the higher values of the flow rate.
Conclusions
This paper presents an improved computational fluid dynamics model that enables the elucidation of the reaction and transport in-terplay in the growth process of Al films from DMEAA. The reac-tive transport model was successfully constructed under the frame-work of PHOENICS CFD software to simultaneously solve the conservation equations of mass, momentum, and energy under steady-state conditions. A simplified model previously developed to describe the Al-MOCVD under low-pressure conditions was used as
80 85 90 95 100 120 160 200 240 280 320 0 5 10 15 20 with plate without plate Deposition temperature (oC) D M E A A c o n s u m p ti o n in g a s -p h a s e re a c ti o n (% ) D M E A A c o n s u m p tio n in s u rfa c e re a ct io n (% ) 80 85 90 95 100 120 160 200 240 280 320 0 5 10 15 20 with plate without plate Deposition temperature (oC) D M E A A c o n s u m p ti o n in g a s -p h a s e re a c ti o n (% ) D M E A A c o n s u m p tio n in s u rfa c e re a ct io n (% )
Figure 9. DMEAA consumption ~%! in the gas-phase and in the surface reaction. The straight lines are linear trend lines of the discrete points.
0,6 0,8 1,0 1,2 1,4 0 5 10 15 20 25 30
Distance in the radial direction (mm)
N o rm a liz e d G ro w th R a te Ts=160oC Ts=300oC Ts=160oC Ts=300oC Substrate temperature (oC) R el at iv e G row th R at e G ro w th R at e V ar ia tio n (% ) 0,0 0,2 0,4 0,6 0,8 1,0 1,2 1,4 1,6 1,8 2,0 140 160 180 200 220 240 260 280 300 320 0 10 20 30 40 50 60 70 80 90 100 Relative Growth Rate Thickness variation (%) (a) (b) 0,6 0,8 1,0 1,2 1,4 0 5 10 15 20 25 30
Distance in the radial direction (mm)
N o rm a liz e d G ro w th R a te Ts=160oC Ts=300oC Ts=160oC Ts=300oC 0,6 0,8 1,0 1,2 1,4 0 5 10 15 20 25 30
Distance in the radial direction (mm)
N o rm a liz e d G ro w th R a te Ts=160oC Ts=300oC Ts=160oC Ts=300oC Substrate temperature (oC) R el at iv e G row th R at e G ro w th R at e V ar ia tio n (% ) 0,0 0,2 0,4 0,6 0,8 1,0 1,2 1,4 1,6 1,8 2,0 140 160 180 200 220 240 260 280 300 320 0 10 20 30 40 50 60 70 80 90 100 Relative Growth Rate Thickness variation (%) Substrate temperature (oC) R el at iv e G row th R at e G ro w th R at e V ar ia tio n (% ) 0,0 0,2 0,4 0,6 0,8 1,0 1,2 1,4 1,6 1,8 2,0 140 160 180 200 220 240 260 280 300 320 0 10 20 30 40 50 60 70 80 90 100 Relative Growth Rate Thickness variation (%)
(a) (b)
Figure 10. ~a! Relative growth rate and growth rate variation as a function of sub-strate temperature. ~b! Normalized growth rate profile at different values of substrate temperature, Ts~in steps of 20°C!.
a reference model to establish the improvement of the present model. Two important refinements were found to improve the model predictions, namely the detailed description of the perforated shower plate, which influences the spatial distribution of the growth rate over the substrate, and the addition of the gas-phase reaction, which is responsible for the decrease of the growth rate at higher values of temperature.
The improved model was validated against experimental mea-surements that demonstrate the influence of the growth temperature, of the distance between the showerhead system and the heated sub-strate, and of the use of the perforated plate in the gas delivery system. The good agreement between model predictions and experi-mental data fully supports the gas and surface chemistry reported in the literature. Moreover, simulation results revealed the important effect of the gas-phase degradation of DMEAA in comparison to the limited contribution of the surface reaction to the film growth on the heated substrate.
Based on the improved model, simulation results indicated that the growth rate and its spatial variation strongly depend on the growth temperature, on the reactor pressure, and on the inlet flow rate of the dilution gas. It is concluded that the improved reactive transport model can be used as a tool to guide future experimental work toward optimal parameter values for desired growth rates and growth shapes of Al-based complex metallic alloys.
Acknowledgments
This work was supported by the General Secretariat for Research and Technology of Greece and by the French Ministry of Foreign Affairs through the Programme for “Greece–France cooperation in Research and Technology” ~contract 15207XG, 2006-08!. The sup-port of the Agence Nationale de la Recherche in France, through contract NT05-3_41834, and of the European Commission through the network of excellence NMP3-CT-2005-500140 is also acknowl-edged.
Centre Interuniversitaire de Recherche et d’Ingénierie des Matériaux as-sisted in meeting the publication costs of this article.
List of Symbols
A pre-exponential factor of reaction rate
g gravity acceleration, m s−2
u component of the velocity vector, m s−1
u velocity vector, m s−1
cp specific heat, J kg−1K−1
d diameter of the holes of the shower plate D binary diffusion coefficient, m2s−1
DT thermal diffusion coefficient, kg m−1s−1
Deff effective diffusion coefficient, m2s−1
Dp–s distance between the shower plate and the substrate, mm
exp experimental sample E activation energy, kcal mol−1
Fd flow rate of dilution gas, sccm
H enthalpy of formation, J mol−1
I unity tensor
j diffusive mass flux, kg m−2s−1
k kinetic rate
l with respect to experimental sample L thickness of the shower plate M gas mixture molecular weight, kg mol−1
Ms molecular weight of deposited ~solid! material, kg mol−1
N number of gas species P pressure, Pa
R gas constant, 8.34132 J mol−1K−1
Rd deposition rate, mol m−2s−1
RD
maximum diffusive mass flux at the surface, kg m−2s−1
Rg
gas phase reaction rate, mol m−3s
Rs surface reaction rate, mol m−2s
S generalized source term, various
S0 constant part of the generalized source term, various
S8 linear part of generalized source term, various T temperature, K
td duration of experiment, min
Greek
g gas phase stoichiometric coefficient G generalized diffusion coefficient, kg m−1
DG growth rate variation, % DP pressure loss
l gas mixture thermal conductivity, W m−1K−1
m gas mixture viscosity, Pa s r gas mixture density, kg m−3 0 1 2 3 4 5 6 7 8 0 5 10 15 20 25 30 35 0 10 20 30 40 50 60 70 80 Relative Growth Rate Thickness variation (%) R e lat iv e G ro w th R a te G ro w th R a te V ar ia tio n (% )
Reactor Pressure (Torr)
0,6 0,8 1 1,2 1,4 0 5 10 15 20 25 30 No rm aliz ed G row th Rat e
Distance in the radial direction (mm) P = 30 Torr P = 5 Torr P = 30 Torr P = 5 Torr (b) (a) 0 1 2 3 4 5 6 7 8 0 5 10 15 20 25 30 35 0 10 20 30 40 50 60 70 80 Relative Growth Rate Thickness variation (%) R e lat iv e G ro w th R a te G ro w th R a te V ar ia tio n (% )
Reactor Pressure (Torr)
0,6 0,8 1 1,2 1,4 0 5 10 15 20 25 30 No rm aliz ed G row th Rat e
Distance in the radial direction (mm) P = 30 Torr P = 5 Torr P = 30 Torr P = 5 Torr 0 1 2 3 4 5 6 7 8 0 5 10 15 20 25 30 35 0 10 20 30 40 50 60 70 80 Relative Growth Rate Thickness variation (%) R e lat iv e G ro w th R a te G ro w th R a te V ar ia tio n (% )
Reactor Pressure (Torr)
0 1 2 3 4 5 6 7 8 0 5 10 15 20 25 30 35 0 10 20 30 40 50 60 70 80 Relative Growth Rate Thickness variation (%) R e lat iv e G ro w th R a te G ro w th R a te V ar ia tio n (% )
Reactor Pressure (Torr)
0,6 0,8 1 1,2 1,4 0 5 10 15 20 25 30 No rm aliz ed G row th Rat e
Distance in the radial direction (mm) P = 30 Torr P = 5 Torr P = 30 Torr P = 5 Torr 0,6 0,8 1 1,2 1,4 0 5 10 15 20 25 30 No rm aliz ed G row th Rat e
Distance in the radial direction (mm) P = 30 Torr P = 5 Torr P = 30 Torr P = 5 Torr (b) (a)
Figure 11. ~a! Relative growth rate and growth rate variation as a function of re-actor pressure. ~b! Normalized growth rate profile at different values of reactor pres-sure, P ~in steps of 5 Torr!.
0,4 0,6 0,8 1,0 1,2 1,4 1,6 0 5 10 15 20 25 30 Norm ali zed Gro w th Rat e
Distance in the radial direction (mm) Fd= 505 sccm Fd= 105 sccm 0 0,5 1 1,5 2 2,5 3 3,5 4 0 100 200 300 400 500 600 0 10 20 30 40 50 60 Relative Growth Rate Thickness variation (%) Relat iv e G ro w th Rat e Grow th Rat e V a riat ion (%)
Dilution gas flow rate (sccm)
(a) (b) 0,4 0,6 0,8 1,0 1,2 1,4 1,6 0 5 10 15 20 25 30 Norm ali zed Gro w th Rat e
Distance in the radial direction (mm) Fd= 505 sccm Fd= 105 sccm 0 0,5 1 1,5 2 2,5 3 3,5 4 0 100 200 300 400 500 600 0 10 20 30 40 50 60 Relative Growth Rate Thickness variation (%) Relat iv e G ro w th Rat e Grow th Rat e V a riat ion (%)
Dilution gas flow rate (sccm)
0,4 0,6 0,8 1,0 1,2 1,4 1,6 0 5 10 15 20 25 30 Norm ali zed Gro w th Rat e
Distance in the radial direction (mm) Fd= 505 sccm Fd= 105 sccm 0,4 0,6 0,8 1,0 1,2 1,4 1,6 0 5 10 15 20 25 30 Norm ali zed Gro w th Rat e
Distance in the radial direction (mm) Fd= 505 sccm Fd= 105 sccm 0 0,5 1 1,5 2 2,5 3 3,5 4 0 100 200 300 400 500 600 0 10 20 30 40 50 60 Relative Growth Rate Thickness variation (%) Relat iv e G ro w th Rat e Grow th Rat e V a riat ion (%)
Dilution gas flow rate (sccm)
0 0,5 1 1,5 2 2,5 3 3,5 4 0 100 200 300 400 500 600 0 10 20 30 40 50 60 Relative Growth Rate Thickness variation (%) Relat iv e G ro w th Rat e Grow th Rat e V a riat ion (%)
Dilution gas flow rate (sccm)
(a) (b)
Figure 12. ~a! Relative growth rate and growth rate variation as a function of di-lution gas flow rate. ~b! Normalized growth rate profile at different values of dilution gas flow rate, Fd ~in steps of
100 sccm!.
rs density of deposited ~solid! material, kg m−3
s surface stoichiometric coefficient f generalized variable f, various v gas species mass fraction Subscripts
i with respect to ith gas species in at the inlet of the reactor
m with respect to the mth surface reaction max maximum value
min minimum value
k with respect to the kth gas reaction s at the substrate surface
w at the wall of the reactor x in the x-direction y in the y-direction z in the z-direction f with respect to variable f Superscripts
C due to concentration gradient T due to temperature gradients
References
1. J.-M. Dubois, Useful Quasicrystals, World Scientific, Singapore ~2005!. 2. E. Huttunen-Saarivitra, J. Alloys Compd., 363, 150 ~2004!.
3. D. I. Fotiadis, S. Kieda, and K. F. Jensen, J. Cryst. Growth, 102, 441 ~1990!. 4. M. L. Hitchman and K. F. Jensen, Chemical Vapor Deposition: Principles and
Applications, Academic, London ~1993!. 5. C. R. Kleijn, Thin Solid Films, 365, 294 ~2000!.
6. S. Mazumder and S. A. Lowry, J. Cryst. Growth, 224, 165 ~2001!.
7. C. E. C. Dam, A. P. Crzegorczyk, P. R. Hageman, R. Dorsman, C. R. Kleijn, and P. K. Larsen, J. Cryst. Growth, 271, 192 ~2004!.
8. T. C. Xenidou, A. G. Boudouvis, D. M. Tsamakis, and N. C. Markatos, J.
Electro-chem. Soc., 151, C757 ~2004!.
9. L. Kadinski, V. Merai, A. Palekh, H. Ramer, E. A. Armour, R. Stall, A. Gurary, A. Galyukov, and Y. Marakov, J. Cryst. Growth, 261, 175 ~2004!.
10. T. C. Xenidou, A. G. Boudouvis, N. C. Markatos, D. Samélor, F. Senocq, N. PrudHomme, and C. Vahlas, Surf. Coat. Technol., 201, 8868 ~2007!.
11. M. G. Simmonds, W. L. Gladfelter, R. Nagaraja, W. W. Szymanski, K.-H. Ahn, and P. H. McMurry, J. Vac. Sci. Technol. A, 9, 2782 ~1991!.
12. J. Han, K. F. Jensen, Y. Senzaki, and W. L. Gladfelter, Appl. Phys. Lett., 64, 425 ~1994!.
13. X. Li, B.-Y. Kim, and S.-W. Rhee, Appl. Phys. Lett., 67, 3426 ~1995!. 14. B.-Y. Kim, X. Li, and S.-W. Rhee, Appl. Phys. Lett., 68, 3567 ~1996!. 15. J.-H. Yun and S.-W. Rhee, J. Mater. Sci.: Mater. Electron., 9, 1 ~1998!. 16. J.-H. Yun, M.-Y. Park, and S.-W. Rhee, J. Vac. Sci. Technol. A, 16, 419 ~1998!. 17. J.-H. Yun, B.-Y. Kim, and S.-W. Rhee, Thin Solid Films, 312, 259 ~1998!. 18. T. W. Jang, W. Moon, J. T. Baek, and B. T. Ahn, Thin Solid Films, 333, 137
~1998!.
19. Y. Neo, M. Miwano, H. Mimura, and K. Yokko, Appl. Surf. Sci., 142, 443 ~1999!. 20. M. Delmas, D. Poquillon, Y. Kihn, and C. Vahlas, Surf. Coat. Technol., 200, 1413
~2005!.
21. M. Delmas and C. Vahlas, J. Electrochem. Soc., 154, D538 ~2007!. 22. CHAM Ltd., PHOENICS software, London ~2008!.
23. N. C. Markatos, Rev. Inst. Fr. Pet., 48, 631 ~1993!.
24. T. Nakajima, M. Nakatomi, and K. Yamashita, Mol. Phys., 101, 267 ~2003!. 25. H. Matsuhashi, C.-H. Lee, T. Nishimura, K. Masu, and K. Tsubouchi, Mater. Sci.
Semicond. Process., 2, 303 ~1999!.
26. J. W. Turley and H. W. Rinn, Inorg. Chem., 8, 18 ~1969!. 27. G. Wahl, Thin Solid Films, 40, 13 ~1977!.
28. K. F. Jensen and D. B. Graves, J. Electrochem. Soc., 130, 1950 ~1983!. 29. M. E. Coltrin, R. J. Kee, and J. Miller, J. Electrochem. Soc., 131, 425 ~1984!. 30. G. Evans and R. Greif, J. Heat Transfer, 109, 928 ~1987!.
31. H. K. Moffat and K. F. Jensen, J. Electrochem. Soc., 135, 459 ~1988!. 32. C. R. Kleijn and C. J. Hoogendoorn, Chem. Eng. Sci., 46, 321 ~1991!. 33. H. Habuka, T. Nagoya, M. Katyama, M. Shimada, and K. Okuyama, J.
Electro-chem. Soc., 142, 4272 ~1995!.
34. M. E. Coltrin, R. J. Kee, and G. H. Evans, J. Electrochem. Soc., 136, 819 ~1989!. 35. M. D. Allendorf and R. J. Kee, J. Electrochem. Soc., 138, 841 ~1991!. 36. R. Arora and R. Pollard, J. Electrochem. Soc., 138, 1523 ~1991!. 37. I. Lengyel and K. F. Jensen, Thin Solid Films, 365, 231 ~2000!.
38. K. J. Kuijlaars, C. R. Kleijn, and H. E. A. van den Akker, Solid-State Electron., 42, A43 ~1998!.
39. S. Kommu, G. M. Wilson, and B. Khomami, J. Electrochem. Soc., 147, 1538 ~2000!.
40. M. Grujicic, G. Cao, and B. Gersten, Appl. Surf. Sci., 199, 90 ~2002!. 41. W. T. Cheng, H. C. Li, and C. N. Huang, Chem. Eng. J., 137, 603 ~2008!. 42. R. P. Parikh and R. A. Adomaitis, J. Cryst. Growth, 286, 259 ~2006!. 43. T. C. Xenidou, N. Prud’homme, L. Aloui, C. Vahlas, N. C. Markatos, and A. G.
Boudouvis, ECS Trans., 25~8!, 1053 ~2009!.
44. C. R. Kleijn, in Computational Modeling in Semiconductor Processing, M. Meyyappan, Editor, p. 97, Artech House, Boston, MA ~1995!.
45. O. Hirschfelder, C. F. Curtiss, and R. B. Bird, Molecular Theory of Gases and
Liquids, John Wiley & Sons, New York ~1967!.
46. T. C. Xenidou, M. K. Koukou, A. G. Boudouvis, and N. C. Markatos, J. Phys. IV,
11, Pr3183 ~2001!.
47. W.-S. Choi, J.-M. Ahn, J.-H. Bae, S.-K. Suh, J.-H. Yun, and S.-W. Rhee, in
Thir-teenth International Conference on Chemical Vapor Deposition (CVD XIII), T. M. Besmann, McD. Robinson, R. K. Ulrich, M. D. Allendorf, M. L. Hitchman, and H. Komiyama, Editors, PV 96-5, p. 131, The Electrochemical Society Proceedings Series, Pennington, NJ ~1996!.
48. J. I. Ulacia, S. Howell, H. Korner, and Ch. Werner, Appl. Surf. Sci., 38, 370 ~1989!.
49. C. R. Kleijn, C. J. Hoongendoorn, A. Hasper, J. Holleman, and J. Middelhoek, J.
Electrochem. Soc., 138, 509 ~1991!.
50. S. V. Patankar, Numerical Heat Transfer and Fluid Flow, Taylor & Francis, Lon-don ~1980!.