Publisher’s version / Version de l'éditeur:
Lighting Research and Technology, 20, 4, pp. 139-153, 1988
READ THESE TERMS AND CONDITIONS CAREFULLY BEFORE USING THIS WEBSITE. https://nrc-publications.canada.ca/eng/copyright
Vous avez des questions? Nous pouvons vous aider. Pour communiquer directement avec un auteur, consultez la
première page de la revue dans laquelle son article a été publié afin de trouver ses coordonnées. Si vous n’arrivez pas à les repérer, communiquez avec nous à [email protected].
Questions? Contact the NRC Publications Archive team at
[email protected]. If you wish to email the authors directly, please see the first page of the publication for their contact information.
NRC Publications Archive
Archives des publications du CNRC
This publication could be one of several versions: author’s original, accepted manuscript or the publisher’s version. / La version de cette publication peut être l’une des suivantes : la version prépublication de l’auteur, la version acceptée du manuscrit ou la version de l’éditeur.
Access and use of this website and the material on it are subject to the Terms and Conditions set forth at
Visual performance using reaction times
Rea, M. S.; Ouellette, M. J.
https://publications-cnrc.canada.ca/fra/droits
L’accès à ce site Web et l’utilisation de son contenu sont assujettis aux conditions présentées dans le site LISEZ CES CONDITIONS ATTENTIVEMENT AVANT D’UTILISER CE SITE WEB.
NRC Publications Record / Notice d'Archives des publications de CNRC:
https://nrc-publications.canada.ca/eng/view/object/?id=7b629e54-7850-4cf2-b635-d4bd81f57a48 https://publications-cnrc.canada.ca/fra/voir/objet/?id=7b629e54-7850-4cf2-b635-d4bd81f57a48e r
H I
National Research
ConseSI national
N 2 1 d
I
*I
Council Canada
de recherche. Canada
1 7
1 8
Institute for
lnstitut de
Research in
recherche en
Construction
construction
1
Visual Performance Using
Reaction Times
by M.S. Rea and M.J. Ouellette
A N A L Y Z E D
Reprinted from
Lighting Research and Technology
Vol. 20, No. 4, 1988
p. 139-1 53
(IRC Paper No. 1718)
NRCC 33104
NRC * C13nI R C
1-
L I B R A R Y
, r e e I r ~ v -I L ? !
BIBLEL,
+. * & B U E
I E i
C
CHTC-
r'x'r
7 4Lighting Res. Technol. 20(4) 139-153 (1988) Printed in Great Britain
summa^^ Visual perfonnance has been a topic of study for many years. For a variety of reasons, it has been difficult to develop a completely satisfactory model of visual performance. Recently the connection has been made between reaction time experiments and realistic studies of visual performance. In this repon an extensive set of reaction time data are presented which were collected over a large range of stimulus conditions relevant to interior and exterior lighting applications. An empirical model of visual performance was developed from rhese data. It forms the next logical step in the development of an application tool for lighting practitioners.
I
Visual performance using reaction times
MARK S
REA
PhD and MICHAEL J OUELLETTE BScNational Research Council Canada, Institute for Research in Construction, Ottawa, Ontario, Canada KIA OR6 Received 1 July 1988, in final form 20 September 1988t
1 Introduction
Although visual &rformance can have several definitions, it is conventionally defined by the lighting research community as the speed and accuracy of performing a visual task('). Speed and accuracy are useful measures of performance and are directly related to productivity. Task performance is more complex than visual perfonnance, however, since it involves motor and cognitive factors as well as visual ones. These factors are also important to productivity. Never- theless, a person's ability to perform a task requiring sight will be limited if the quality of the visual conditions is poor. The productivity of a typist, for example, will not be satisfactory if the text has insufficient contrast or if its size is small, or if there is inadequate illumination on the document. But what exactly is sufficient text contrast and size? How much illumination is required for satisfactory visual perfonnance?
There have been a number of attempts to answer these important questions over the past half-century. For a variety of reasons outlined by Rea(2,3), earlier attempts have had limited success. For example, Weston's early studie~'~.~) using a simulated realistic task followed the correct philo- sophical path, but the experimental and analytical techniques were poorly defined and, perhaps, poorly executed.(2) Cer- tainly Weston had difficulty in replicating his own results using nominally equivalent procedures. Rea(6) has followed the philosophy of Weston and extended the work on visual performance by incorporating more experimental control and more modern analytical and statistical procedures. The numerical verification task, first used by Smith and Rea") and later by others("lO) has served as a useful simulated realistic task for assessing visual performance. Nevertheless, special experimental and analytical p r o c e d ~ r e s ( ~ ~ ~ 1 ~ ) are required to extract visual performance unambiguously from task performance using the numerical verification task. This is true, of course, for any task, but simulated realistic tasks are particularly difficult in this regard. Reaction times have been used in many areas of perception and psychology to characterise various stages of human infor- mation processing("J2). Boyce and Rea(13) and Rea et al(14' have shown that reaction times can beused to quantify visual performance and, because they have proportionally smaller non-visual contributions to the observed response, there are t The paper is a revised version of one presented to the 1988 National Lighting Conference, Cambridge, UK.
fewer complications in assessing visual performance using reaction times than with more complex simulated realistic tasks. Further, Rea@) showed that errors (misses and false- positives) and response times followed very similar, if not identical, functions of target contrast. Similarly, Rea@) showed that his visual performance model based on speed@) could predict the visual performance data by McNelis based on ac~uracy~'~). Therefore, a set of equations for visual performance based upon reaction times is appropriate for predicting visual performance at realistic tasks in terms of both speed and accuracy.
This report extends the previous efforts to model visual performance by presenting data on reaction times for detect- ing square targets of different contrqt, contrast polarity and area over a large range of adaptation luminances. Empirical functions describing the data are presented. These functions can be used to predict visual performance throughout a large range of stimulus conditions typically found in indoor and outdoor environments. Although not discussed here, pro- cedures have been developed for applying these findings to lighting pra~tice('"'~).
2 Methods 2.1 General
Two experiments were conducted, one measuring reaction times to targets darker than the background (decrements) and the other measuring reaction times to targets brighter than the background (increments). In total, 9 subjects, 5 males and 4 females, participated in one or both of the experiments. Every subject was examined for visual defects using a Keystone Ophthalmic Telebinocular and employed in the experiment only if the visual acuity of the left eye was assessed normal or better without optical correction or with a contact lens.
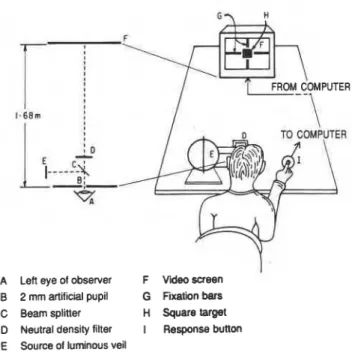
Targets were generated on a video screen (Sony,
PVM
1910) 1.68 m from the subject's eye. Figure 1 is a schematic diagram of the apparatus. The screen subtends a visual field 12" wide and 7" high. Every subject viewed the stimulus display with the left eye through a 2 mm diameter artificial pupil, and, depending upon the experimental conditions, a neutral density filter and luminous veil. An opaque patch covered the right eye during the experiment.On a typical trial a target was displayed on the screen after a brief, random time delay, and the subject pressed a @ 1988 The Chartered Institution of Building Services Engineers 139
M S Rea and M J Ouellette
A Left eye of observer F Video screen
I
B 2 mm artificial pupil G Fixation bars C Beam splitter H Square target D Neutral density filter I Response button E Source of luminous veilF i1 Schematic diagram of reaction time apparatus
response button as soon as it was detected; a maximum of 3 s was allowed for response. The time between target onset .and response was recorded as the reaction time for that trial. Except for setting the adaptation luminances, the two experiments were completely controlled by an IBM PCIXT computer.
Stemming from the conventional definition of contrast C =
I
Lb-
L, 1 lLb, where L, is the target luminance and Lb is the luminance of its background, and taking into account the transmittance (T) of the neutral density filter and the luminance of the veil (L,):C =
I
(TLb+
Lv) - (TL, + L")I
TL,
+
L, (la)where La is the adaptation luminance (cdm-'), equal to TL,
+
L,.To determine L, and L,, eight bit pixel intensity values (i.e. 256 steps in luminance) generated by the computer in a 3" field at the centre of the screen were calibrated for luminance using a Minolta Photometer (Model nt- lo). Thus the lumi- nances of targets smaller than the photometer's one-degree measuring field could be determined. The veiling luminance L, was produced with a beam-splitter just forward of the artificial pupil which reflected light from an integrating sphere (a Photo Research, Spectra luminance standard).
t
The luminous non-uniformity of the screen was assumed unimportant for defining the adaptation luminance. Of course, the non-uniformity bcompletely irrelevant for defining target size. It is also irrelevant to defining target contrast, since contrast is dependent upon the ratio of luminances. Any spatially dependent luminance variations in the display cancel in Equation 1.
$ There was greater measurement uncertainty for the small targets due to phosphor interactions at pixel target borders. More specifically, the targets may have been effectively smaller than the values presented here.
Values of L,, reflected from the beam splitter, were also determined with the Minolta photometer, and a close-up lens, focused at the exit port of the integrating sphere. Filter (Schott optical glass) transmission values (2') were determined, using the Minolta photometer, from luminance measurements of the computer screen, with and without a filter in the optical path.
2.2 Decrement experiment
Seven subjects, 3 males and 4 females, between the ages of 17 and 31 years of age (median = 21) participated in the decrement experiment.
The luminance at the centre of the screen was set at 100 cd m-2. There was a gradual reduction in luminances toward the edge of the screen; luminances in the target presentation area near the centre of the screen varied from 83 to 105 cd m-2t. Eight luminances were created in com- bination with the neutral density filters and/or the veiling light (Table 1). Subjects were dark adapted for at least 5 min before starting the experiment.
For every reaction time trial, the computer randomly selected and generated a square target in the c a m e of four fiwation bars (Figure 1). Targets were of eight possible sizes (see Table 7 in Appendix A for target sizes in various units)$
and of either 18 or 20 possible contrasts. Every subject was presented every target at every adaptation luminance approximately 14 times. Contrast values (equation 1) ranged from near threshold to a possible maximum of 0.99. Although as many as 20 contrasts were employed at each adaptation luminance, the range of apparent contrasts, as seen by the subject, was reduced whenever a veiling light was employed; the greater the veiling luminance (Table 1) the more limited the range of apparent contrasts for the targets.
The onset of the target followed presentation of fixation bars and a subsequent, random time delay between 1 and 3 s.
Subjects knew that, on occasion, no target would bt
presented, This procedure was intended ro k t false- positive responses; in fact, the average false-positive rate was 3.5% for these experiments. An inter-trial interval of 1.5 s followed the subject's response to the target. Reaction times were recorded in blocks of 25 trials; a subject initiated each new block at his discretion once the adaptation luminance had been established by the experimenter.
Two horizontal and two vertical fixation bars 0.25" wide extended from the edges of the monitor screen toward the
-.
. -
Table 1 Adaptation luminances L, and retinal illuminances I , in the decrement experiment, produced by various combinations of a veiling luminance L, and a neutral lilter placed between the subject and the computer monitor. The maximum contrast values at every adaptation luminance are also tabluated.
- -
L, IR(T) Filter L. Maximum
M S Rea and
M
J Ouellette29.0 Trolands
801
Trolands
CONTRAST
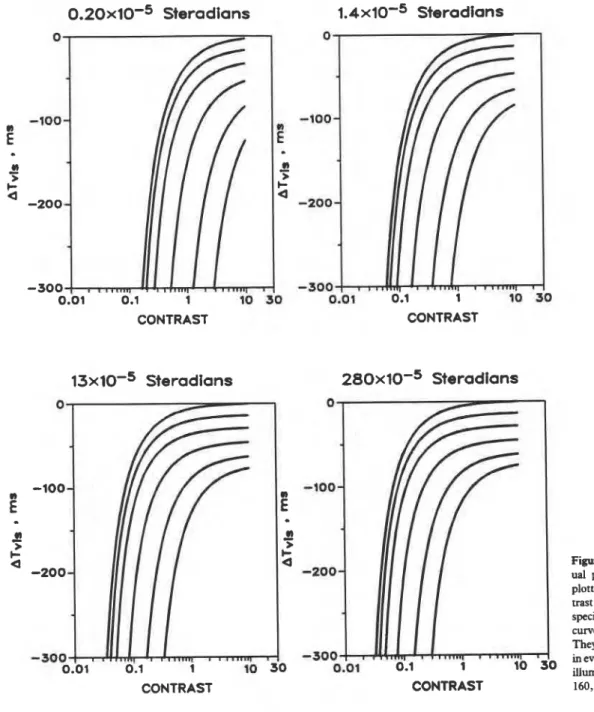
Just above threshold contrast, reaction times decrease very rapidly as target contrast increases until a saturation region is reached where still higher target contrasts have little effect. This pattern is particularly evident for large targets and is similar at every level of retinal illuminance used (Figure 2). Reaction times to small targets are typically longer than they are to large targets at the same retinal illuminance. Although less apparent from Figure 2, retinal illuminance more strongly affects the pattern of reaction times for small targets
than for large targets.
CONTRAST
F i4 Reaction times from subject 6 to W e d luminous innemmtr.
Presented are mean reaction times as a function of target contrast for targets of area 13 x lo-' steradians (circles) and 280 x lo-' steradians (squarrs) at retinal illuminances of 29.0 T (solid symbols) and 314 T (open symbols).
CONTRAST
F i 3 Mean percentage probability-of-detection data for three contrast decrement target areas (0.20, 0.56, 280 x lo-' ster- adians) plotted as a function of log,& (equation 1) when presented at retinal illuminances of 29.0 and 801 T. A straight line (see text) was
fined by eye to aN of the pro- bability-of-detection data in the decrement experiment.
It is perhaps useful to note three differences in the response patterns for small and large targets under different retinal illuminances. First, higher contrasts are required for small targets to reach threshold than for large targets at a given retinal illuminance. Further, as retinal illuminance increases contrast threshold decreases for all target sizes, but the rate of reduction is faster for small targets than it is for large targets (Figure 3). Second, as target contrast increases just above threshold, reaction times decrease rapidly, but at a slower rate for small targets
than
for large targets at a givenretinal illuminance. As retinal illuminance increases, this
initial
slope for the reaction times becomes steeper more quickly for small targets than for large targets. In fact, theinitial
slope changes very Little with retinal illuminance for large targets. Third, although reaction times typically satu- rate with increasing contrast, they will not saturate as quickly for small targets as for large targets at a given adaptation luminance. Throughout the range of retinal illuminances used in this experiment, reaction times to large targets always saturated; only at high adaptation luminances did reaction times to small targets saturate.3.2 Increment experiment
Figure 4 shows reaction times, again, for subject 6 who was typical of the 'average' subject. The mean reaction times for the largest (13 x lo-' steradians) and smallest (0.20 x lo-' steradians) targets are shown for various contrasts under the
highest (51.5 T ) and lowest (0.53 T ) retinal illuminances. As with the decrement experiment, there is a rapid reduction in reaction times as contrast increases above threshold. Simi- larly too, increasing target size and retinal illuminance reduces reaction times and the functions become more 'step Like' in appearance. It should be noted, however, that for the smallest targets and the lowest adaptation luminances, the data do not reach an apparent level of saturation. The changes in the patterns of reaction times are more pro- nounced here
than
they are in the decrement experiment because, in the increment experiment, small targets were presented at a lower range of retinal illuminances.M
S Rea andM
J Ouellette1 I
.
r . u n - . . l.
n r . . . w q ~....?
4.2 Suprathreshold responseFollowing the formulation by Rea@) and Rea et al(14) and using the estimates of contrast threshold C, from Equation 2, Equation 3 can be used to establish a functional relationship between reaction times and target contrasts for a given target area and retinal illuminance. Since visual performance is generally taken as increasing with stimulus strength, it is appropriate to use the reciprocal of reaction times to describe performance. Consequently, Equation 3 employs R, the reciprocal of the average reaction time RT, as the dependent
variable.
-
R = [ACn/(ACn
+
Kn)]R, (3)V where R is the performance (ms-') = ~ / R T ; RT = mean
2.42 ' reaction time (ms); AC = C
-
C,; C is the contrast of the4.93
-
target of a given area and at a given retinal illuminance (equation 1); C, is the contrast threshold (equation 2) for a given target area and retinal illuminance;K
is the value of 51.2 AC corresponding to half-of-maximum response for a given retinal illuminance and target area, that is, a dimensionless free parameter affecting the shape of the response function; n is a dimension free parameter, also affecting the shape of0.01 1
0.00001 0.0001 0.001 0'01 the response function; R, is the maximum possible
response for a given retinal illuminance; a free parameter.
TARGET AREA, STERADIANS
Data from both experiments were combined into a set of seventy-nine 'average' reaction times (64 sets for the dec-
Figurr 7 Contrast threshold C, plotted as a function of target area, in rement experiment plus 15 for the increment experiment). s t e r a h s , for the Increment (open symbols) and decrement (closed Each 'average' reaction time was weighted by the number
symbols) experiment. Presented are averaged data for five selected r e d Of trialS to that mean. ~ ~non-linear ~ ~ ~ ~ ~ - ~ i ~ ~ ih-ces (0.53 to 801 T). The lines are the predicted curves for regression calculations employing equation 3 produced sev-
these retinal illurmnances from equation 2.
enty-nine values of R,, n, and K. Thus, there were esti- mates of these three parameters for every combination of target area and retinal illuminance used in the two experi- I
ments (Avwndix A). I
Figures 6 and 7 show two perspectives of this contrast
threshold surface together with some of the data. Table 4 of Appendix A clearly shows that K varied with target area and retinal illuminance. It was not so clear from logl0C, = -1.36
-
0.179A-
0.813L+
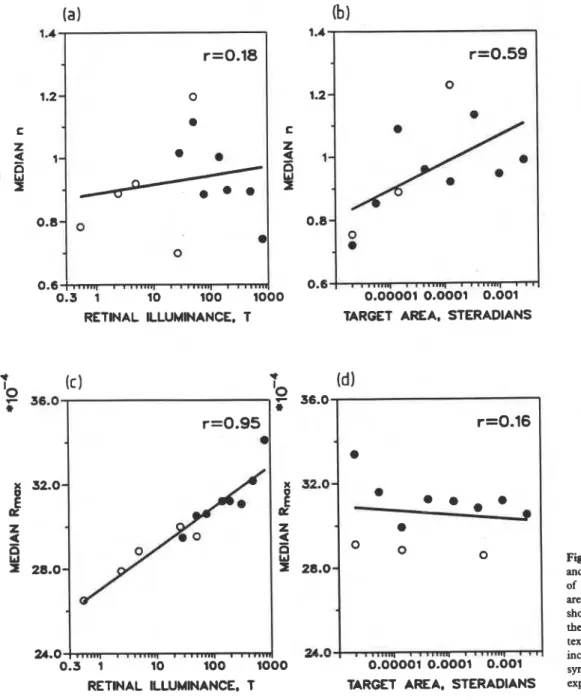
0.226A2 Tables 3 and 5 whether n and R, followed any consistent I-
0.0772L2+
0.169AL (2) trends with these two independent variables. Figure 14shows the median estimates of n and R, from the non- where Ct is contrast threshold; A = log10 (tanh 20000~); 61 linear regressions (equation 3) for each level of retinal illu- is the area of the target, in steradians, from 0.20 to minance and target area.
280 x 1W5; L = loglo (log,, (10 ZR/n)); ZR is the retinal
illuminance, in
(T)
= La n 12; r is the pupil radius (-) = Based upon these plots and simple correlation calculations, 1 -; La is the adaptation hlrninance in cd m-2 from 0.17 it was inferred that the parameter n does not vary as ato 255. function of retinal illuminance (Figure 14(a)) nor of target
area (Figure 14(b)). Thus, a constant value of 0.97 based Figure 6 shows a consistent drop in contrast threshold with upon the average value in Table was assumed for retinal illuminance for all target areas, although the rate of (although a value of 1.0 would probably serve as well and reduction is greater at the lower retinal illumi- thus simplify equation 3).
nances and for the smaller target areas. These trends are
consistent with countless studies of contrast threshold (e.g. There was a sigdicant relationship, however, between
Reference 19). and retinal illuminance, given the high correlation between
them shown in Figure 14(c), but there is no obvious relation-
Figure the between threshold ship between R, and target area. Thus R, was considered
and target area. There is an obvious reduction in contrast independent of target area, but it was assumed to increase threshold up to a target area of about 13 x steradians; linearly with retinal illuminance according to equation 4: after that, threshold did not change much, if at all, with
target area. Savoy and M ~ C a n n ' ~ ~ ) and Hoekstra et ~ 1 ' ~ ~ ' R, = 0.000196 log,JR
+
0.00270 (4) showed that contrast thresholds for low spatial frequencieswhere is in equation 2.
do not vary as long as the number of cycles presented is the
same. In this experiment, flashed squares of different sizes Since the three parameters in equation 3 are not completely may be considered as half-cycle targets of different spatial independent, changes to the values of n and R, might affect frequencies. Thus, the number of cycles for targets of dif- the values of K. Therefore estimates of K were obtained again ferent sizes was always the same. By this interpretation, and using the non-linear regression routine, but now assuming in agreement with these earlier studies, these results show that n = 0.97 and R, increased with log,dR according to that half-cycle targets larger than 0.77 cycles per degree equation 4. The seventy-nine new estimates of K are given
0.01
0.3 1 l0 100 lo00
RE1 INAL ILLUMINANCE, T
Figure 8 K plotted as a function of retinal illuminance (T) for the increment (open symbols) and decrement (closed symbols) experiment. Presented are the averaged data for target areas of 0.20, 1.4 and 13 x
steradians, which were common to both experiments. The solid lines are predicted curves for the target areas from equation 5.
Visual perfmance using reaction times
Employing essentially the same procedures used to estimate the contrast threshold surface, it was possible to determine a surface for the new estimates of K in Table 6. Equation 5 describes the three-dimensional regression surface for K as a function of retinal illuminance and target area; over 99% of the variance in the K values was explained by equation 5. It should be noted that this function differs slightly from equation 2 because the K values did not continue to decrease with retinal illuminance as had the contrast threshold values. Figures 8 and 9 show different perspectives of the K surface.
where K is the half saturation parameter (from equation 3 and Table 6 of Appendix A); A * = log,, tanh (5000~); w is the target area (steradians) from 0.20 x to 280 x L* = log,, tanh (0.04 1,lx); I, is the retinal illuminance from Equation 2.
Using equations 2 to 5 it is possible to describe all reaction time data from threshold to saturation for the complete range of target contrasts and sizes and retinal illuminances used in the two experiments. Figures 10 and 11 show some data '
with the comparable predictions generated from the model given by equations 2 to 5. Although all data and the pre- dictions are not shown, Figures 10 and 11 adequately rep- resent the level of predictive accuracy possible. Appendix B compares the predictive accuracy of equations 2 to 5 with that obtained from the seventy-nine independent regressions which lead to the parameter estimates in Tables 3 to 5 (i.e. using just equations 2 and 3). In general, little accuracy is lost by simply using equations 2 to 5, rather than all seventy- nine independent regression equations.
0.01 then
0.00001 0.0001 0.001 0.01 ATYIS = RTrcf
-
RT4.3 Visuul response
The reaction time data modelled by equations 2 to 5 are not based upon visual response alone. Although probably small, there are both motor and cognitive response times con- tributing to the reaction times. To model visual performance it is necessary to eliminate these non-visual response times from the data. Rea et al(14) assumed that the non-visual contributions to the reaction time data are, on average, constant. If this assumption is true, then the differences in visual response times, ATGs, produced by changes in stimu- lus parameters in this experiment can be determined by subtracting a constant value, equal to the fastest estimated reaction time, RT,~, from each value of RT. By this operation, the non-visual components cancel and the remainder is assumed to be simply the difference in visual response time caused by a change in the stimulus parameters. Therefore,
if -
RT = Tvis
+
Tnon-vis (6)where RT is reaction time (ms); T,, is the visual component of RT (ms); Tn,-,, is the non-visual component of RT (ms)
TARGET AREA. STERADIANS
where AT,, is the incremental visual response time needed to
Figure 9 K ploned as a function of target area (in steradians) for the process a s-ulus relative to that under reference conditions. increment (open symbols) and decrement (closed symbols and asurisks) R T ~ f i s the reference reaction time for this experiment, experiments. Presented are data for xlecIed retinal illuminances (0.53 to is the shortest estimated reaction time derived from equation
801 T). The solid lines are the predicted curves for these retinal illuminances 3 for a retinal ihminance of 801 T and a target size of from equation 5. 280 x steradians with n = 0.97 and R , following
M
S
Rea and M J Ouellettem 29.0 Trolands n 51.2 Trolands
CONTRAST CONTRAST
? 198 Trolands
!'
801 TrolandsCONTRAST CONTRAST
equation 4, = 305 ms, thus, following equation 3,
AT,, = R T d - (ACn
+
Kn)l(ACn R,) (8) Figures 12 and 13 show predictions from the visual per- formance model as defined by equation 8. The model pre- dicts visual performance at a wide range of retinal illuminances, target sizes and contrasts, both luminous dec- rements and increments. It should be noted that this model predicts differences in visual processing time (AT,= in ms), not relative visual performance (RVP) as in Rea(9). A sub- sequent publication will discuss the differences in the two measures of visual performance.Figure 10 Values of R, the
inverse of reaction time, from the
decrement experiment and averaged over all subjects. The curves were calculated using equations 2 to 5, and are labelled in terms of target area, in steradians x lo5. Retinal
3 illuminance values are specified above each panel.
between seeing and not seeing a target on a luminous back- ground as a function of target area and retinal illuminance. As noted earlier, estimates of this surface have been obtained using a variety of psychophysical techniques (e.g. Reference 24), but there is an artefact in some of the estimates. Only when an equal number of spatial cycles are presented can the relative visual sensitivity to different target areas be correctly d e t e r m i r ~ e d ( ~ ~ > ~ ~ ) . In the present experiments only spatial half-cycles were presented and, indeed, contrast threshold was the same for square targets larger than 0.65" on a side (13 x lo-' steradians) or 0.77 cycles per degree, confirming and slightly extending the literature in the area of contrast threshold.
5 Discussion Equation 5 describes the K surface for reaction times as a
function of target area and retinal illuminance. Values of K, Threshold and suprathreshold visual performance can be like C,, are based upon a constant criterion response. In this described by a few equations. Equation 2 describes the case the response criterion is half of the maximum possible contrast threshold (C,) surfaces, that is, the break point reaction time response R, for that adaptation level. To the
Visual p e r f m n c e using reaction times 0.53 Trolands n Z) 0 0.20 3.0 2.42 Trolands CONTRAST CONTRAST n 4.93 Trolands n 26.3 Trolands CONTRAST CONTRAST
authors' knowledge, estimates of this surface have never
been reported previously.
Figures 12 and 13 show Merent slices through the visual performance model defined by equation 8. These are views of the 'pure' visual response. The trends are also consistent with other published estimates of visual performance(") but go beyond them by describing visual performance over a wide range of stimulus conditions.
In general, visual performance improves with target area, target contrast and adaptation luminance. For many com- binations of the three model parameters, however, visual performance changes very little and, under these conditions, defines the visual performance plateau and escarpment described by Boyce and Rea''). The escarpment is more pronounced and the plateau flatter and larger at the higher adaptation luminances and for the larger target sizes. For many applications the stimulus conditions will be found on this plateau, but, no doubt, under certain circumstances
F i 11 Values of R, the inverse of reaction time, from the
incrcmmt experiment and averaged
over all subjects. The curves were calculated using equations 2 to 5, and are labelled in terms of target area, in steradians x 10'. Retinal
'
illuminance values are speci6ed above each panel.this will not be the case. For example, under some low illumination levels it may be impossible to read small text. It should also be emphasised that the plateau is not perfectly flat, but falls off gradually to the escarpment. Even small reductions in visual performance on the plateau may have large economic sigdicance if they result in productivity decline. For tasks requiring a large amount of visual pro- cessing (e.g. inspection of manufactured products) even slightly reduced illumination levels, task contrast or size may be very expensive. In any event, these equations allow, for the first time, precise estimates of visual performance under a wide range of stimulus conditions commonly found in commercial and industrial environments.
6 Conclusions
Three fundamental problems remain in applying these equations, however. First, all data from these two experi- Vol. 20 No. 4 (1988)
M
S Rea andM
J
Ouellette 0.20xl0'~ Steradians 1 . 4 ~ 1 0 ' ~ Steradians CONTRAST 0 -100 -200 -300 0.01 0.1 1 10 30 CONTRAST 13x10'~ Steradlans 280x10-~ Steradians 0 0 -100 -100i
E
.
m-
m >-
I- C >a
-200a
-200 -300 -300 0.01 0.1 1 10 30 0.01 0.1 1 10 3( CONTRAST CONTRASTFigure 12 Relative losses in vis- ual performance time AT,, (ms) plotted as a function of target con- trast for different urger areas specified above each panel. The curves are defined by equation 8. They represent, from right to left in every panel, the following retinal illuminances: 0.63, 1.6, 6.3, 31, 160, and 801 T.
ments come from young adults viewing the stimuli through a 2 rnm a d i c i a l pupil. Since retinal illuminance will depend upon the size of the natural pupil and since pupil size depends upon adaptation luminance as well as the age of the person, it is not possible to predict accurately visual performance using these equations without some estimation of the luminance-dependent and age-dependent pupil size. Further, there is some debate as to wherher the deterioration in visual performance with age (e.g. Reference 8) is depen- dent upon changes to the optical system or to the retina and brain(25'. Unpublished work extending the paper by Wright and Rea in&cates that these age-dependent changes in visual performance are due primarily to optical changes, at least up to age 60 or 65 years. Until these arguments and the age- dependent changes in pupil size are published, however, rhe
algorithm in Appendix C has limited utility for predicting visual performance under real conditions.
Second, the practitioner cannot easily measure the input parameters (luminance, target size, and target contrast) for the various equations. Although beyond the scope of this report, a system has been developed at the National Research Council Canada which will provide practical means of rneas- uring these input parameters for actual tasks('h1'). This system and a set of equations based on this r q o n will allow
practitioners to determine visual performance with' very lircle difficulty in the very near future.
Finally, even with a well defmed theoretical framework for visual performance and practical means of measuring the stimulus conditions, it will still be necessary to assess the relevance of visual performance to the performance of real tasks. Such undersranding goes far beyond the scope of visual sciences and illuminating engineering and into such areas as audition, thermal comfort, ergonomics, motivation,
0.53 Trolands O n 3.14 Trolands
'
1
CONTRAST 31.4 Trolonds CONTRAST 801 TrolondsVisual performance using reactha times
CONTRAST CONTRAST'
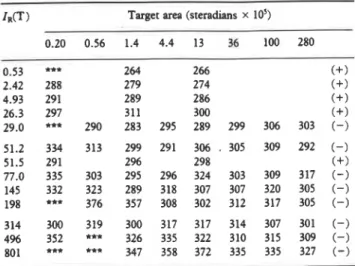
Table 3 Values of the parameter n, collected in both the increment (+)
and decrement (-) experiments, obtaiaed from the seventy-nine t h e - parameter regressions.
I R ~ ) Target area (steradians x loS)
F i13 Relative losses in vis- ual perfonnance time AT, (ms)
plotted as a function of target con- trast for different retinal illumi- nances speci6ed above each panel. The curves are defined by equation 8. They represent, from right to left in every panel, the following
'
target areas: 0.2, 0.5,2.0, 5.0 and 280 x lo-' steradians.fatigue, learning, and aesthetics. Thus, while we may have a robust understanding of the impact of lighting and task conditions on visual performance, accurate assessments of productivity, job satisfaction and absenteeism are still not available. Nevertheless, in the very near future practitioners will be able to precisely measure and calculate the impact of lighting and task conditions on visual perfonnance. This capability should place the lighting practitioner at the fore- front of application engineering.
Appendix A
The regression parameters n, K and R , were obtained from the non-linear regression (equation 3) routine employing the reaction times (averaged over all subjects). These values are summarised in Tables 3 to 5 and Figure 14. For some combinations of retinal illuminance and target area the non- linear regressions provided very large estimates of R , (i.e. the functions did not ,saturate). Since the corresponding estimates of n and K are not independent of this parameter,
M
S Rea andM
J OueUette 0 1.2- 0 1.2-
c a cz
.
z
1
l- 0.8- 0.8-: /
a 0 0 0.6--~m.~ r r r r l m n l m r .m.rqrl.
rl...
0.6 .m.mm..m . . . . r a w . v r . , . . . . ~ n . 1 0.3 1 10 100 1000 0.00001 0.0001 0.001RETINAL ILLUMINANCE. T TARGET AREA, STERADIANS
F i 14 Median values of n
and R , are presented as functions of retinal illuminance or target area. Correlation coefficients, r, are shown inset. Equation 4 describing the line in (c) is presented in the text. Open symbols are from the increment experiment. Closed symbols are from the decrement
RETINAL ILLUMINANCE. T TARGET AREA, STERADIANS experiment.
Table 4 Values of the parameter K collected in both the increment (+) and decrement (-)
experiments, obtained from the seventy-nine, three-parameter regressions.
Visual p e r j i m n c e using reaction rimes
Table 5 Values of the parameter R , collected in both the increment (+)and decrement (-) experiments, obtained from the seventy-nine, three- parameter regressions and reported as R , x 10'
IR(T) Target area (steradians x 10')
Table 7 Sizes, in various units, of the
square targets used in the decrement and increment experiments
--
Degrees Steradians Cycles per
x lo5 degree
Appendix
B
Table 8 presents the mean-square errors (MSES) obtained from the seventy-nine regressions which lead to the estimates of n, K and R , in Tables 3 to 5 of Appendix A. Also presented are the MSES for the same data sets obtained from the predictions generated by equations 2 to 5. The seventy- nine independent regressions are expected to be more accu- rate predictions of the data. Indeed, this is true (except for some cases where the iteration criterion was reached with slightly less variance explained), but the improvements are small in most cases.
The model predictions are poorest and the MSES most dispa-
rate for the smallest sizes or where a veiling luminance was they were excluded from Tables 3 to 5 (*
*
*
). Functionsfor all seventy-nine data sets were obtained, however, and 16
estimates of the mean square errors are presented in Appen-
dix B. 0
z
0
0 2 4 6 8 l0
MEAN SQUARE ERROR
Figwe 15 Distributions of mean square error (multiplied by a factor of 1@) obtained from the independent, non-linear regressions and from the regressions using equations 2 to 5.
El INDEPENDENT REGRESSIONS
I REGRESSIONS FROM EQ.2-5
Table 6 Values of the parameter K collected in both the increment (+) and decrement (-)
experiments. These values were obtained from a one-parameter non-linear regression (equation 3) with n constant at 0.97 and R , varying according to equation 4.
--
I n 0 1 Target area (steradians x 101)
0.20 0.56 1.4 4.4 13 36 100 280
M S Rea and M J Ouellette
Table 8 Mean-square errors (MSES) multiplied by a factor of 108. The = Area of target @teradians) from 2.0 x to 2.8
top enny for each combination of retinal illuminance I R and target area is
the MSE obtained from the independent, non-linear regression exercise; X
the bottom enuy is the mean-square error obtained from the prediction
generated by equations 2 to 5. The MSE values are presented as a frequency logl0C; = -1.36
-
0.179A-
0.813L+
0.226A2 histogram in Figure 15.-
-
WK&L2+
0.169AL0-owa
I ~ f l ) Target area (steradians x lo5) St@ 2: Calculate the half-saturation constant K 0.20 0.56 1.4 4.4 13 36 100 280 A* = log,, tanh (50000)
L* = loglo tanh (o.041R/Z)
0.85 1.3 2.6
0.53 2.6 2.1 2.7 logl0K = -1.76 - 0.175A*- 0.0310L*
2.9 2.1 0.76
+
0.112A*~+
0.171L*'+
O.o622A*L*2.42 3.2 1.9 1.3
Step 3: Calculate maximum response R,
2.0 1.3 0.72
4.93 2.1 1.1 1.2 R , = 8r08l%l0g,~I~
+
0.002702.6 2.2 1.7 O . o o o I q 6
26.3 4.5 2.9 1.8 Step 4: Calculate performonce R and predicted reaction time RT 0.55 1.9 1.0 2.3 1.8 1.8 2.0 1.4 29'0 1.6 2.5 1.2 2.1 1.8 2.2 2.1 1.3 A C = C - C , ~ ~ 0 . 9 7 1.6 2.6 0.73 2.0 2.3 2.8 1.7 1.4 51'2 2.6 2.4 0.80 2.0 2.0 3.9 2.6 2.0 = ~ ~ 0 . 9 7 + ~ 0 . 9 7 R m 2.9 0.82 0.61 R T = 1/R 51'5 3.1 1.2 1.3
1.9 3.0 1.0 3.5 2.8 3.9 2.5 2.8 Step 5: Calculate predicted reaction time RT,~ for a reference
77'0 1.9 3.1 1.4 3.3 2.8 4.5 2.3 2.8 s t i m u ~ u s c ~ ~ t , m I
0.49 1.9 1.7 2.0 3.3 3.6 1.9 2.5
145 1.5 2.1 2.1 1.8 3.0 3.3 1.9 2.3 For A
>
13 x lo-' steradians, IR = 801 T, and C > 1, R T d = 305 mS.1.6 2.0 1.6 3.7 2.6 3.1 3.6 1.9 198 8.8 4.1 3.2 3.7 3.4 2.8 3.4 2.5
step 6: ~ d & t e the change in v i s u a l p e r f m n c e A T ~ s relative
0.88 2.4 1.6 1.8 2.6 1.6 2.9 3.2 to the desm'bd in Step 5.
314 1.1 2.7 2.4 1.7 2.5 1.5 3.4 3.8 1.3 2.8 2 . 2 - 2.8 3.5 2.9 2.1 3.1 ATis = R T d
-
RT 4% 4.8 3.6 2.5 4.0 3.3 2.9 2.3 3.1 1.3 1.5 1.7 1.8 2.9 3.6 3.1 2.5 801 6.4 5.1 2.7 2.4 3.2 3.3 2.9 3.8 Acknowledgementsemployed. Under these conditions it was difficult to see The authors would like to thank the nine subjects who participated in the experiment and MI I Jeffry who designed response saturation clearly in the data and, very likely, the the computer software for
larger disparities are caused by relatively poor estimates of running the experiments. This
the saturation parameter
R
,
.
Since the relatively large USES study was financially supported, in part, by Public Worksare few (Figure 15), the estimations from equations 2 to 5 Canada. The authors are particularly grateful to Mr Ivan (Figures 10 and 11) are probably adequate for describing Pasini who was the Project Manager for the financial assist- the reaction times. ance from Public Works Canada and instrumental in realis- ing the project to completion.
Appendix C
Algorthim for calculating predicted performance R and References
incremental visual performance time A T ~ r from measure- Levy A The role of visual performance in lighting design and ments of retinal illuminance (IR in trolands from 0.53 to specification Public Works Crmada Conf. proc. The of visual 801), stimulus area ( o , in steradians from 2 x to *dme h- inlo ,llurninarion design o r - ,
c
h
2.8 x and contrast (C). (1982)
Step 1: Calculate contrast threshold C, 2 Rea M S 3 Rea M S Lighring Res. Technol. 3. Illum. Eng. Soc. 16 18 128 (1987) 113 (1986)
A = log tanh (20 0 0 0 ~ ) 4 Weston H C The relation beiween illumination and indusnial eficipncy,
1 . The effecr of size of work (London: Industrial Health Research Board L = loglo loglo (10 IR /x) of the Medical Res. Coulrcil and Illumination Res. Committee of the Dept. Scientilic and Industrial ResearchlHis Majesty's Stationery IR = Retinal illuminance from 0.53 to 801 T OtIice) (1935)
= La z r2 5 Weston H C The relation between illumination and visual effinency
-
r = Pupil radius (mm) rhe effect of bnghnters contrast (London: Industrial Health Research
Board of the Medical Res. Council) (1945)
Smith S W and Rea M S Relationships between office task per- formance and ratings of feelings and task evaluations under different light sources and levels Proc. 19th Session of the CIE, Kyoto, Japan (1980)
Rea M S 3. Illum. Eng. Soc. 10 164 (1981)
Slater A I, Perry M J and Crisp V H C The applicability of the CIE visual performance model to lighting design Proc. 20th Session of the
CIE, Amsterdam, Netherlands (1983)
Perry M J, Slater A 1 and Gong-Xia Y Illuminance and uniformity
-
Their effects on the performance of a realistic visual task Proc. Not.Lighting Conf. Noningham, England (1986)
Luce R D Response times (Oxford: Clarendon) (1986)
Welford A T Reaction times (London: Academic) (1980)
Boyce P R and Rea M S Plateau and escarpment: The shape of visual performance Proc. 21st Amual Session CIE, Venice, Italy (1987)
Rea M S, Boyce P R and Ouellene M J Lighting Res. Technol. 19 101 (1987)
Visual performance using reaczion times
15 McNelis J F J . Illum. Eng. Soc. 2 190 (1973)
16 Rea M S and Jeffrey I G CapCdc: A new luminance ad image
analysis system for lighting and vision National Research Council Canada,
Institute for Research in Construction, Publication IR 565 (1988) 17 Kambich D G and Rea M S Lighting Magazine l(3) 16 (1987) 18 Rea M S Archirecrural Lighting l(l1) 30 (1987)
19 Blackwell H R 3. Opt. Soc. A m . 36 624 (1946)
20 Shon A D J . Physwl. 185 646 (1%6)
21 Hecht S, Peskin J C and Patt M J . Gen. Pbsiol22 7 (1938) 22 Savoy R L and McCann J J J . Opt. Soc. A m . 65 343 (1975) 23 Hoekstra J, van der Groot D P J, van den Brlnk G and Bilsen F A
Vision Res. 14 365 (1974)
24 Kelly D H Opnca Acta 24 107 (1977)
25 Wright G A and Rea M S Proc. International Conf. Occupational
Ergaomics Volume I: Research r e p m and care d i e s Human Factors Conference, Inc., Rexdale, Ontario, 508 (1984)