HAL Id: hal-03229881
https://hal.archives-ouvertes.fr/hal-03229881
Submitted on 19 May 2021
HAL is a multi-disciplinary open access
archive for the deposit and dissemination of
sci-entific research documents, whether they are
pub-lished or not. The documents may come from
teaching and research institutions in France or
abroad, or from public or private research centers.
L’archive ouverte pluridisciplinaire HAL, est
destinée au dépôt et à la diffusion de documents
scientifiques de niveau recherche, publiés ou non,
émanant des établissements d’enseignement et de
recherche français ou étrangers, des laboratoires
publics ou privés.
Distributed under a Creative Commons Attribution - NonCommercial - NoDerivatives| 4.0
The neural processing of pitch accents in continuous
speech
Fernando Llanos, James Sneed German, G Gnanateja, Bharath
Chandrasekaran
To cite this version:
Fernando Llanos, James Sneed German, G Gnanateja, Bharath Chandrasekaran.
The
neu-ral processing of pitch accents in continuous speech.
Neuropsychologia, Elsevier, 2021, 158,
Neuropsychologia 158 (2021) 107883
Available online 11 May 2021
0028-3932/© 2021 The Author(s). Published by Elsevier Ltd. This is an open access article under the CC BY-NC-ND license (http://creativecommons.org/licenses/by-nc-nd/4.0/).
The neural processing of pitch accents in continuous speech
Fernando Llanos
a,b, James S. German
c,1, G. Nike Gnanateja
a, Bharath Chandrasekaran
a,* aDepartment of Communication Science and Disorders, University of Pittsburgh, Pittsburgh, PA, USAbDepartment of Linguistics, The University of Texas at Austin, Austin, TX, USA cAix-Marseille University, CNRS, LPL, Aix-en-Provence, France
A R T I C L E I N F O Keywords: Pitch accents Prosody F0 EEG Language experience Selective attention Continuous speech A B S T R A C T
Pitch accents are local pitch patterns that convey differences in word prominence and modulate the information structure of the discourse. Despite the importance to discourse in languages like English, neural processing of pitch accents remains understudied. The current study investigates the neural processing of pitch accents by native and non-native English speakers while they are listening to or ignoring 45 min of continuous, natural speech. Leveraging an approach used to study phonemes in natural speech, we analyzed thousands of electro-encephalography (EEG) segments time-locked to pitch accents in a prosodic transcription. The optimal neural discrimination between pitch accent categories emerged at latencies between 100 and 200 ms. During these latencies, we found a strong structural alignment between neural and phonetic representations of pitch accent categories. In the same latencies, native listeners exhibited more robust processing of pitch accent contrasts than non-native listeners. However, these group differences attenuated when the speech signal was ignored. We can reliably capture the neural processing of discrete and contrastive pitch accent categories in continuous speech. Our analytic approach also captures how language-specific knowledge and selective attention influences the neural processing of pitch accent categories.
1. Introduction
Speakers modulate the fundamental frequency (F0) of their voice during speech, and these modulations serve several communicative functions. For example, they may be used to mark linguistically relevant information. A rising versus falling F0 at the end of a sentence marks it as a question or a statement, respectively (Cole, 2015; Ladd, 2008). F0 modulations also serve to convey certain aspects of the speaker’s emotional state, such as joy (increased F0 range) or sadness (decreased F0 range) (B¨anziger and Scherer, 2005; Pell et al., 2009). In languages like English, changes in F0 are also used to give special prominence to words within an utterance (Gussenhoven et al., 1997; Pierrehumbert, 1980). Consider the sentence “Marianna made the marmalade”. When produced with a large F0 movement (e.g., shallow rising pitch) on
Marianna followed by a low flat pitch on the remaining words, it is
understood to be addressing the issue of who made the marmalade. Alternatively, when produced with a large pitch movement on
marma-lade, it is understood to be addressing the issue of what Marianna made.
The changes in F0 that mark words as prominent in this way are called
pitch accents (Beckman and Pierrehumbert, 1986; Gussenhoven, 2004;
Pierrehumbert, 1980).
While pitch accents play a fundamental communicative role in multiple languages around the world, their neural processing is not well established. Previous studies on pitch accent processing (Dimitrova et al., 2012; Lee et al., 2020; Schumacher and Baumann, 2010; Tamaoka et al., 2014) have paid more attention to the processing of pitch accents at postlexical stages of linguistic processing, when the output from speech processing areas in the auditory and superior temporal cortices is integrated with the processing of lexical and semantic features in the mid and low temporal lobe regions. As a consequence, only a handful of studies (e.g., R¨ohr et al., 2020; Tang et al., 2017) have recently inves-tigated the neural processing of pitch accents at prelexical stages of phonological processing. In particular, there have been no prior at-tempts ‒to the best of our knowledge‒ to assess pitch accents in the context of naturalistic stimuli such as continuous speech, where the relevance of pitch accent categories comes to the fore. In the present study, we leverage an approach that has been successfully deployed to study phoneme categories in natural speech (Khalighinejad et al., 2017;
Mesgarani et al., 2014), to investigate the neural processing of English pitch accents in continuous speech. To establish the extent to which our
* Corresponding author.
E-mail address: b.chandra@pitt.edu (B. Chandrasekaran). 1 Co-first author.
Contents lists available at ScienceDirect
Neuropsychologia
journal homepage: www.elsevier.com/locate/neuropsychologia
https://doi.org/10.1016/j.neuropsychologia.2021.107883
approach is sensitive to biologically-relevant phenomena, we also investigated the effects of language experience and attention on the neural processing of pitch accent categories.
1.1. Pitch accents and information-structural features
Within a word, pitch accents are typically produced on the stressed syllable of that word (Beckman and Pierrehumbert, 1986; Dilley, 2005;
Gordon and Roettger, 2017; Pierrehumbert, 1980). For example, the F0 movements associated with a pitch accent on the noun ‘per-mit, which has stress on the first syllable, would occur earlier in the word than for the verb per-’mit, which has stress on the second syllable. Thus, while a speaker chooses which words in an utterance receive pitch accents, the specific syllables that carry those pitch accents are determined by the stress patterns of the individual words.
Beyond single words, pitch accents exhibit several characteristic F0 contours which modulate the information structure of the discourse (Cole, 2015; Cole et al., 2019; Pierrehumbert and Hirschberg, 1990;
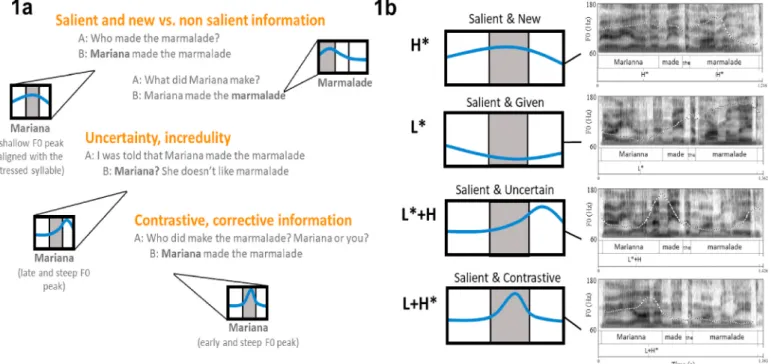
Wagner and Watson, 2010). For example, in English, a shallow rising F0 movement generally conveys that the accented word represents infor-mation that is salient and entirely new in the discourse, while a low dipping movement conveys that the accented word represents infor-mation that is salient but already known or given to the listener (Fig. 1a). Other types of F0 patterns may convey that the accented word is being contrasted with a salient alternative (a steep rise to a peak early in the syllable), or that the speaker is uncertain on whether the information is relevant (a steep rise to a peak late in the accented syllable) ( Pierre-humbert and Hirschberg, 1990). These category differences in the shape and timing of the F0 movements are reliably used by listeners to decode information-structural features (e.g., salient, new, given, uncertain, or contrastive information).
Pierrehumbert (1980) and Beckman and Pierrehumbert (1986)
showed that pitch accents can be phonologically described in terms of the number and type of just two tonal targets: high “H” and low “L”. Two of the pitch accent categories in English can be described as one
monotonal high or low target and are written as H* and L* (Fig. 1b). These two labels specify that the F0 must reach a high (H*) or low (L*) F0 target within the stressed syllable. H* and L* are typically realized with a shallow rising (H*) or a low dipping (L*) F0 movement, which may start before the stressed syllable of the accented word. These F0 excursions are used to convey information that is salient and new (H*) or salient but given (L*).
Other pitch accent categories in English are better described as a sequence of two underlying tones bound together as a single phono-logical unit, such as L+H* and L*+H (Pierrehumbert, 1980; Beckman and Pierrehumbert, 1986). Here, the bitonal accent L+H* specifies that the F0 must rise from a low F0 target to a high target within the stressed syllable of the accented word. This bitonal accent is typically realized with a steep rising F0 movement that starts early in the stressed syllable. For L*+H, however, it is the low target which should be reached within the stressed syllable with the high target following it. This bitonal accent is typically realized as a steep rising F0 movement that starts late in the stressed syllable and peaks in the following one. In English, L+H* and L*+H are used to convey information that is contrastive (L+H*) or that the speaker is uncertain about (L*+H).
1.2. The neural processing of pitch accents
The neural processing of pitch accents has received considerably less attention in the literature than the neural processing of other prosodic units such as lexical tones (Chandrasekaran et al., 2007; Krishnan et al., 2005; Reetzke et al., 2018; Wong et al., 2007). A prior study leveraged electrocorticography (ECoG) (Tang et al., 2017) to assay the on-line encoding of pitch accents by local populations of neurons in the supe-rior temporal gyrus (STG). This study examined the neural processing of pitch accents in new and salient (H*) versus neutral (flat pitch) contexts. Crucially, however, English includes an inventory of at least five phonologically distinct pitch accent categories (H*, L*, L+H*, L*+H, and H+!H*) which, like phonemes, are perceived categorically (e.g.,
Pierrehumbert and Steele, 1989; D’Imperio, 2000; Kohler, 1987;
Fig. 1. Pitch accents and information structure. (1a) Schematic representations of pitch accent’s F0 contours in different information-structural contexts. Shaded
areas represent stressed syllables in accented words. Among other functions, pitch accents can be used to highlight salient and new discursive information or express uncertainty and corrective feedback. (1b) Schematic representation and natural speech recordings of the pitch accent categories examined in our study and their labels in the Tone and Break Indices (ToBI) transcription system. Natural speech recordings were acquired in Praat from a male native speaker of English who did not participated in the study.
Niebuhr, 2007). Several studies have used electroencephalography (EEG) to investigate the neural processing of pitch accents (Dimitrova et al., 2012; Lee et al., 2020; Li et al., 2008; R¨ohr et al., 2020; Schu-macher and Baumann, 2010; Tamaoka et al., 2014). Most of these studies examined late event-related potentials (ERPs), such as the P300 or N400, to assess the on-line integration of prosodic and semantic in-formation at postlexical stages of linguistic processing (i.e., after acoustic-phonetic cues are integrated into the lexical representation of words). Critically, these postlexical stages occur after the encoding of acoustic-phonetic features in the STG and primary auditory cortices (Mesgarani et al., 2014; Tang et al., 2017; Teoh et al., 2019; Yi et al., 2019). The results of this prior ERP work show that the integration of prosodic and semantic information at postlexical stages of linguistic processing is highly influenced by attention (R¨ohr et al., 2020) and native language experience (Lee et al., 2020). However, the effects of attention and language experience during the processing of pitch accent categories are not well established in this literature. In one recent ERP study, R¨ohr et al. (2020) found that the processing of pitch patterns at neural latencies shorter than 200 ms is more sensitive to changes in the F0 when those changes relate to information-structural features. This finding suggests that the neural encoding of pitch patterns in speech processing regions (e.g., the STG and superior temporal sulcus) may be informed by the linguistic interpretation of pitch accents in a particular language context.
The studies on pitch accent processing discussed above examined the processing of pitch accents in the context of isolated words or sentences rather than continuous speech. While isolated words and sentences enable a higher degree of experimental control than continuous speech, they are less naturalistic and engage the brain differently (Alexandrou et al., 2020; Hickok and Poeppel, 2007; Overath et al., 2015). This is in part because the processing of isolated speech requires less sustained attention and monitoring than continuous speech. In addition, ERP studies often rely on controlled experimental contexts in which listeners’ expectations are engineered in somewhat non-naturalistic ways that may interfere with the direct observation of the neural mechanisms underpinning the processing of everyday speech. While continuous speech is experimentally less controlled than isolated speech, it provides a more optimal window into the neural processing of pitch accents in phonetically rich and elaborated discursive contexts. Several EEG studies (e.g., Di Liberto et al., 2015; Khalighinejad et al., 2017; Song and Iverson, 2018) have examined the neural processing of consonants and vowels in continuous speech. This line of research has identified mul-tiple evoked potentials linked to the processing of discrete and contrastive speech sound features. In the current study, we investigated the extent to which pitch accents in continuous speech also elicit discrete and phonologically contrastive neural signatures.
Another research question that remains unsettled from prior EEG work is the extent to which the neural processing of pitch accents is permeable to differences in native language experience and attention. While native language experience and selective attention are important neuromodulators of speech sound processing (e.g., Mesgarani and Chang, 2012; Song and Iverson, 2018), their effects on the processing of phonetic distinctions between pitch accents are not well established. This research gap raises fundamental questions about the contribution of lifelong, language-specific experiences to the processing of pitch ac-cents. Is the neural processing of pitch accents informed by native experience with the linguistic interpretation of pitch accents? This research question could be properly addressed by comparing native
versus non-native processing of pitch accents. 1.3. The present study
1.3.1 Experimental design. We analyzed EEGs from native English speakers (English group; N = 15) and native Chinese speakers of English (Chinese group; N = 15) while they were listening to an English audio-book, which has been phonologically transcribed for pitch accents with
the Tone and Break Indices (ToBI) labeling system (Beckman and Ayers, 1997; Beckman and Hirschberg, 1994; Pitrelli et al., 1994; Silverman et al., 1992). A prior study (Reetzke et al., 2021) showed that the neural encoding of the continuous intensity envelope of speech was differen-tially modulated by attention and language experience. As a part of this experimental design, the narration was mixed with non-speech dis-tractors in a selective attention task with two conditions. In the attended
speech condition, participants were instructed to pay more attention to
the speech signal. In the ignored speech condition, they were instructed to pay more attention to the non-speech distractors.
1.3.2 Research aims. Our primary goal is to examine the extent to which discrete and contrastive neural responses to pitch accent cate-gories can be decoded from continuous speech. Specifically, we aimed to determine when the processing of pitch accent contrasts can be observed in the EEG. To this end, we analyzed thousands of EEG segments time- locked to the onsets of pitch accent tokens in one phonological tran-scription of pitch accents (henceforth, accent related potentials or ARPs). Continuous speech lacks systematic repetitions for the most part, and thus neural responses to continuous speech are quite noisy. However, recent neuroimaging work has developed several approaches to extract biologically relevant properties from noisy neural signals and link them to the processing of linguistic units in naturalistic stimuli (Hamilton and Huth, 2020; Xie et al., 2019). In the EEG modality, these approaches are often based on the modeling of linear relationships between long EEG and speech segments (e.g., Di Liberto et al., 2015) or the analysis of hundreds to thousands of shorter time-locked responses collapsed across multiple participants and/or sessions (e.g., Khalighinejad et al., 2017;
Xie et al., 2019). Motivated by the second kind of approach, which is temporally more localized in the neural signal, we grand-averaged ARPs by pitch accent category (H*, L*, L*+H, L+H*), language group (English vs. Chinese), and condition (attended vs. ignored speech). Next, we conducted permutation analyses (Xie et al., 2018, 2019; Zinszer et al., 2016) to identify the time windows at which grand-averaged signals provided robust, above-chance neural discrimination of pitch accent categories. We conducted additional permutation analyses to assess the effects of native language experience and selective attention on neural discrimination scores above the level of chance.
Additionally, we aimed to assess the structural representation of pitch accent distinctions in the neural signal. To this end, we conducted representational similarity analyses via multidimensional scaling modeling (MDS; Di Liberto et al., 2015; Feng et al., 2019; Khalighinejad et al., 2017; Mesgarani et al., 2014; Zinszer et al., 2016). We conducted these analyses to assess the degree of structural similarity between acoustic (F0 contours) and neural (ARP) representations of pitch accent contrasts. English pitch accents are phonologically distinguished by their number of tonal targets: they can be monotonal, as H* and L, or bitonal, as L+H* and L*+H. English pitch accents are also distinguished by their head tone, which is the tone that is more closely aligned to the stressed syllable of the accented word. The head tone can be high, as in H* and L+H*, or low, as in L* and L*+H. We used MDS to assess the extent to which these phonologically relevant contrasts (number of targets and head tone) were structurally preserved in the acoustic (F0) and neural (ARP) domain.
1.3.3 Predictions. We expected to identify a characteristic EEG signature for each pitch accent category in continuous speech. From prior ERP (R¨ohr et al., 2020) and ECoG (Tang et al., 2017) work on pitch accent processing, we expected robust neural discrimination of pitch accents at neural latencies shorter than approximately 200 ms. Our predictions for native versus non-native processing were linked to the potential effects of native experience with complex pitch patterns. Mandarin Chinese syllables can bear multiple F0 contours to convey different lexical meanings (Gandour, 1978). For instance, the Mandarin Chinese syllable ma is pronounced with a high-level, low-rising, low-dipping, or high-falling tone depending on when the speaker means “mother”, “hemp”, “horse”, or “scold”, respectively. Thus, while native speakers of Mandarin Chinese and English are exposed to complex and
linguistically relevant pitch patterns since birth, they differ in the way they use these patterns in their native environments. We used this cross-linguistic difference to assay the following hypotheses. If the processing of English pitch accents is mediated by lifelong experience with their specific linguistic interpretation in English, then the Chinese group should exhibit less robust processing (e.g., poorer neural discrimination) of English pitch accents than the English group. Alter-natively, if the encoding of pitch accents is supported by auditory experience with complex pitch patterns but not with their linguistic interpretation in a particular language, then the Chinese group should exhibit a near-native processing of English pitch accents, as they were exposed to similar complex pitch patterns (Mandarin lexical tones) since birth.
If pitch accents are pro-actively encoded in a goal-directed manner, then their processing should be modulated by attention. From prior ERP work on pitch accent processing (R¨ohr et al., 2020) and prior EEG work on the effects of selective attention during speech processing (Song and Iverson, 2018), we expected the effects of attention to emerge also at latencies longer than 200 ms. Prior EEG work on continuous speech at the segmental level (e.g., Song and Iverson, 2018; Reetzke et al., 2021) has demonstrated that, while listeners tend to recruit more attention and monitoring resources during non-native speech processing (vs. native processing), such recruitment may not be sufficient to achieve a near native processing of non-native speech sound features. Thus, we were particularly interested in tracking the effects of attention in the Chinese group relative to the English group in both conditions.
2. Methods
The EEGs analyzed in the current study were collected as a part of a larger EEG study (Reetzke et al., 2021) that focused on the role of lan-guage experience and attention on the neural encoding of the speech intensity envelope. We leveraged this rich dataset that employed a cross-language (English vs. Chinese) and a within-subject (Attended vs. Ignore) contrast to a) assess the validity of a novel metric (ARP) in capturing pitch accent categories in the EEG signal, and b) examine the extent to which our novel metric is sensitive to attentional and cross-language differences.
2.1. Participants
The research protocols were approved by the Institutional Review Board of the University of Texas at Austin and written informed consent was obtained from the participants. We analyzed EEGs from 15 native speakers of English (9 females; M = 24.73 years, SD = 3.59 years) and 15 native speakers of Mandarin Chinese (8 females; M = 22.53 years, SD = 3.66 years). Participants completed a language experience questionnaire (Li et al., 2014). Native speakers of English reported no significant experience (<1 year) learning or speaking a foreign language. Native speakers of Mandarin Chinese were born and raised in mainland China and did not start learning English until after the age of 6 years (range = 6–16 years, M = 9.80 years, SD = 2.75 years). Additionally, they had lived in the United States for no more than 6 years (range = 1–6 years, M =2.30 years, SD = 1.83 years). Native and non-native speakers of En-glish were matched for age (F1, 28 =2.76, p = 0.108, ηp2 =0.09), and non-verbal intelligence (Native: M = 118.47, SD = 8.44; Non-native: M =123.34, SD = 7.18; F1, 28 =2.90, p = 0.1, ηp2 =0.09), as measured by the Kaufman Brief Intelligence Test-Second Edition, KBIT-2, matrices subtest (normal intelligence: M = 100, SD = 15) (Kaufman, 2004). All participants reported no previous history of speech, language, or neu-rodevelopmental disorders. They also had air and bone conducted hearing thresholds within 20 dB HL at octave frequencies from 250 to 8000 Hz measured with an Equinox 2.0 PC-Based Audiometer (Inter-acoustics A/S, Middelfart, Denmark).
2.2. Stimuli
The stimuli created for the selective attention task consisted of 60 speech segments of approximately 1 min duration, extracted from the English audiobook Alice’s Adventures in Wonderland (Reetzke et al., 2021). The story was narrated in American English by a male speaker (F0: M = 152.10 Hz, SD = 40.82 Hz). Speech segments were mixed with one of two types of non-speech distractors (Fig. 2a). The first type of distractor consisted of a series of standard harmonic tones randomly mixed with deviant tones that differed in frequency. The second type of distractor consisted of a series of standard harmonic tones randomly mixed with deviant tones in duration. The standard harmonic tones were 75 ms in duration with 5 ms intensity ramps and consisted of three si-nusoidal partials: 500, 1000, and 1500 Hz. The intensities of the second and the third harmonics were 3 and 6 dB lower than the intensity of the first partial. The frequency of the deviant tones consisted of partials with frequencies 63% higher than the standard tones (800, 1600, 2400 Hz). The duration of the deviant tones was 200 ms. The probability of occurrence of the deviant tones ranged from 13% to 19% across speech segments and the elapsed time between consecutive tones was ran-domized between 300 and 500 ms. The amplitude of the speech stimuli and the tone sequences was normalized to the same root-mean-square (RMS) value of 65 dB (SPL). Each speech segment was mixed with a randomly selected tone sequence that matched the duration of the segment.
2.2.1 Phonological transcription of pitch accents. Forty-five of
the 60 speech segments included in the selective attention task of the audiobook were fully transcribed for pitch accents by a single tran-scriber with expertise in all aspects of English ToBI, and who is not one of the authors (Fig. 2b). Pitch accents were identified and assigned a category label following the Tones and Breaks Indices (ToBI) system for English (Beckman and Ayers, 1997a; Beckman and Hirschberg, 1994;
Pitrelli et al., 1994; Silverman et al., 1992).
ToBI is a transcription system designed to capture phonological as-pects of spoken intonational prosody. In other words, it seeks to distinguish “all of the categorically distinct intonation patterns and prosodic units of [English]” (Beckman and Ayers, 1997b), as opposed to capturing the potentially non-contrastive phonetic details of f0 contours as in some other systems. The set of category labels are motivated by language-internal contrasts, and in that sense, it has more in common with a phonemic or “broad” transcription of segments using the Inter-national Phonetic Alphabet. At a theoretical level, it is based on the Autosegmental Metrical (AM) framework for the intonational phonology of English (Beckman and Pierrehumbert, 1986; Pierre-humbert, 1980). As such, the phonological elements of interest include pitch accents as well as two types of phrase boundaries. In the present study, we focused on the pitch accents. In practical terms, the assign-ment of labels relies on a combination of a labeler’s auditory impression as well as visual inspection of acoustic information as provided by F0, spectrographic, and waveform representations. While the different cat-egories of English pitch accents are generally associated with differences in pragmatic meaning (Pierrehumbert and Hirschberg, 1990), labelers are explicitly instructed to exclusively focus on the intonation and not the meaning while transcribing.
The ToBI transcription was carried out using the Praat software package (Boersma and Weenink, 2018). In keeping with the AM framework, the annotation guidelines for ToBI do not specify F0 shapes but rather the sequencing and temporal alignment characteristics of high and low F0 targets. The inventory of ToBI labels along with their F0 diagnostics as provided in Beckman and Hirschberg (1994) is given below (see also Fig. 1).
• H*: a monotonal tone target on the accented syllable which is in the
upper part of the speaker’s pitch range for the phrase. This includes tones in the middle of the pitch range but precludes very low F0 targets.
•L*: a monotonal tone target on the accented syllable which is in the lowest part of the speaker’s pitch range.
•L*þH: a bitonal target with a low tone target on the accented
syl-lable which is immediately followed by relatively sharp rise to a peak in the upper part of the speaker’s pitch range.
•LþH*: a bitonal target with a high peak target on the accented
syl-lable which is immediately preceded by relatively sharp rise from the lowest part of the speaker’s pitch range.
•Hþ!H*: a clear step down onto the accented syllable from a high
pitch which itself cannot be accounted for by a H phrasal tone ending the preceding phrase or by a preceding H pitch accent in the same phrase; should only be used when the preceding material is clearly high-pitched and unaccented.
The last category (H+!H*) had much fewer tokens (N = 85) than other categories (N > 317), and the number of tokens was too small to elicit a robust averaged response in a continuous speech context. Therefore, this category was excluded from the analyses. The number of tokens of each pitch accent category included in the analyses is shown in
Fig. 2c.
2.2.2 Analysis of pitch accent F0 contours. To assess the main F0
patterns of the pitch accent categories, we averaged their F0 contours across pitch accent tokens. F0 was extracted in Praat (Boersma and Weenink, 2018) with the autocorrelation method, a pitch floor of 75 Hz, a time frame of 40 ms, and time steps of 10 ms. We used the MATLAB toolbox mPraat (Boˇril and Skarnitzl, 2016) to export the Praat F0 con-tours to MATLAB for further analysis and visualization. To ensure that all the F0 contours included in the average were properly aligned with respect to their ToBI labels and had the same length, missing F0 values, if any, were interpolated with autoregressive modeling using the MATLAB function fillgaps.m (default settings). Fig. 3a depicts the F0 contours of the pitch accents by category.
2.2.3 Acoustic assessment of stimulus onsets. Because the ToBI
labeling system is informed by subjective visual and auditory inspection, we conducted an acoustic separability analysis (Khalighinejad et al., 2017; Mesgarani et al., 2014) to ground the onsets of pitch accents in more objective acoustic parameters. In the acoustic separability anal-ysis, we computed the F-statistic of F0 values grouped by pitch accent category at different time points around the ToBI label. The F-statistic is a ratio of between-category to within-category variability. We used this ratio to identify the time window in which pitch accent categories were more separable by their F0. The optimal separability window ranged from 50 ms before the ToBI label to 50 ms after, with a peak of maximum separability right at the ToBI label (Fig. 3b). We therefore adjusted the onset of the pitch accents to 50 ms before the ToBI label, as this time point marked the onset of F0 divergences between pitch accent categories.
2.3. Procedure and selective attention task
During the selective attention task, the auditory stimuli was pre-sented binaurally using custom E-Prime protocols. Each participant listened to 60 speech segments (~1 min duration each) mixed with se-quences of non-speech distractors across two experimental conditions. Participants were instructed to pay attention to the speech or the tones at the beginning of each condition. In the attended speech condition, they were told that their goal was to correctly answer the content- related questions. In the ignored speech condition, they were instruc-ted to correctly answer the tone-relainstruc-ted questions. The order of the conditions was counterbalanced across participants. Thirty of the 45 speech segments that were phonologically transcribed for pitch accents belonged to the attended speech condition. Fifteen of the 45 speech segments that were phonologically transcribed for pitch accents belonged to the ignored speech condition.
Participants were prompted with four multiple-choice questions at the end of each speech segment. Two of the questions were about the
Fig. 2. Selective attention task and prosodic transcription. (2a) In the selective attention task, speech segments of 1 min of duration were mixed with sequences
of harmonic tones including deviants in frequency (top spectrogram) or duration (bottom spectrogram). Participants were instructed to focus on either the speech signal or the tone deviants depending on the condition. We asked questions on the speech contents at the end of each segment. (2b) Speech signals were transcribed for pitch accents using the ToBI system. (2c) Number of tokens of each pitch accent category in total and by condition.
contents of the speech stimuli and the other two questions focused on the number and type of deviants in the non-speech signal. Participants were given an unlimited amount of time to answer these questions. To assess the effects of group (language experience) and condition (atten-tion) on speech comprehension, individual proportions of correct re-sponses to speech comprehension questions were modeled with the following linear mixed effects equation:
accuracy ∼ group* condition + (1|subject)
During the selective attention task, EEGs were collected from the participants as they listened to the stimuli. EEGs were recorded using a 64 channel actiCap with Brain Products active electrodes (impedance < 15 kΩ). Transduced signals were amplified and digitized with a Brain-Vision actiCHamp system. EEGs were recorded at 25 kHz using PyCorder 1.0.7 software.
2.4. EEG preprocessing
EEGs were preprocessed off-line with BrainVision Analyzer 2.0 software. Consistent with previous electrophysiological work using narrative speech (Di Liberto et al., 2015; Reetzke et al., 2021), EEGs were bandpass filtered from 1 to 15 Hz, using a zero phase-shift But-terworth filter (12 dB/octave, zero phase shift), and referenced to the average of the two mastoid electrodes (TP9 and TP10). The two mastoid electrodes that were used as the reference channels were excluded from further analysis. EEGs were then segmented into epochs that were time-aligned to each speech segment and down-sampled to 128 Hz for
computational efficiency. Independent component analysis (ICA) was performed using the restricted Infomax algorithm to separate ocular components from the brain related components in the EEG. The inde-pendent components that were consistent with ocular activity based on waveform pattern, scalp distribution, and power spectrum were visually identified and removed from the data.
2.5. Neural processing of pitch accents
2.5.1 Derivation of pitch accent related potentials. Pitch accent
related potentials (ARPs) were extracted from the preprocessed EEG epochs time-locked to the onset of each pitch accent token in the phonological transcription. Epochs were extracted from − 500 to 500 ms relative to onset of the pitch accent token. The length of the F0 contours of the pitch accents changed across individual tokens and categories. To cope with this variability intrinsic to narrative speech, we used a con-servative baseline of 500 ms. We found that, on average, this baseline duration was long enough to capture the primary changes in the F0 associated with each pitch accent category plus a few hundreds of ms (see Fig. 3a). Therefore, we used this baseline duration to ensure that the portion of the neural signal preceding these changes in the F0 was no smaller than in prior ERP work (baseline ≥ 200 ms; e.g., R¨ohr et al., 2020).
Epochs with magnitudes larger than 100 μV were considered
arti-facts and excluded from further analyses. To leverage the signal-to-noise (SNR) of the ARPs, they were grand-averaged by pitch accent category, group, and condition. This resulted in a total of 16 grand-averaged
Fig. 3. Pitch accent’s F0 contours and speech comprehension scores. (3a) F0 contours (M and SEM) of L* and H* (left) and L+H* and L*+H (right) across
phonologically transcribed segments. The origin of the x-axis (0 ms) marks the onset of the ToBI label. (3b) F-statistic curve, and its derivative, showing the time points at which the accent categories were more separable by their F0. The origin of the x-axis (0 ms) corresponds to the onset of the ToBI label. (3c) Proportion of correct responses (M and SD) to speech comprehension questions in the selective attention task. The asterisks denote post-hoc Bonferroni-adjusted p-values smaller than 0.001.
signals (4 categories × 2 groups × 2 conditions; Fig. 4a and b). Grand- averaged ARPs were z-scored to facilitate their comparison with z- scored F0 signals.
2.5.2 Dynamic selection of EEG channels. Because the neural
sources of the EEG change as the neural signal propagates throughout the cortex, ARP segments within each time frame were grand-averaged over a data-driven selection of channels, which was allowed to change across time frames. This dynamic selection of channels allowed us to focus on the activity that was more directly linked to the processing of pitch accents within each time frame. To identify these channels, we conducted a neural separability analysis (Khalighinejad et al., 2017;
Mesgarani et al., 2014). First, for each channel, we computed the F-statistic of ARP magnitudes grouped by pitch accent category over time. Next, we selected the 25% (N = 15) of channels providing the larger F-statistic on average within the corresponding time frame. Thus, for each time frame, we focused on the channels providing a mean neural separability index above the 75th percentile for all groups and conditions. The F-statistic is a ratio of between-category to within-category variability. We used this ratio to identify the channels providing a better neural separation of pitch accent categories during the corresponding period of time (Fig. 4c). Critically, while the channel selection was allowed to change between time frames, the selection of channels did not change between groups and conditions so the effects of language experience and attention could not be attributed to group and condition-specific selections of channels.
2.5.3 Permutation analyses. To assess the neural processing of
pitch accents over time, grand-averaged ARPs were segmented into smaller frames of 100 ms duration and 75 ms overlap. To assess the neural discrimination of pitch accent categories at each time frame, group, and condition, we computed the mean Euclidean distance (MED) between the corresponding grand-averaged ARP segments ‒ one segment per pitch accent category. MED scores were computed as the mean of the output of the MATLAB function pdist.m, which returns the Euclidean distance between pairs of observations. Higher MED scores were interpreted as more robust processing of phonologically relevant pitch accent contrasts.
First, we conducted permutation tests (Xie et al., 2018, 2019; Zinszer et al., 2016) to identify the time frames in which the neural discrimi-nation scores, as measured by the MED, were above the level of chance and thus linked to the processing of pitch accent contrasts. We con-ducted a separate permutation test for each group in each condition. In each permutation test, we permuted the ToBI labels randomly across pitch accent tokens to estimate a new permuted MED score for each time frame. We repeated this procedure 100 times to create a chance-level distribution of permuted MED scores. Next, we calculated the propor-tion of permuted MED scores that were larger than the original MED score observed in the corresponding frame. We used this proportion as a p-value to reject the hypothesis that neural discrimination activity in that frame was at chance and thus not directly linked to pitch accent processing. In each permutation test, we incorporated four additional
Fig. 4. Grand-averaged time-locked responses. (4a) Z-scored grand-averaged F0 contours (left) and ARPs (mid and right) for each condition and group. The first
400 ms of each ARP are highlighted with darker color. The origin of the x-axis (0 ms) marks the location of the ToBI label (4b) Grand-averaged F0 contours (left) and ARPs (right) for native listeners in the attended speech condition. F0 and ARP segments are extracted from the time frames providing the best F0 or neural discrimination of pitch accent categories. The x-axis (0 ms) marks the onset of the pitch accent (4c) Neural F-statistic curve across channels (M and SD). This curve shows the time points in which pitch accent categories are more separable by their ARP magnitude. The scalp topographic maps depict F-statistic values by channel at several time points of the curve. These maps were created with the EEGLAB function “topoplot” (Delorme and Makeig, 2004). These values were obtained using a very short window of 10 ms centered on each peak. (For interpretation of the references to color in this figure legend, the reader is referred to the Web version of this article.)
baseline time frames occurring at negative latencies, before the stimulus
onset. The onset of the baseline frames ranged from − 100 to − 0 ms in steps of 25 ms (75 ms overlap). We used these additional frames as a control to assess the extent to which neural discrimination scores were not significant before or at the stimulus onset. We adjusted the level of significance with the Bonferroni criterion to compensate for the number of frames included in each permutation test (N = 21).
We conducted additional permutation analyses to assess group
dif-ferences in neural discrimination scores above the level of chance. We
conducted a separate analysis for each condition. Here, baseline frames were excluded because their MED scores were not above the level of chance (see the Results). In each analysis, we subtracted the chance-level distribution of permuted MED scores from the original MED score observed in each frame to derive a distribution of MED scores above the level of chance for each group. Next, we used the two-sample t-test to assess group differences in the derived distributions. We adjusted the level of significance with the Bonferroni criterion to compensate for the number of time frames included in each condition (N = 16).
We did not examine the effects of attention within groups because the number of speech segments phonologically transcribed for pitch accents in the attended speech condition (N = 30) was twice the number of transcribed segments in the ignored speech condition (N = 15). We instead examined the effects of attention by comparing group differ-ences in pitch accent processing between conditions.
2.6 Representational similarity analysis. To assess the neural
representation of phonological contrasts between pitch accents, we conducted representational similarity analyses (RSA) via multidimen-sional scaling (MDS) modeling. The MDS modeling (Di Liberto et al., 2015; Feng et al., 2019; Khalighinejad et al., 2017; Mesgarani et al., 2014; Zinszer et al., 2016) allowed us to compare the structural repre-sentation of pitch accent categories in the acoustic and neural domains. We conducted a separate non-classical MDS for grand-averaged F0 or ARP segments in each group and condition. This resulted in a total of 8 MDS models (2 domains × 2 groups × 2 conditions).
F0 segments were extracted from the time frame providing the best F0 discrimination of pitch accents (0–100 ms). ARP segments were extracted from the time frame providing the best neural discrimination of pitch accent categories (100–200 ms). The time elapsed between ARP and F0 frames (=100 ms) is within the expected range of cortical la-tencies reported in prior auditory neuroscience work (50 ms ≤ latency ≤100 ms; e.g., R1 in Khalighinejad et al., 2017). The MDS was imple-mented with the MATLAB function mdscale.m using the Euclidean dis-tance as dissimilarity metric. Since the axis of the acoustic and neural MDS models were not directly comparable, we used the MATLAB function procrustes.m to find a linear transformation (translation, rota-tion, and reflection) between them so we could project them into the same dimensional space.
3. Results
3.1. Pitch accent F0 contours
On average, the F0 contours of the pitch accent categories reflected the phonetic patterns expected for their categories (Fig. 3a and b). For instance, L* and H* exhibited low dipping and high shallow F0 excur-sions, respectively, while the F0 movements of L+H* and L*+H were steeper. Additionally, the F0 peak of L*+H occurred later than the F0 peak of L+H*. These results demonstrate that the phonological (ToBI) transcription captured systematic phonetic differences between pitch accent categories.
3.2. Speech comprehension accuracy
The selective attention task included questions about the contents of the story that we used to assess the effects of language experience and attention on speech comprehension. The results of the linear mixed
effects model (Fig. 3c) revealed an effect of language group (β = − 0.22, z = − 6.33, p < 0.01; reference = native) and condition (β = − 0.18, z = − 5.90, p < 0.01; reference = attended speech). Native English listeners (proportion correct: M = 0.80, SD = 0.12) were more accurate than native Chinese listeners (proportion correct: M = 0.50, SD = 0.20). Comprehension accuracy also improved in both language groups when they paid more attention to the speech signal (proportion correct: M = 0.78, SD = 0.16) compared to when it was ignored (proportion correct: M = 0.53, SD = 0.20).
3.3. Neural processing of pitch accents
3.3.1 Neural discrimination of pitch accents over time. The time
frames in which neural discrimination scores were statistically above the level of chance are marked with dots in Fig. 5a (permutation test: ps < 0.0001, Bonferroni-adjusted level of significance = 0.0024). Neural discrimination scores were above chance for several time frames following the stimulus onset. In contrast, none of the baseline frames preceding the stimulus onset yielded neural discrimination scores above the chance level (permutation test: ps > 0.0031, Bonferroni-adjusted level of significance = 0.0024). The MED curves for each group and condition are shown altogether in Fig. 5b left. The best neural discrim-ination scores across groups and conditions (Fig. 5b, right) were observed at neural latencies between 100 and 200 ms. This optimal discrimination peak was followed by a later and smaller peak at la-tencies between 325 and 425 ms. This peak did not convey MED values above the level of chance. These results suggest that the neural pro-cessing of pitch accent F0 features is likely occurring at time frames with a neural latency shorter than 200 ms. When listeners paid attention to the speech signal, we found a different F-statistic scalp distribution at each neural discrimination peak (Fig. 5b, right). In these scalp distri-butions, larger F-statistic values are linked to better neural discrimina-tion scores (Khalighinejad et al., 2017; Mesgarani et al., 2014). At the optimal discrimination peak, native English speakers yielded larger F-statistic values than native Chinese speakers across temporal channels. At the suboptimal peak, native Chinese speakers yielded larger F-sta-tistic values than native English speakers across frontocentral channels. These topographic differences provide a potential temporal dissociation of native versus non-native processing over time.
3.3.2 Group differences in neural discrimination. The results of
the permutation analyses conducted to evaluate group differences in neural discrimination scores above the level of chance are shown in
Fig. 5c. In this figure, significant differences between groups are marked with dots (two-sample t-test: ps < 0.0029, Bonferroni-adjusted level of significance = 0.0031). In the attended speech condition, native English speakers yielded better above-chance MED scores than native Chinese speakers in time frames with onset latencies shorter than approximately 200 ms. In contrast, native Chinese speakers exhibited better above- chance MED scores in time frames with onset latencies longer than approximately 200 ms. This pattern of group differences over time is consistent with the F-statistic topographic differences introduced above. Notably, in the ignored speech condition, the number of time frames in which native English listeners exhibited larger above-chance MED scores than native Chinese listeners decreased significantly (Fig. 5c). This demonstrates that group differences in pitch accent-related pro-cessing were modulated by selective attention.
3.4. Representational similarity analyses
The results of the representational similarity (RSA) analyses are shown in Fig. 5d. This figure demonstrates robust structural similarities between acoustic (F0) and neural (ARP) representations of pitch accents. In the F0 domain, pitch accent categories contrasting by their head tone (H* vs. L*, and L+H* vs. L*+H) were more separated or distant in the MDS space than pitch accent categories contrasting by their number of targets (H* vs. L+H*, and L* vs. L*+H). This indicates that head tone
differences were more heavily cued in the F0 signal than the number of targets. Notably, these cue weighting differences were preserved in the neural (ARP) domain, especially in the attended speech condition and in the group of native English speakers, who show greater relative dis-tances between pitch accent categories than native Chinese speakers (Fig. 5d). Interestingly, when speech was ignored, the native Chinese MDS model did not contrast monotonal and bitonal pitch accents (Fig. 5d, right). This finding suggests a very weak non-native represen-tation of this phonological contrast. Combined, these results demon-strate a better structural alignment among native listeners.
4. Discussion
We assessed the extent to which a novel metric (accent related
po-tentials; ARP) captured the neural discrimination of pitch accents by
native and non-native English speakers while they were listening to or ignoring 45 min of an English audiobook. We analyzed and modeled thousands of pitch accent related potentials derived from a prosodic transcription of the audiobook. Overall, our results demonstrate highly specific, robust, and temporally localized electrophysiological signa-tures of discrete pitch accent categories in a continuous speech context. These neural signatures are modulated by native language experience and selective attention, and they preserve the main phonetic contrasts between pitch accent categories in the F0 signal.
4.1. Temporal processing of pitch accents in continuous speech
We aimed to determine when the discrimination of pitch accent categories emerged in the time-locked EEG. We found robust neural discrimination in several time frames following ‒ but not preceding ‒ the stimulus onset (Fig. 5a). This finding suggests that neural activity in these frames was linked to the processing of pitch accent features. We found robust neural discrimination across multiple time frames (Fig. 4c). This broad time interval is consistent with the one reported for the processing consonants and vowels in prior EEG work using continuous speech (Khalighinejad et al., 2017). As in this prior EEG work, we found multiple response components occurring at different latencies and linked to distinguishable F-statistic scalp topographies. Earlier response components (<200 ms post-onset) conveyed larger F-statistic values linked to better processing in temporal electrodes. In contrast, later response components (>200 ms post onset) yielded larger F-statistic values in frontocentral electrodes (Fig. 4c). It has been shown that the cortical sources of the EEG recorded at temporal channels are inde-pendent from activity in frontocentral electrodes (McCallum and Curry, 1980; Ponton et al., 2002). Together, these findings suggest that the neural processing of pitch accents is supported by multiple cortical sources and the contribution of these sources changes over time (e.g.,
Garrido et al., 2008; Leonard et al., 2016; Mesgarani and Chang, 2012). We found that optimal neural discrimination of pitch accent cate-gories at neural latencies between 100 and 200 ms (Fig. 5b). This latency
Fig. 5. Neural discrimination and representational similarity. (5a) Neural discrimination (MED) scores over time (thin line) for each group in each condition.
The dots mark the time frames in which neural discrimination scores were statistically above the level of chance. The shaded area corresponds to the chance level distribution of permuted MED scores (M and SD). (5b) left. Neural discrimination scores for each group and condition; right. mean neural discrimination scores across all groups and conditions. The scalp topographic map on the left shows the EEG channels in which native speakers of English exhibited better F-statistic values than non-native speakers in the attended speech condition (native – non-native). The topographic map on the right shows the EEG channels in which non-native speakers exhibited better F-statistic values than native listeners in the same condition (non-native – native). Neural F-statistic values were estimated with time window of 100 ms centered on the corresponding peak. (5c) Group differences in neural discrimination scores above the level of chance in the attended speech (left) and ignored speech (right) conditions. The dots spot the time frames in which group differences were significant. (5d) Results of the representational similarity analyses. MDS model for each group, condition, and domain (F0 and ARP).
range is consistent with the onset of a strong ERP positivity reported for the processing of pitch accent differences in isolated sentences (R¨ohr et al., 2020). This latency range is also consistent with the range of la-tencies providing more robust neural discrimination of consonants and vowels in continuous speech (R1 in Khalighinejad et al., 2017). Com-bined, these findings suggest that the phonetic processing of segmental and prosodic units occur at similar neural latencies (<200 ms post-onset).
4.2. Effects of language experience and attention on pitch accent processing
In the attended speech condition, native English speakers demon-strated more robust discrimination of pitch accents than native Chinese speakers during approximately the first 200 ms of processing (Fig. 5b and c). Since native Chinese speakers were exposed to complex pitch patterns (Mandarin lexical tones) since birth, this group difference suggests that the processing of pitch accents is informed by lifelong experience with the linguistic interpretation of local pitch patterns. Otherwise, native Chinese speakers should have yielded a similar neural processing of pitch accent tonal patterns to native English speakers (Krishnan et al., 2005; Reetzke et al., 2018).
Interestingly, while native English speakers exhibited more robust processing than native Chinese speakers at latencies shorter than 200 ms, Chinese native speakers exhibited more robust processing than native English speakers at latencies longer than 200 ms (Fig. 5b and c). Because the neural discrimination of pitch accents was still better at shorter latencies in both groups (Fig. 5b, right), group differences at longer latencies could be the result of additional top-down processing recruitment by native Chinese listeners, presumably to compensate for perceptual difficulties associated with the processing of non-native pitch accent categories at shorter latencies. In support of this hypothesis, prior work on pitch accents (R¨ohr et al., 2020) has documented the effects of attention at ERP latencies longer than 200 ms. Additionally, prior EEG work in continuous speech (e.g., Song and Iverson, 2018; Reetzke et al., 2021) has demonstrated that non-native listeners tend to recruit more attentional resources than native listeners. In the present study, native and non-native speakers of English exhibited important differences in their F-statistic scalp topographies over time (Fig. 5b, right). At earlier latencies (<200 ms), native listeners provided larger F-statistic values than non-native listeners in temporal channels. This distribution is consistent with scalp topographies associated with cortical auditory processing (Wolpaw and Wood, 1982) and therefore suggests a better auditory encoding of pitch accent features by native speakers of English. At later latencies (>200 ms post onset), however, non-native speakers of English exhibited higher F-statistic values than native speakers in fron-tocentral channels. Prior EEG work has linked fronfron-tocentral scalp to-pographies to more effortful processing (Cavanagh et al., 2010; Gandour et al., 2003). This frontocentral distribution could therefore reflect a stronger processing effort in the native Chinese group. This interpreta-tion is consistent with the results of the speech comprehension ques-tions, as native Chinese speakers exhibited worse comprehension scores than native English speakers.
Critically, the group differences discussed above were enhanced in the attended speech condition. When the speech signal was ignored, native English speakers did not exhibit more robust processing of pitch accents than native Chinese speakers. This interaction between group and condition indicates that the processing of pitch accents is permeable to selective attention and that selective attention may improve the neural processing of pitch accents in both native and non-native lis-teners. This is also suggested by the speech comprehension scores, which improved in the attended speech condition.
4.3. Neural representation of pitch accent categories
To investigate the neural representation of pitch accent contrasts, we
conducted representational similarity analyses via MDS modeling. We used the MDS modeling to identify structural similarities between the acoustic (F0) and neural (ARPs) representation of the pitch accent cat-egories (Fig. 5d). We found robust structural similarities between acoustic and neural domains. For example, the contrast by head type (high vs. low targets) was more robustly encoded in the F0 and neural signals than the contrast by the number of tonal targets (monotonal vs. bitonal tones). In both conditions, we found stronger structural align-ment in native English speakers, relative to native Chinese speakers. Remarkably, when speech was ignored (Fig. 5d right), native Chinese neural representations did not exhibit any contrast between monotonal and bitonal tones. This could be due to the fact that this contrast is not phonologically relevant in Mandarin Chinese.
4.4. Limitations and future directions
In the present study, we investigated the neural processing of pitch accents at prelexical stages of speech processing. However, prior ERP and behavioral work has shown that pitch accents also play a critical role at later, postlexical stages of linguistic processing (Dimitrova et al., 2012; Lee et al., 2020; Schumacher and Baumann, 2010; Tamaoka et al., 2014). Native speakers of languages with pitch accents rely on the language context to interpret pitch accents (Cutler, 1976). This indicates that the processing of pitch accents results from the integration of in-formation across multiple linguistic domains, including prosody, prag-matics, syntax, and semantics (Cole, 2015; Cole et al., 2019;
Pierrehumbert and Hirschberg, 1990; Wagner and Watson, 2010). Furthermore, pitch accents do not co-occur randomly in the discourse and they can be anticipated to some extent from the sentence context (Cutler, 1976; Bock et al., 1983; Cole et al., 2010; Bishop, 2012; Turn-bull et al., 2017). The ability to predict linguistic features has been shown to optimize the neural coding of these features (Lau et al., 2017;
Hovsepyan et al., 2020). In our study, non-native listeners may have struggled to encode and predict pitch accent features online. The online integration of information across multiple linguistic domains can be very challenging for non-native listeners even after years of immersion (Sorace, 2011). Thus, the non-native processing of pitch accents is challenged by multiple linguistic factors, including the processing of non-native pitch variations, that can impair speech comprehension. Since we did not measure the ability to understand the specific meaning of pitch accents, further research is needed to assess the contribution of each of these factors to non-native speech comprehension deficits.
In a recent ECoG study, Tang et al. (2017) found that the represen-tation of rising-falling pitch contours reflected the encoding of speaker-normalized relative pitch rather than absolute pitch. Interest-ingly, the encoding of pitch contours was shown to be independent of the acoustic envelope. This finding suggests that cortical activity as fast as high gamma can encode speaker-normalized features in the F0 signal. While data for cortical oscillations lower than gamma is scarce, one recent study (Teoh et al., 2019) has found a unique contribution of relative pitch to the EEG delta-phase prediction. Critically, this contri-bution diminished when participants listened to pitch-impoverished stimuli. This finding provides further evidence for the existence of a separate processing stream for prosody, which might operate simulta-neously to the processing of segmental cues and be informed by normalized F0 features. However, the neural mechanism that explains the relationship between normalized F0 features and the time course of the EEG is currently unclear. Since relative changes in the F0 and acoustic envelope often correlate in the speech signal, the encoding of pitch accents might be mediated by the encoding of the acoustic enve-lope. This hypothesis, however, does not explain the encoding of F0 in those cases in which changes in the F0 and the acoustic envelope do not correlate. For example, while the L* accent has a falling-rising pitch that conveys given information, it is also produced with a rising-falling acoustic envelope that conveys prominent information. Furthermore, prior electrophysiology work (Tang et al., 2017; Teoh et al., 2019)
suggest that the F0 and the acoustic envelope are processed at different streams. We conclude that further research is needed to ascertain how relative changes in the periodic signal relate to changes in the amplitude of the EEG signal.
5. Conclusions
It has been shown that, during naturalistic speech processing, continuous speech signals are transformed to categorical representa-tions of segmental units in the temporal lobes (Brodbeck et al., 2018; Yi et al., 2019b). Critically, these transformations are highly influenced by selective attention (Mesgarani and Chang, 2012) and modulated by native language experiences (Feng et al., 2019). Our results show that the transformation of continuous auditory inputs to linguistically rele-vant categories also operates at the suprasegmental or prosodic level. Consistent with prior perceptual work on pitch accents (D’Imperio, 2000, for Neapolitan Italian; Kohler, 1987, and Niebuhr, 2007, for German; Pierrehumbert and Steele, 1989 for English) our results suggest that pitch accents are also encoded as discrete and contrastive categories in the brain. Additionally, we show that the neural processing of pitch accents is strongly influenced by attention and lifelong language-dependent experiences. It is also important to note that speech signals carry multiple, overlapping sources of information that need to be integrated during continuous speech. Because attention is driven by a limited-capacity system, the fact that attention modulates pitch accent processing is evidence that accent information is an important attribute of spoken language processing.
Credit author statement
Fernando Llanos. Conceptualization, Methodology, Software, Formal analysis, Data curation, Writing – original draft, Writing – review & editing, Visualization. James S. German. Conceptualization, Methodol-ogy, Writing – review & editing, Visualization, Funding acquisition. G. Nike Gnanateja. Methodology, Writing – review & editing. Bharath Chandrasekaran. Conceptualization, Methodology, Writing – review & editing, Project administration, Funding acquisition, Supervision
Data and code availability statement
The code and data used in the present study can be accessed in the following public repository: https://zenodo.org/record/4721936#.YI dHxZBKjb1.
Declaration of competing interest
The authors have no conflict of interests to declare.
Acknowledgements
We thank Rachel Reetzke for her contribution to data collection. We thank Diyana Hamzah and Charmaine Hon for work on manual correction of the force alignment. We thank Julie McGory for the ToBI labeling. This study was funded by the National Institute on Deafness and Other Communication Disorders of the National Institutes of Health [R01DC015504 (BC)] and was partially supported by grants ANR-16- CONV-0002 (ILCB) and the Excellence Initiative of Aix-Marseille Uni-versity (A*MIDEX).
References
Alexandrou, A.M., Saarinen, T., Kujala, J., Salmelin, R., 2020. Cortical entrainment: what we can learn from studying naturalistic speech perception. Language, Cognition and Neuroscience 35 (6), 681–693.
B¨anziger, T., Scherer, K.R., 2005. The role of intonation in emotional expressions. Speech Commun. 46 (3–4), 252–267.
Beckman, M.E., Ayers, G., 1997. Guidelines for ToBI labelling, 3. The OSU Research Foundation, p. 30.
Beckman, M.E., Hirschberg, J., 1994. The ToBI Annotation Conventions. Doctoral Dissertation. The Ohio State University.
Beckman, M.E., Pierrehumbert, J.B., 1986. Intonational structure in Japanese and English. Phonology 3, 255–309.
Bishop, J., 2012. Information structural expectations in the perception of prosodic prominence. In: Elordieta, G., Prieto, P. (Eds.), Prosody and Meaning. Mouton de Gruyter, pp. 239–270.
Bock, J.K., Mazzella, J.R., 1983. Intonational marking of given and new information: some consequences for comprehension. Mem. Cognit. 11, 64–76.
Boersma, P., Weenink, D., 2018. Praat: Doing Phonetics by Computer [Computer Program]. Version 6.0. 37. Http://Www. Praat. Org/. (Accessed 14 March 2018).
Boˇril, T., Skarnitzl, R., 2016. September). Tools rPraat and mPraat. In: International Conference on Text, Speech, and Dialogue. Springer, pp. 367–374.
Brodbeck, C., Hong, L.E., Simon, J.Z., 2018. Rapid transformation from auditory to linguistic representations of continuous speech. Curr. Biol. 28 (24), 3976–3983.
Cavanagh, J.F., Frank, M.J., Klein, T.J., Allen, J.J., 2010. Frontal theta links prediction errors to behavioral adaptation in reinforcement learning. Neuroimage 49 (4), 3198–3209.
Chandrasekaran, B., Gandour, J.T., Krishnan, A., 2007. Neuroplasticity in the processing of pitch dimensions: a multidimensional scaling analysis of the mismatch negativity. Restor. Neurol. Neurosci. 25, 195–210.
Cole, J., 2015. Prosody in context: a review. Language, Cognition and Neuroscience 30 (1–2), 1–31.
Cole, J., Hualde, J.I., Smith, C.L., Eager, C., Mahrt, T., Napole˜ao de Souza, R., 2019. Sound, structure and meaning: the bases of prominence ratings in English, French and Spanish. J. Phonetics 75, 113–147.
Cole, J., Mo, Y., Hasegawa-Johnson, M., 2010. Signal-based and expectation-based factors in the perception of prosodic prominence. Lab. Phonol. 1, 425–452.
Cutler, A., 1976. Phoneme-monitoring reaction time as a function of preceding intonation contour. Percept. Psychophys. 20 (1), 55–60.
Delorme, A., Makeig, S., 2004. EEGLAB: an open-source toolbox for analysis of single- trial EEG dynamics. J. Neurosci. Methods 134, 9, 2.
Di Liberto, G.M., O’Sullivan, J.A., Lalor, E.C., 2015. Low-frequency cortical entrainment to speech reflects phoneme-level processing. Curr. Biol. 25 (19), 2457–2465.
Dilley, L.C., 2005. The Phonetics and Phonology of Tonal Systems. Doctoral Dissertation. Massachusetts Institute of Technology.
Dimitrova, D.V., Stowe, L.A., Redeker, G., Hoeks, J.C.J., 2012. Less is not more: neural responses to missing and superfluous accents in context. J. Cognit. Neurosci. 24 (12), 2400–2418.
D’Imperio, M., 2000. The role of perception in defining tonal targets and their alignment. Doctoral Dissertation. The Ohio State University.
Feng, G., Yi, H.G., Chandrasekaran, B., 2019. The role of the human auditory corticostriatal network in speech learning. Cerebr. Cortex 29 (10), 4077–4089.
Gandour, J.T., 1978. II - the perception of tone. In: Fromkin, V.A. (Ed.), Tone: A Linguistics Survey. Academic Press, pp. 41–76.
Gandour, J., Wong, D., Dzemidzic, M., Lowe, M., Tong, Y., Li, X., 2003. A cross-linguistic fMRI study of perception of intonation and emotion in Chinese. Hum. Brain Mapp. 18 (3), 149–157.
Garrido, M.I., Friston, K.J., Kiebel, S.J., Stephan, K.E., Baldeweg, T., Kilner, J.M., 2008. The functional anatomy of the MMN: a DCM study of the roving paradigm. Neuroimage 42 (2), 936–944.
Gordon, M., Roettger, T., 2017. Acoustic correlates of word stress: a cross-linguistic survey. Linguistics Vanguard 3 (1).
Gussenhoven, C., Repp, B.H., Rietveld, A., Rump, H.H., Terken, J., 1997. The perceptual prominence of fundamental frequency peaks. J. Acoust. Soc. Am. 102 (5), 3009–3022.
Gussenhoven, C., 2004. The Phonology of Tone and Intonation. Cambridge University Press.
Hamilton, L.S., Huth, A.G., 2020. The revolution will not be controlled: natural stimuli in speech neuroscience. Language, Cognition and Neuroscience 35 (5), 573–582.
Hickok, G., Poeppel, D., 2007. The cortical organization of speech processing. Nat. Rev. Neurosci. 8 (5), 393–402.
Hovsepyan, S., Olasagasti, I., Giraud, A.L., 2020. Combining predictive coding and neural oscillations enables online syllable recognition in natural speech. Nat. Commun. 11 (1), 1–12.
Kaufman, A.S., 2004. Kaufman Brief Intelligence Test– (KBIT-2), second ed. American Guidance Service, Circle Pines, MN.
Khalighinejad, B., Silva, G. C. da, Mesgarani, N., 2017. Dynamic encoding of acoustic features in neural responses to continuous speech. J. Neurosci. 37 (8), 2176–2185. Kohler, K. J. (1987). Categorical pitch perception. Proceedings of the XIth International Congress of Phonetic Sciences (Vol. 5, Pp. 331-333). Tallinn: Academy of Sciences of the Estonian Soviet Socialist Republic.
Krishnan, A., Xu, Y., Gandour, J., Cariani, P., 2005. Encoding of pitch in the human brainstem is sensitive to language experience. Cognit. Brain Res. 25 (1), 161–168.
Ladd, D.R., 2008. Intonational Phonology. Cambridge University Press.
Lau, J.C., Wong, P.C., Chandrasekaran, B., 2017. Context-dependent plasticity in the subcortical encoding of linguistic pitch patterns. J. Neurophysiol. 117 (2), 594–603.
Lee, A., Perdomo, M., Kaan, E., 2020. Native and second-language processing of contrastive pitch accent: an ERP study. Sec. Lang. Res. 36 (4), 503–527.
Leonard, M.K., Baud, M.O., Sjerps, M.J., Chang, E.F., 2016. Perceptual restoration of masked speech in human cortex. Nat. Commun. 7 (1), 13619.
Li, X., Yang, Y., Hagoort, P., 2008. Pitch accent and lexical tone processing in Chinese discourse comprehension: an ERP study. Brain Res. 1222, 192–200.