HAL Id: hal-00629158
https://hal.archives-ouvertes.fr/hal-00629158
Submitted on 5 Oct 2011HAL is a multi-disciplinary open access
archive for the deposit and dissemination of sci-entific research documents, whether they are pub-lished or not. The documents may come from teaching and research institutions in France or
L’archive ouverte pluridisciplinaire HAL, est destinée au dépôt et à la diffusion de documents scientifiques de niveau recherche, publiés ou non, émanant des établissements d’enseignement et de recherche français ou étrangers, des laboratoires
Three dimensional reconstruction of aerogels from TEM
images
Nathalie Olivi-Tran, Florence Despetis, Nadjette Bengourna, Bérangère
Lartigue, Sandra Spagnol
To cite this version:
Nathalie Olivi-Tran, Florence Despetis, Nadjette Bengourna, Bérangère Lartigue, Sandra Spagnol. Three dimensional reconstruction of aerogels from TEM images. Journal of Non-Crystalline Solids, Elsevier, 2012, 358 (9), pp.1180-1184. �10.1016/j.jnoncrysol.2012.02.018�. �hal-00629158�
Three dimensional reconstruction of aerogels from TEM images
Florence Despetis1,2 ,Nadjette Bengourna1,2 , Berangere Lartigue3 , Sandra Spagnol3and Nathalie Olivi-Tran1,2 1
Universite Montpellier 2, Laboratoire Charles Coulomb UMR 5221, CC 074, place E.Bataillon, F-34095, Montpellier, France
2
CNRS, Laboratoire Charles Coulomb UMR 5221, CC 074, place E.Bataillon, F-34095, Montpellier, France
3
Laboratoire PHASE, Universite Paul Sabatier,118, route de Narbonne 31062 Toulouse cedex 9 , France
(Dated: September 26, 2011)
Abstract
The knowledge of the internal structure of porous materials is of main importance to compute their physical properties. We focus here on base catalyzed and colloidal silica aerogels, which are fractal materials and we use an original method for the reconstruction of these aerogels from TEM images. The method used is iterative and leads to the same fractal dimension as the real material, computed from the internal two point correlation function.
INTRODUCTION
Aerogels are light porous and often fractal materials. Presently, they are used for the building insulation, and in the past years they were synthesized in high purity or doped silica glasses, Cerenkov counters... Therefore, the modeling of the structure of such materials has been of main importance in order to understand their physical properties [1].
In the end of the 90’s , the works of Torquato et al [2–4] and Levitz et al. [5, 6] re-sulted in the statistical modeling of porous materials from TEM (Transmission Electronic Microscopy). Yet, their studies are mainly focused on the modeling of the porosity of the material and not of the distribution of matter. In fact, their modeling is statistical or half statistical (from 2D images: cuts) but conserves the physical properties of the whole material.
More recently several authors also modeled porous materials such as sandstones, ultra-filtration cakes,etc. [7–9] . These reconstructions remain statistical and no research has addressed fractal materials.
Here, our method allows us to model the structures of three kinds of silica aerogels (two base catalyzed silica aerogels of different densities and one colloidal aerogel) directly from their TEM (Transmisson Electron Microscopy). This is an alternative method to model base catalyzed aerogels [10, 11]. We prove, after the reconstruction (first stage), by calculating the two point correlation function of the matter distribution inside the sample that the fractal dimension D of the sample and of the numerical reconstructed model are the same. The question whether the reconstruction is almost quantitative or remains statistical is discussed at the end of this paper taking account the pore distribution (second stage).
EXPERIMENTAL PROCESS
The synthesis of base catalyzed aerogels is well known by now [12]. We will recall here the main chemical characteristics for the preparation of our aerogels samples (TEOS issued and Ludox issued and base catalyzed).
Three aerogels were synthesized using two different methods. Samples B35 and B100 were obtained from standard hydrolysis and polycondensation reactions of tetramethylorthosil-icate (T M OS) diluted in ethanol. They are labelled B for basic hydrolysis conditions
(N H4OH 10− 2
N ). The third sample L475 was issued from a commercial colloidal silica so-lution called Ludox LS (TM) consisting of spherical particles of about 14 nm size. Gelation is performed by adding hydrochloric acid aqueous solution. After the alcohol supercritical drying treatment the density of aerogels is respectively 0.35g/cm3
, 0.1g/cm3
and 0.475g/cm3
with an accuracy of ±0.05g/cm3
.
For the TEM imaging, aerogels were crushed in ethanol and suspension put down on carbon film supported by a 300 mesh copper grid. In the TEM images, the darkness cor-responds to the quantity of matter at the corresponding location on the image. Only the samples with the lowest thickness lead to an image which could be exploited. Indeed, for large thicknesses, the electronic flux lead to dark images with no contrast regarding different thickness within the sample itself.
We have to add that we used only base catalyzed (B35 and B100) and colloidal (LS) aerogels because we observed no structural evolution during the samples expositions to the electronic flux of the TEM: the TEM images were focused and did not evolve neither in position nor in contrast. In contrast, we tried to analyze by TEM images the structure of acid catalyzed and neutral catalyzed silica aerogels, but the TEM images were out of focus and the samples were moving under the electronic flux, meaning that there was a rearrangement of matter within the sample. The fact that colloidal and base catalyzed silica aerogels have a minimal characteristic thickness of their branches (particles) larger than the other cited types of silica aerogels explains that the samples studied here are stable even during exposure to an electronic flux.
NUMERICAL PROCESS
Image processing
We analyzed the TEM image of the base catalyzed aerogel. The first step is to mesh the photography for which we use the scale of the image and the mean size of the particles composing the aerogel on the TEM photography.
We choose a section of the image where the particles do not overlap too much (i.e. the depth of the sample is not too large) and we slide the boundaries of the image section so that at least one particle per boundary touches it. Once we have cut this section of the
photography, we mesh it, each square of the mesh having an edge lower or equal to the size of one particle.
Now we have a square meshed image of part of the aerogel. As the original image is in the TIFF format, we transform it in another format (ASCII PNM) where each mesh is associated to an integer: this number gives the greyscale of the mesh (from 0 to 255). Knowing that each mesh corresponds approximately to one particle or more particles having the same x and y coordinates, we are able to deduce from the greyscale the number of particles which are on the same vertical line on the same mesh. In our model, we made the hypothesis that two particles at most are on the same vertical line in the z direction (depth). Therefore , we set a threshold in the greyscale: if a mesh has a greyscale below the threshold it corresponds to only one voxel (pixel in 3d) with a z coordinate corresponding to the greyscale but if it is above the threshold, it corresponds to two voxels on the same vertical line where the depth of each voxel corresponds to respectively 1/3 and 2/3 of its greyscale (the darker the deeper).
Analysis of the three-dimensional structure via fractal laws
To obtain a structure which has the same fractal characteristics as the real aerogels, we used an iterative process. The point here is to adjust the threshold in the greyscale in order, first, to remove the background of the TEM image and second, to obtain a fractal dimension enclosed between 1.8 and 2 (fractal dimension of the experimental samples [12].
We start by considering the two points correlation function for the voxels
g(r) =< n(r0)n(r0+ r) >0 (1)
This function defines how many voxels can be found at a distance r from a voxel at r0.
For random fractals, one may also average the two point correlation functions over different realizations of the whole pattern. We made this last and we averaged the results over three sections coming from three different TEM images of the same original sample. By integrating equation (1), we obtain a relation between average volume (i.e. the aera of the TEM image multiplied by the computed depth in voxels) and length scale. For a homogeneous fractal of fractal dimension D this is :
N (R) =
Z R 0
So by computing the two points correlation function and by integrating it, we can obtain the fractal dimension D of the three dimensional reconstructed structure. If the fractal dimension D is not in the correct range, we lower or increase the threshold (which modifies the depth and also the average volume). This allows us to verify that our reconstruction is statistically exact.
RESULTS AND DISCUSSION
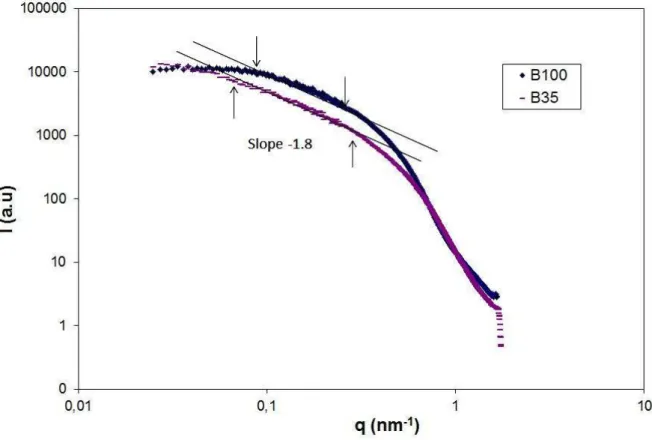
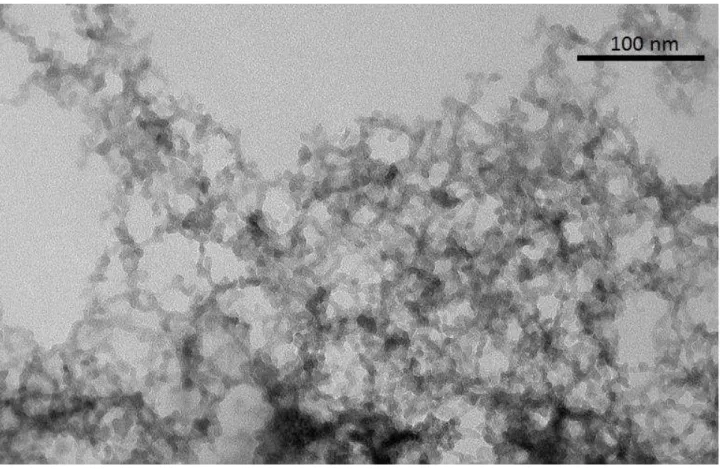
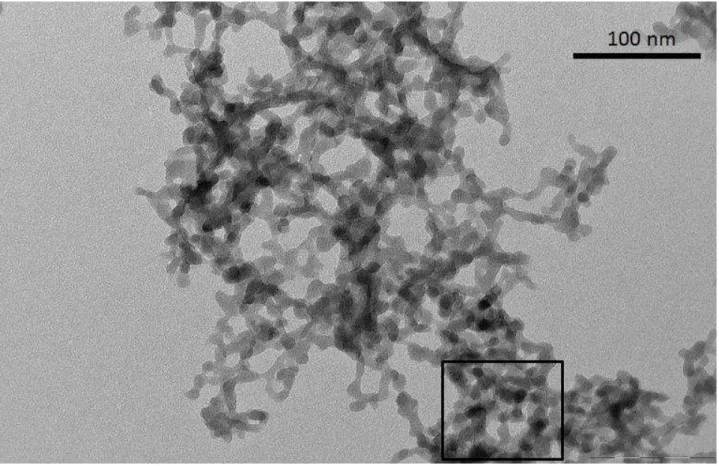
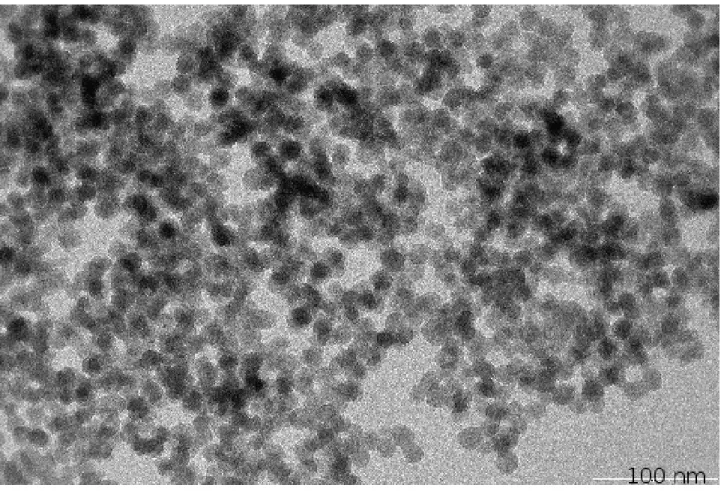
Figure 1 is the Small Angle XRay Scattering (SAXS) graph for our B35 and B100 sam-ples. The slope of the fractal domain (between the arrows) gives the fractal dimension D = 1.8. For the LS475 sample, we redirect the reader to ref. [12]. We present the TEM images for three different types of aerogels: B35, B100 and LS475. These TEM images are presented in figures 2,3 and 4.
Figure 5 (left) is an example of the section (see the black square in fig.3) of the preceding images that we chose to analyze (in this case it is the base catalyzed aerogel of density 0.100g.cm−3 : B100). The corresponding meshed image is presented in figure 5 (right). One
may see that each mesh corresponds to roughly one particle in size and location except that, as meshes are placed on-lattice, it may occur that one real particle may be shared by two meshes.
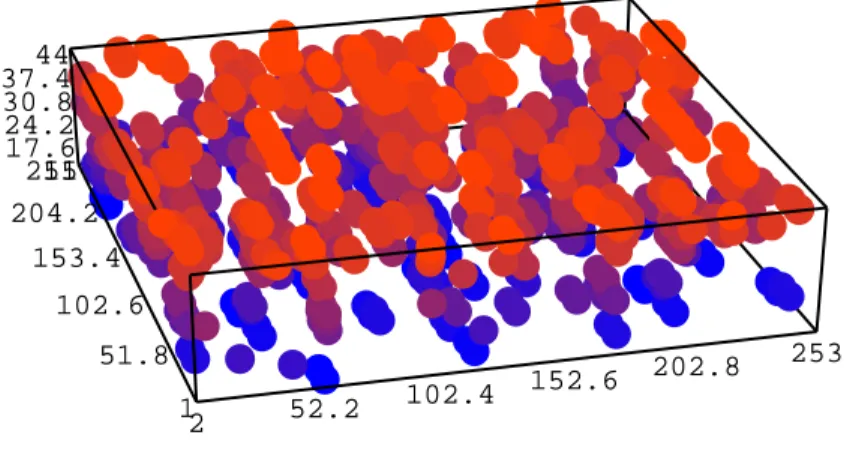
It is clear from figure 5 that there is a greyscale. After analyzing this greyscale, as presented in section II, we obtain a reconstructed image of a small piece of aerogel in figure 6. The reconstructed image has a low depth as explained in section II.
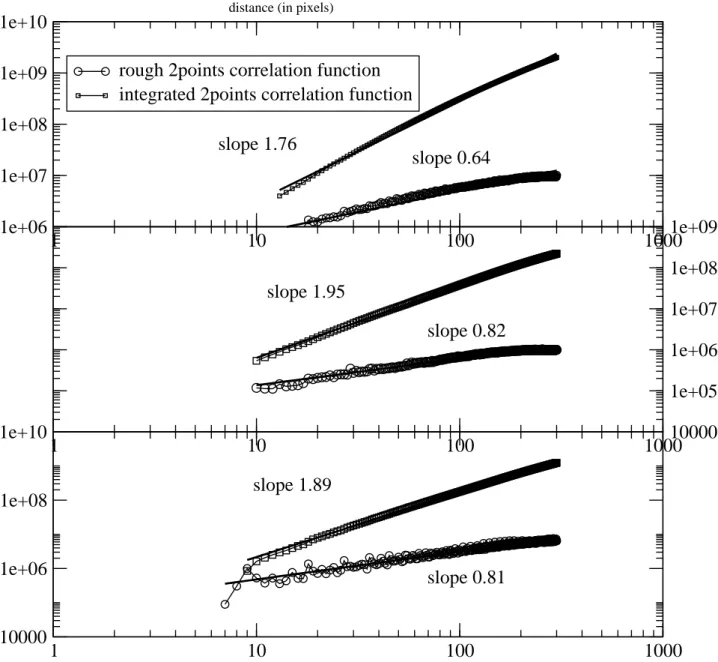
As it is difficult to obtain the same fractal character as the real aerogel from a recon-structed image, we computed the two points correlation functions (as shown in previous section) on the coordinates of each reconstructed particles (i.e. the coordinates correspond-ing to the voxels which represent the particles). Figure 7 shows an example the two point correlation functions for the three types of aerogels that we used.
The fractal dimensions obtained from these correlation functions and after averaging over three different results from three different TEM images are:
• Base catalyzed aerogels of 0.035g.cm−3 ±0.005g.cm−3 density (B35): the computed
• Base catalyzed aerogels of 0.100g.cm−3±0.005g.cm−3 density (B100): the computed
fractal dimension D = 1.8 ± 0.5
• Ludox base catalyzed aerogels of 0.450g.cm−3 ±0.005g.cm−3 (LS45): the computed
fractal dimension D = 1.85 ± 0.5
It is worth noticing that, as we use the coordinates of the voxels to compute the two point correlation function, we may directly compare it with the pore chord distribution function. As a hypothesis, this implies that the surface of the pores is smooth and that their are no necks between the particles (which is obviously not the case here, but this is a hypothesis) . Following Levitz [13, 14], the pore chord distribution may be defined as the number of segments linking two particles composing the aerogel as a function of the segment length r. If the material has a fractal distribution of mass (which is the case for our materials), the pore chord distribution scales as [13–17]:
f (R) ∝ 1
RD−1 (3)
As we used the fractal dimensions D of our samples as a parameter, it is easy to obtain the pore chord distribution. This may simply lead to the permeability of our samples [13–17]. We have to say that the permeability of such materials cannot be found in literature, so we cannot compare our numerical results to experimental data.
As a conclusion to the discussion, we may say that no one made an exact reconstruction of a fractal material. Our reconstruction method is half statistical . We may say that:
• the greyscale gives the number of particles on the same vertical line and their statistical depths
• we used no dilation of the depths
• the previous point shows that there is only an indeterminacy on the z direction of the voxel coordinates
CONCLUSION
We used a new method to reconstruct base catalyzed and colloidal types of silica aerogels which may be used for other fractal materials. Here, we did not focus on the pore network
although it is possible (as we wrote it) to compare with the pore distribution. Our method allows us to obtain directly the distribution of matter from a TEM image.
We made TEM images of base catalyzed and colloidal silica. Using an iterative numerical technique on these images taking account of the fractal dimension of the experimental sam-ples (well known in the literature) we obtained three dimensional reconstructed samsam-ples of our silica aerogels. This opens new possibilities to compute the internal structure of fractal porous materials and therefore to model their physical properties.
[1] S.Spagnol, B.Lartigue, A.Trombe, V.Gibiat, Europhys. Lett. 78 (2007) 46005 [2] D.Cule, S.Torquato, J.of Appl. Phys. 86 (1999)3428
[3] CLY. Yeong, S.Torquato, Phys. Rev. E, 58 (1998) 224 [4] CLY. Yeong, S.Torquato, Phys. Rev. E, 57 (1998) 495
[5] P.Levitz,G.Ehret, S.K.Sinha, J.M.Drake,J.Chem.Phys. 95 (1991) 6151 [6] P. Levitz Adv. Colloid Interface Sci. 76-77 (1998) 71
[7] C.Manwart, S.Torquato, R.Hilfer, Phys.Rev E 62 (2000) 893 [8] F.Bourgeois, F.Courteille, Chem.Eng.TEchnol. 33 (2010) 1290
[9] M.G.Politis, E.S.Kikkinides, M.E.Kainourgiakis, A.K.Stubos, Microporous and Mesoporous Materials 110 (2008) 92
[10] M.Kolb,R.Botet, R.Jullien, Phys.Rev.Lett. 51 (1983) 1123 [11] P.Meakin, Phys.Rev.Lett. 51 (1983) 1119
[12] C.J.Brinker and G.W.Scherer, Sol gel science: The Physics and Chemistry of Sol-Gel process-ing, Academic Press (1989) Elsevier Science (USA)
[13] P.Levitz,Europhys.LEtt. 39 (1997) 593 [14] P.Levitz, J.Phys.Chem 97 (1993) 3813
[15] A.Hasmy,N.Olivi-Tran, R.Jullien, J.Phys. Condens.Matter 10 (1998) 4947 [16] N.Olivi-Tran, A.Hasmy, J.Phys.Condens.Matter 11 (1999) 7971
FIG. 1. Small Angle XRay Scattering graph for B35 and B100 aerogels corresponding to our samples. The slope of the fractal domain gives the fractal dimension D = 1.8. For the LS475 (Ludox) sample see ref. [12]
FIG. 4. TEM image of a LS475 aerogel
15 20 25 30 35 40 25511 17.6 24.2 30.8 37.444 204.2 153.4 102.6 253 202.8 51.8 152.6 102.4 52.2 2 1
1
10
100
1000
1e+06
1e+07
1e+08
1e+09
1e+10
rough 2points correlation function
integrated 2points correlation function
1
10
100
1000
10000
1e+05
1e+06
1e+07
1e+08
1e+09
1
10
100
1000
10000
1e+06
1e+08
1e+10
slope 1.76
slope 0.64
slope 1.95
slope 0.82
slope 1.89
slope 0.81
distance (in pixels)FIG. 7. Example of rough (corresponding to eq. (1)) and integrated (corresponding to eq.(2)) two points correlation functions where the distances are in pixels (edge of a voxel). Upper graph: B35, Middle graph: B100, Bottom graph: LS475