HAL Id: hal-00297815
https://hal.archives-ouvertes.fr/hal-00297815
Submitted on 29 Jun 2006HAL is a multi-disciplinary open access
archive for the deposit and dissemination of sci-entific research documents, whether they are pub-lished or not. The documents may come from teaching and research institutions in France or abroad, or from public or private research centers.
L’archive ouverte pluridisciplinaire HAL, est destinée au dépôt et à la diffusion de documents scientifiques de niveau recherche, publiés ou non, émanant des établissements d’enseignement et de recherche français ou étrangers, des laboratoires publics ou privés.
Nitrogen load and forest type determine the soil
emission of nitrogen oxides (NO and N2O)
K. Pilegaard, U. Skiba, P. Ambus, C. Beier, N. Brüggemann, K.
Butterbach-Bahl, J. Dick, J. Dorsey, J. Duyzer, M. Gallagher, et al.
To cite this version:
K. Pilegaard, U. Skiba, P. Ambus, C. Beier, N. Brüggemann, et al.. Nitrogen load and forest type determine the soil emission of nitrogen oxides (NO and N2O). Biogeosciences Discussions, European Geosciences Union, 2006, 3 (3), pp.837-869. �hal-00297815�
BGD
3, 837–869, 2006Emission of NO and
N2O from forest soils
K. Pilegaard et al. Title Page Abstract Introduction Conclusions References Tables Figures J I J I Back Close
Full Screen / Esc
Printer-friendly Version
Interactive Discussion
EGU
Biogeosciences Discuss., 3, 837–869, 2006 www.biogeosciences-discuss.net/3/837/2006/ © Author(s) 2006. This work is licensed under a Creative Commons License.
Biogeosciences Discussions
Biogeosciences Discussions is the access reviewed discussion forum of Biogeosciences
Nitrogen load and forest type determine
the soil emission of nitrogen oxides (NO
and N
2
O)
K. Pilegaard1, U. Skiba2, P. Ambus1, C. Beier1, N. Br ¨uggemann3,
K. Butterbach-Bahl3, J. Dick2, J. Dorsey4, J. Duyzer5, M. Gallagher4, R. Gasche3, L. Horvath6, B. Kitzler7, A. Leip8, M. K. Pihlatie9, P. Rosenkranz3, G. Seufert8, T. Vesala9, H. Westrate5, and S. Zechmeister-Boltenstern7
1
Biosystems Department, Risø National Laboratory, Roskilde, Denmark 2
Centre of Ecology and Hydrology, Penicuik, Scotland 3
Institute for Meteorology and Climate Research, Karlsruhe Research Centre, Garmisch-Partenkirchen, Germany
4
UMIST, Manchester, England 5
Netherlands Organization for Applied Research, Apeldoorn, The Netherlands 6
Hungarian Meteorological Service, Budapest, Hungary 7
BGD
3, 837–869, 2006Emission of NO and
N2O from forest soils
K. Pilegaard et al. Title Page Abstract Introduction Conclusions References Tables Figures J I J I Back Close
Full Screen / Esc
Printer-friendly Version
Interactive Discussion
EGU
8
Joint Research Centre, Ispra, Italy 9
Department of Physical sciences, University of Helsinki, Finland
Received: 3 May 2006 – Accepted: 22 May 2006 – Published: 29 June 2006 Correspondence to: K. Pilegaard ([email protected])
BGD
3, 837–869, 2006Emission of NO and
N2O from forest soils
K. Pilegaard et al. Title Page Abstract Introduction Conclusions References Tables Figures J I J I Back Close
Full Screen / Esc
Printer-friendly Version
Interactive Discussion
EGU Abstract
Soil emissions of NO and N2O were measured continuously at high frequency for more than one year at 15 European forest sites as part of the EU-funded project NOFRETETE. The locations represent different forest types (coniferous/deciduous) and different nitrogen loads. Geographically they range from Finland in the north to
5
Italy in the south and from Hungary in the east to Scotland in the west.
The highest NO emissions were observed from coniferous forests, whereas the low-est NO emissions were observed from deciduous forlow-ests. The NO emissions from coniferous forests were highly correlated with N-deposition. The site with the high-est average annual emission (82 µg NO-N m−2h−1) was a spruce forest in
South-10
Germany (H ¨oglwald) receiving an annual N-deposition of 2.9 g m−2. NO emissions close to the detection limit were observed from a pine forest in Finland where the N-deposition was 0.2 g N m−2y−1. No significant correlation between N2O emission and N-deposition was found. The highest average annual N2O emission (20 µg N2 O-N m−2h−1) was found in an oak forest in the M ´atra mountains (Hungary) receiving an
15
annual N-deposition of 1.6 g m−2. N2O emission was significantly negatively correlated with the C/N ratio.
The difference in N-oxide emissions from soils of coniferous and deciduous forests may partly be explained by differences in N-deposition rates and partly by difference in characteristics of the litter layer and soil. NO was mainly derived from nitrification
20
whereas N2O was mainly derived from denitrification. In general, soil moisture is lower at coniferous sites (at least during spring time) and the litter layer of coniferous forests is thick and well aerated favouring nitrification and thus release of NO. Conversely, the higher rates of denitrification in deciduous forests due to a compact and moist litter layer lead to N2O production and NO consumption in the soil.
25
The two factors soil moisture and soil temperature are often explaining most of the temporal variation within a site. When comparing annual emissions on a regional scale, however, factors such as nitrogen deposition and forest and soil type become much
BGD
3, 837–869, 2006Emission of NO and
N2O from forest soils
K. Pilegaard et al. Title Page Abstract Introduction Conclusions References Tables Figures J I J I Back Close
Full Screen / Esc
Printer-friendly Version
Interactive Discussion
EGU
more important.
1 Introduction
Increasing emissions of N-oxides from combustion processes and NH3-volatilisation from agriculture have led to an increase of N-deposition in Europe during the last decades. Atmospheric N-deposition is estimated to be at least 0.5 g N m−2y−1 in
5
most parts of Europe, in central Europe significantly above 2 g N m−2y−1 (
Umwelt-bundesamt, 1997), and in The Netherlands, parts of Northern Germany, and UK up to 5 g N m−2y−1 (e.g.van der Eerden et al.,1998). As a result, natural ecosystems, especially forests which have a huge filtering capacity, receive an N-fertilization equiv-alent to approx. 15% of N-fertilizer input to arable land (Kristensen et al.,2004). Due
10
to this high atmospheric N-deposition the N-status of forest ecosystems is changing from naturally N-limited to N-saturated (Aber et al.,1989;Dise and Wright,1995;Fenn
et al.,1998). Nitrogen saturation of forest ecosystems has serious environmental con-sequences by changing the soil chemistry, forest composition and productivity, and by altering the fluxes of radiatively active trace gases (e.g. NO, N2O, CO2, CH4) (Aber,
15
1992; Butterbach-Bahl et al., 1997; Priha and Smolander, 1995). The improved
N-availability in forest soils has been shown to reduce C/N-ratios in leaves and litter (Magill et al., 1997) and, at least initially, has stimulated tree growth and forest pro-ductivity (Beck, 1996). Increased atmospheric N-deposition is a matter of concern, as it can change the ground vegetation (increasing dominance of nitrophilic species)
20
(e.g.Hofmann, 1995; Pitcairn et al., 2002); decrease forest vitality (induction of nu-trient imbalances) (e.g.Schulze,1989); accelerate soil acidification due to increased nitrification (e.g.Kreutzer and Weiss,1998); and increase losses of N to the environ-ment in form of N-leaching to the groundwater (e.g.Kreutzer,1995) and/or in form of N-gas emissions (N2O, NO, N2) into the atmosphere (e.g.Butterbach-Bahl et al.,1997;
25
Pilegaard et al.,1999;van Dijk and Duyzer,1999;Skiba et al.,1998).
BGD
3, 837–869, 2006Emission of NO and
N2O from forest soils
K. Pilegaard et al. Title Page Abstract Introduction Conclusions References Tables Figures J I J I Back Close
Full Screen / Esc
Printer-friendly Version
Interactive Discussion
EGU
oxide (NO) and nitrogen dioxide (NO2) play an important role by affecting the oxidising capacity of the troposphere (NO and NO2), by affecting ecosystems through deposition (NO2and derivates) or by acting as a greenhouse gas (N2O).
Forests cover a large part of the European continent (approx. 35%), but the ex-change of nitrogen oxides (NO, N2O and NO2) has so far only been investigated in a
5
few European forests. These studies in N-affected forests in Central (Butterbach-Bahl
et al.,1997;van Dijk and Duyzer,1999;Brumme and Beese,1992;Gasche and
Pa-pen,1999) and Northern Europe (Pilegaard et al.,1999;Skiba et al.,1998) have shown that European forests have a much higher NO and N2O emission than other temperate forests in the world (Williams et al.,1992;Castro et al.,1993). It has been suggested
10
that the high emissions found in European forests are due to the high atmospheric N-input to these forests. The contribution of oxidised and reduced nitrogen species to the total deposition varies according to location, and is dominated by NH3 in intensively farmed countries (e.g. The Netherlands), but by oxidised species in the remote parts of Europe. Comparing earlier results from forest sites with different N-input and studies
15
of NO and N2O emission at various distances from poultry and pig farms support this hypothesis (Skiba et al.,1998).
The limited information on the impact of anthropogenic influences like e.g. atmo-spheric N-deposition on N-trace gas emissions from forest soils, the limited number of field studies, restricted temporal coverage of field measurements and the lack of
infor-20
mation on the effect of forest types on the magnitude of N-oxides emissions from forest ecosystems are the reasons why the contribution of forest ecosystems to regional and global budgets of atmospheric N2O and NO still have a high degree of uncertainty.
NO and N2O emissions are known to vary considerably with both soil temperature and soil moisture and are therefore strong functions of climate (Smith et al., 1998;
25
Pilegaard et al., 2001). However, the relationships are not simple and not the same
for NO and N2O. It is therefore important to study these relationships over a range of climates at long time-scales to cover different seasons for each locality.
BGD
3, 837–869, 2006Emission of NO and
N2O from forest soils
K. Pilegaard et al. Title Page Abstract Introduction Conclusions References Tables Figures J I J I Back Close
Full Screen / Esc
Printer-friendly Version
Interactive Discussion
EGU
emissions at 15 different forest sites as part of the EU-funded project NOFRETETE. The measurements were made by chamber methods, either by manual measurements or by fully automated systems at a high frequency (up to hourly) throughout at least an entire year. Emission measurements were carried out using either the dynamic (NO) or the static chamber (N2O) technique. The locations chosen include different
5
types of forests (coniferous and deciduous) in different European climates, ranging from boreal to temperate continental forests and from Atlantic to Mediterranean forests. Furthermore the sites differ in atmospheric N-deposition ranging from low deposition (0.2 g N m−2y−1) to high deposition ( 4 g N m−2y−1). We relate annual emissions of NO and N2O to the main parameters soil temperature, soil moisture, C/N ratio, pH,
10
nitrogen deposition, and stand age. Temporal variation throughout the year is not dealt with here, but will be treated in site-specific papers (e.g. Ferr ´e et al.,2005; Horv ´ath
et al.,2005;Kitzler et al.,2005a,b;Rosenkranz et al.,2006).
2 Materials and methods
2.1 Sites
15
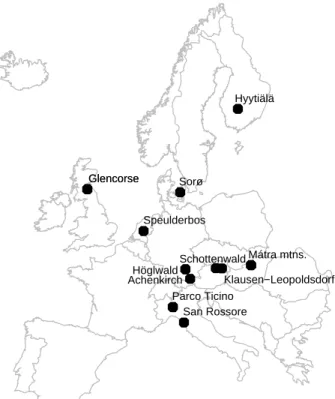
An overview of the 15 forest sites is given in Table1and Fig. 1 and some characteris-tics of the sites is given in Table2. The sites range from Finland in the north to Italy in the south and from Scotland in the west to Hungary in the east. The sites investigated represent different forest types:
Coniferous forests: Scots pine (Pinus silvestris), Finland; Sitka spruce (Picea
20
sitch ´ensis), Scotland; Norway spruce (Picea abies), Germany, Austria, Hungary; Dou-glas fir (Pseudotsuga menzi ´esii viridis), The Netherlands; Mediterranean pine (Pinus pinaster ), Italy.
Deciduous forests: birch (Betula pub ´escens), Scotland; beech (Fagus sylvatica), Denmark, Germany, Austria; sessile oak (Quercus petraea), Hungary; poplar (Populus
25
BGD
3, 837–869, 2006Emission of NO and
N2O from forest soils
K. Pilegaard et al. Title Page Abstract Introduction Conclusions References Tables Figures J I J I Back Close
Full Screen / Esc
Printer-friendly Version
Interactive Discussion
EGU
white willow (Salix alba), and common alder (Alnus glutinosa), Italy.
At three locations, Glencorse (Scotland), H ¨oglwald (Germany), and M ´atra mountains (Hungary) both coniferous and deciduous forest sites were investigated.
2.2 Flux measurements
The soil emissions of NO and N2O were measured with the chamber technique (e.g.
5
Butterbach-Bahl et al.,1997;Pilegaard et al.,1999;van Dijk and Duyzer,1999). NO was measured with dynamic chambers and the flux was estimated by comparing the steady-state concentration in the chamber with a reference measurement or by using the full mass balance equation (Altimir et al.,2002). In some cases the reference mea-surement was made in a chamber similar to the meamea-surement chambers but shielded
10
from the soil with a cover of the same material; in other cases the reference measure-ment was made of the incoming ambient air and corrections for wall losses in chamber and tubes were made. NO was analysed by chemiluminescence technique. Because O3interacts with the NO emitted from the soil it was analysed simultaneously and any loss of NO due to this reaction was corrected for (Remde et al.,1993). N2O was
mea-15
sured using manual and/or automatic static chambers. Headspace N2O concentrations were analysed by gas chromatography (electron capture detector) either in the field or in the laboratory.
Characteristics of the chamber systems applied for flux measurements at the di ffer-ent sites are given for NO in Table 3and for N2O in Table 4. The use of a reference
20
chamber is indicated by “+1” in the column giving the number of chambers simultane-ously in use. The chambers were mounted on frames previsimultane-ously inserted into the soil. At some sites chambers were moved among different sets of frames, indicated in Ta-bles3and4by a larger number of frames than chambers. The tables give references to the specific methods applied at each site.
BGD
3, 837–869, 2006Emission of NO and
N2O from forest soils
K. Pilegaard et al. Title Page Abstract Introduction Conclusions References Tables Figures J I J I Back Close
Full Screen / Esc
Printer-friendly Version
Interactive Discussion
EGU
2.3 Additional measurements
Nitrogen deposition was measured by analysing concentrations of NO−3 and NH+4 in throughfall collected with a large number of funnels or with specially designed through-fall collectors. In deciduous forests stem-flow was also collected and analysed for NO−3 and NH+4 concentrations and the values were added to the throughfall to give the input
5
to the forest floor. Soil moisture was measured by TDR probes and soil temperature by thermocouples. C/N ratio, pH, and bulk density (for calculation of water filled pore space, WFPS) was measured in the upper 0–5 cm of the mineral soil.
2.4 Data analysis
The relationships between fluxes and the main parameters were investigated by
step-10
wise multiple regression analysis using the S-PLUS statistical software (Insightful Corp.).
3 Results
The annual average emissions of NO (Table5) ranged from below detection limit to 81.7 µg N m−2h−1. The highest emissions were found in the H ¨oglwald spruce forest
15
followed by the Speulderbos Douglas fir forest (75.2 µg N m−2h−1) and the lowest in the Hyyti ¨al ¨a Scots pine forest (0.006 µg N m−2h−1) and the Parco Ticino mixed forest (below detection limit). Emissions of N2O ranged from 0.3 to 20.3 µg N m−2h−1 with the highest values found in the oak forest in the M ´atra mountains followed by the Parco Ticino poplar forest (19.7 µg N m−2h−1) and the lowest values in Hyyti ¨al ¨a, San Rossore
20
(2.1 µg N m−2h−1) and Speulderbos (2.3 µg N m−2h−1).
Atmospheric nitrogen deposition at the 15 field sites investigated ranged between 0.22 g m−2y−1 and 3.85 g m−2y−1 with the highest value for the Speulderbos for-est in The Netherlands and the lowfor-est value for the Hyyti ¨al ¨a forfor-est in Finland
(Ta-BGD
3, 837–869, 2006Emission of NO and
N2O from forest soils
K. Pilegaard et al. Title Page Abstract Introduction Conclusions References Tables Figures J I J I Back Close
Full Screen / Esc
Printer-friendly Version
Interactive Discussion
EGU
ble 5). The average nitrogen deposition to coniferous forests (1.6±0.5 g N m−2y−1) was similar to deciduous forests (1.5±0.2 g N m−2y−1). On average coniferous forests showed much higher emission of NO (31.0±15.6 µg N m−2h−1) than deciduous forests (4.1±1.9 µg N m−2h−1). For N2O it was found that the deciduous forests had higher emission (11.3±2.2 µg N m−2h−1) than the coniferous forests (6.6±2.3 µg N m−2h−1).
5
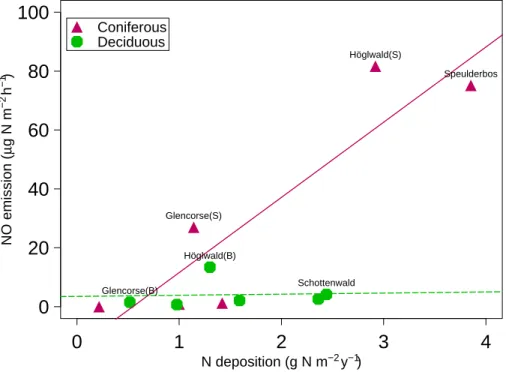
The results of the regression analyses of the emissions of NO and N2O, the sum of NO and N2O and the ratio between NO and N2O with the parameters nitrogen de-position, forest type, age, C/N, pH, soil temperature and WFPS are given in Table 6. In analyses of NO emission, values from the Italian sites were excluded, because of the very few measurements from these sites. NO emission was dependent on
for-10
est type and positively correlated with nitrogen deposition. The parameter WFPS was tested for curvature by including a quadratic term, but this was not significant. Sep-arately performed regression analyses for deciduous and coniferous forests showed, however, that the relationship between nitrogen deposition and NO emission was only significant for the coniferous forests (NO (µg N m−2h−1)=−13.9+25.5∗ [N deposition
15
(g m−2y−1)], r2=0.82). The relationships between NO emission and N deposition are shown in Fig.2.
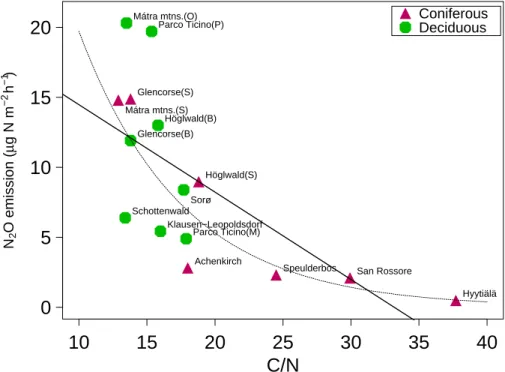
The N2O emission was significantly negatively correlated with both the C/N ratio and the age of the stands (Table6 and Fig.3); a logarithmic transformation of N2O emis-sion improved the significance of the correlation. There was no significant correlation
20
between the N2O emission and the nitrogen deposition (Fig.4).
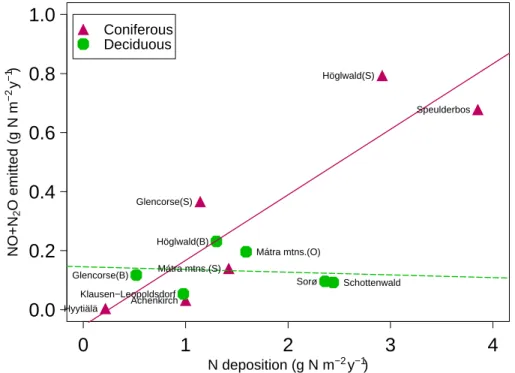
The sum of NO and N2O was positively correlated with nitrogen deposition (Fig. 5) although when split into forest types only for the coniferous stands (Table 6). The amount of N-oxides emitted relative to total N deposition ranged from 2% (Hyyti ¨al ¨a) to 32% (Glencorse spruce). The ratio was not significantly correlated with any of the
25
investigated parameters.
The NO/N2O ratio was positively correlated with nitrogen deposition and C/N ratio and negatively correlated with age of the stands.
BGD
3, 837–869, 2006Emission of NO and
N2O from forest soils
K. Pilegaard et al. Title Page Abstract Introduction Conclusions References Tables Figures J I J I Back Close
Full Screen / Esc
Printer-friendly Version
Interactive Discussion
EGU
a low pH was associated with high nitrogen deposition, but pH was not found to be a significant parameter for N oxides emission.
At three locations (Glencorse, H ¨oglwald and M ´atra mountains) both deciduous and coniferous forests were investigated. At Glencorse and H ¨oglwald the coniferous sites had higher N deposition as compared to the deciduous sites. In addition, NO emission
5
was highest at coniferous sites at both locations, whereas N2O emission was highest at the spruce site in Glencorse, but lowest at the spruce site in H ¨oglwald. The differences in both deposition and NO emission between the two forests in the M ´atra mountains were much smaller whereas the difference in the magnitude of N2O emission between the two sites was substantial (Table5) with the oak site having the highest emission.
10
4 Discussion
4.1 Effects of soil moisture and temperature
Production of NO and N2O in soils is primarily driven by microbial processes such as nitrification and denitrification (Firestone and Davidson,1989), therefore soil tempera-ture is a key variable affecting the emission rates of both gases. Emissions of both NO
15
(Slemr and Seiler,1984) and N2O (Skiba et al.,1998;Smith et al.,1998) increase with increasing soil temperature due to the fact that rates of enzymatic processes gener-ally increase with temperature as long as other factors (e.g. substrate or moisture) are not limiting. Soil water acts as a transport medium for NO−3 and NH+4 and influences the rate of O2 supply and thereby controls whether aerobic processes such as
nitrifi-20
cation or anaerobic processes such as denitrification dominate within the soil. While N2O emissions are known to increase at higher water contents through larger losses from denitrification (Wolf and Russow, 2000; Papen and Butterbach-Bahl,1999) the relationship between the NO flux and the soil water is more complex. Due to limited substrate diffusion at very low water content and limited gas diffusion at high water
25
BGD
3, 837–869, 2006Emission of NO and
N2O from forest soils
K. Pilegaard et al. Title Page Abstract Introduction Conclusions References Tables Figures J I J I Back Close
Full Screen / Esc
Printer-friendly Version
Interactive Discussion
EGU
soil water content. Ludwig et al.(2001) suggested an optimum of NO emissions at ap-proximately 20% WFPS and a strong decrease towards extreme moisture conditions. However, other studies reported maximum NO fluxes between 43% and 85% WFPS (Ormeci et al.,1999;van Dijk and Duyzer,1999;Gasche and Papen,1999).
The effects of soil moisture and temperature on NO and N2O emission were
stud-5
ied in a laboratory experiment with soil cores from some of the same field sites as in the present study (Parco Ticino(M), Schottenwald, Klausen-Leopoldsdorf, Achenkirch, H ¨oglwald (spruce) and Hyyti ¨al ¨a) (Schindlbacher et al.,2004) . Soil moisture and tem-perature explained most of the variations in NO (up to 74%) and N2O (up to 86%) emissions for individual soils. NO and N2O were emitted from all soils except from
10
the boreal pine forest soil in Finland, where the laboratory experiment showed that NO was consumed. NO emissions from the German spruce forest ranged from 1.3 to 608.9 µg NO-N m−2h−1and largely exceeded emissions from other soils. Average N2O emissions from this soil tended also to be highest (171.7±42.2 µg N2O-N m−2h−1), but did not differ significantly from other soils. NO and N2O emissions showed a positive
15
exponential relationship to soil temperature. The results from the annual averages of field data did not show any significant relationship to soil temperature for neither for NO nor for N2O emission.
Schindlbacher et al.(2004) also showed that N2O emissions increased with increas-ing WFPS or decreasincreas-ing water tension, respectively. Maximum N2O emissions were
20
measured between 80 and 95% WFPS or 0 kPa water tension. The optimal moisture for NO emission differed significantly between the soils, and ranged between 15% WFPS in sandy Italian floodplain soil and 65% in loamy Austrian beech forest soils. For the field data WFPS was not a significant parameter for N2O emission, but had a positive significant effect on NO emission. The annual average WFPS in the field was higher
25
than the optima found for NO in the laboratory experiment, but since not all field sites were studied in the laboratory it is difficult to provide a general conclusion.
In general, rather clear relationships between nitrogen oxides emission and soil moisture and soil temperature can be found within a single locality when studying
short-BGD
3, 837–869, 2006Emission of NO and
N2O from forest soils
K. Pilegaard et al. Title Page Abstract Introduction Conclusions References Tables Figures J I J I Back Close
Full Screen / Esc
Printer-friendly Version
Interactive Discussion
EGU
term variations. However, using the same parameters when comparing annual values from different localities within a large region as in this study does not necessarily re-veal comparable relationships since other factors such as soil properties, stand age, and site hydrological conditions interfere. Equally, in a study of 18 European forests
Janssens et al.(2001) found large differences in observed annual soil respiration and
5
total ecosystem respiration, but despite good correlations with temperature within the single forests, the differences between the forests were not correlated with mean an-nual temperature. They hypothesised that differences in soil respiration among forests are likely to depend more on forest productivity rather than on temperature.
The question of whether predictive understanding of N2O fluxes can be increased by
10
examining relationships between fluxes and environmental parameters at larger spatial and temporal scales was also addressed byGroffman et al. (2000). They compared relationships between annual rather than hourly or daily fluxes and ecosystem-scale variables such as plant community and soil type and annual climate rather than field-scale variables such as soil moisture and temperature. They found that there were
15
coherent patterns in annual N2O flux at the ecosystem scale in forest, cropland, and rangeland ecosystems but that ecosystem-scale controls of N2O flux vary within and between regions and only emerge with continuous (at least daily) flux measurements over multiple years.
4.2 Effects of C/N ratio and pH
20
This study showed a significant negative correlation between N2O emission and the C/N ratio (Fig.3). This is in accordance with the laboratory studies by Ambus et al.
(2006). No significant effects of pH could be found, but there was a (non significant) negative correlation between pH and nitrogen input (Fig.6), which could be due to the acidifying effect of NH+4 in soil. Consistently, the sites with high NO emission also had
25
a low pH (Speulderbos, H ¨oglwald), but a low pH in itself did not seem to lead to high emission (Hyyti ¨al ¨a).
BGD
3, 837–869, 2006Emission of NO and
N2O from forest soils
K. Pilegaard et al. Title Page Abstract Introduction Conclusions References Tables Figures J I J I Back Close
Full Screen / Esc
Printer-friendly Version
Interactive Discussion
EGU Klemedtsson et al.(2005) found a strong negative relationship between N2O
emis-sions and soil C/N ratios in forested histosols in Sweden. A decaying exponential equation could describe the relationship and was validated with published data from similar sites in Finland and Germany. They found that at low C/N ratios below 15–20 other parameters such as climate, pH and groundwater tables increase in importance
5
as predictors for N2O emission. A similar negative relationship was found between net nitrification and C/N ratio in spruce and beech forests throughout Europe (Persson
et al.,2000). In the study it was also found that no net nitrifcation could be detected when the C/N ratio exceeded 28 which is consistent with the low emissions found from the soils in San Rossore and Hyyti ¨al ¨a.
10
4.3 Effects of increased N-input
This study showed significant positive correlations between input of nitrogen to forests and NO emission (Fig.2) and the sum of NO and N2O (Fig.5), but no significant rela-tionship for N2O (Fig.4). Clear relationships have been reported previously when com-paring the temporal variation in nitrogen deposition at a single site by e.g. Butterbach-15
Bahl et al. (1997). However, increased nitrogen input does not always lead to enhanced microbial activity. In an experiment with chronic N additions to forest ecosystems (
Bur-ton et al.,2004) it was found that soil N availability was enhanced, but after an initial increase soil respiration was reduced probably due to reduced decomposition activity of the microbial community.
20
The N2O emission from Speulderbos was very low considering the high nitrogen input (Fig.4). This can, however, be explained by the very low N-mineralisation and nitrification rate of this soil (Ambus et al.,2006), which is probably due to the rather poor sandy soil. Furthermore, the dense canopy at this site reduced soil moisture, so that conditions favourable for denitrification do not often prevail. The other sites
25
showing very low N2O emission were Hyyti ¨al ¨a and San Rossore, which also had a soil with low biological activity, but also a much lower N input.
BGD
3, 837–869, 2006Emission of NO and
N2O from forest soils
K. Pilegaard et al. Title Page Abstract Introduction Conclusions References Tables Figures J I J I Back Close
Full Screen / Esc
Printer-friendly Version
Interactive Discussion
EGU
4.4 Effects of forest type and tree species
The difference between the nitrogen oxides emissions from deciduous and coniferous forest soils found in the present study can most likely be explained by differences in soil and litter properties in the two main types of forests. Laboratory studies on N2O emission from soils collected in several of the current study sites also confirmed higher
5
emissions from deciduous sites compared with coniferous sites (Ambus et al.,2006). A number of other studies have shown similar differences between forest types and tree species (e.g.Butterbach-Bahl et al.,1997,2002;Gasche and Papen,1999;Papen and
Butterbach-Bahl,1999).
In a northwestern Connecticut forest,Finzi et al.(1998) quantified the C and N
con-10
tent of the forest floor and the top mineral soil and the rate of net N mineralisation beneath six different tree species. Large differences among species in the size of the forest floor C and N pools and in net N mineralisation rates were found and ex-plained by interspecific differences in litter production and quality. The effects of five different tree species on soil respiration, gross N mineralisation and gross
nitrifica-15
tion rates were investigated in pure tree stands in a species trial in Jutland, Denmark (Br ¨uggemann et al.,2005). The highest rates of soil respiration, gross N mineralisation and gross nitrification were found in the organic layer under spruce, followed by beech >larch>oak>pine.
Consistently elevated fluxes of NO from coniferous forest soil were found in an
ex-20
periment with addition of N (+50 kg N ha−1y−1 and +150 kg N ha−1y−1) to coniferous and deciduous forest soils (Venterea et al.,2003). Only the application of the higher amount of N-fertilizer had an effect on NO flux from the deciduous forest soil. Treatment effects on N2O flux were much smaller and no difference between forest types could be seen. From this experiment it was concluded that atmospheric deposition may
re-25
sult in increased NO emission from forest soils by promoting nitrification, and that the response may vary significantly between forest types under similar climatic regimes. These results confirm the relationship between nitrogen deposition and the difference
BGD
3, 837–869, 2006Emission of NO and
N2O from forest soils
K. Pilegaard et al. Title Page Abstract Introduction Conclusions References Tables Figures J I J I Back Close
Full Screen / Esc
Printer-friendly Version
Interactive Discussion
EGU
of forest types found in the present study.
There are several possible reasons for the difference in N-oxide emission between coniferous and deciduous forests. N-deposition (in throughfall) is often substantially (2–3 times) higher in coniferous forests than in deciduous forest due to their better filtering capacity of the air (higher leaf area index, evergreen) (Rothe et al., 2002).
5
Some factors of the coniferous forest floor favour nitrification and thus NO emission; i.e. soil moisture is generally lower at coniferous forests (at least during spring time), they produce a thick well aerated litter layer, and the lower pH might lead to NO production from chemical decomposition of NO−2 (van Cleemput and Baert, 1984). Conversely, higher rates of denitrification are found in deciduous forests leading to N2O production
10
and NO consumption in the soil. However, the rather crude partition into deciduous and coniferous forests might not be sustained since, as documented above, different tree species provide different conditions for nitrogen oxides emission and the effects can not always be clearly split into the groups coniferous/deciduous.
The age of the forest had a significant negative effect on the N2O emission and on
15
the ratio between NO and N2O emission. Although age is not a real indicator of suc-cessional state when comparing different types of forests, this indicates that nitrogen oxides emission is not suppressed by a higher growth rate in younger forests.
5 Conclusions
From a detailed study throughout a year of nitrogen oxides emission from the soil at 15
20
forest sites across Europe, it was found that coniferous forest soils had much higher NO emissions than deciduous forest soils. It was also found that NO emission from coniferous forest soils was highly correlated with the N-input to the soil as measured in throughfall and stem-flow. The NO emission from deciduous forest soils was generally low. The N2O emission was slightly higher in deciduous forests compared to
conifer-25
ous. The correlation between N2O emission and N-deposition was not significant, but there was a significant negative correlation between the N2O emission and the C/N
BGD
3, 837–869, 2006Emission of NO and
N2O from forest soils
K. Pilegaard et al. Title Page Abstract Introduction Conclusions References Tables Figures J I J I Back Close
Full Screen / Esc
Printer-friendly Version
Interactive Discussion
EGU
ratio. The emission of N in N-oxides was 2–32 % of the amount of N in atmospheric input to the soil. The differences between coniferous and deciduous forests are proba-bly partly due to higher N-input to coniferous forest soils and partly due to differences in litter layer properties.
Many studies have shown that the temporal variation of nitrogen oxides emission on
5
a specific site is clearly related to soil moisture and soil temperature. This study shows that when comparing annual emissions on a regional scale, however, factors such as nitrogen deposition and forest and soil type become much more important.
Acknowledgements. The NOFRETETE project was funded by the EU commission under the contract no. EVK2-CT2001-00106.
10
References
Aber, J. D.: Nitrogen cycling and nitrogen saturation in temperate forest ecosystems, Tree, 7, 220–224, 1992. 840
Aber, J. D., Nadelhofer, K. J., Steudler, P., and Melillo, J. M.: Nitrogen saturation in northern forest ecosystems, BioScience, 39, 378–386, 1989. 840
15
Altimir, N., Vesala, T., Keronen, P., Kulmala, M., and Hari, P.: Methodology for direct field measurements of ozone flux to foliage with shoot chambers, Atmos. Environ., 36, 19–29, 2002. 843
Ambus, P., Jensen, J., Priem ´e, A., Pilegaard, K., and Kjøller, A.: Assessment of CH4 and N2O fluxes in a Danish beech (Fagus sylvatica) forest and an adjacent N-fertilised barley
20
(Hordeum vulgare) field: effects of sewage sludge amendments, Nutrient Cycling in Agroe-cosystems, 60, 15–21, 2001. 861
Ambus, P., Zechmeister-Boltenstern, S., and Butterbach-Bahl, K.: Relationship between nitru-ous oxide production and nitrogen cycling in European forests, Biogeosciences, 3, 135–145, 2006. 848,849,850
25
Beck, W.: Ver ¨anderungen im Wachstumsverhalten von Kiefer und Buche im nordostdeutschen Tiefland in Abh ¨angigheit von Fremdstoffeintrag und Witterung, in 9. Hamburger Forst- und Holtztagung 1996, 73–96, Bundesforschungsantalt f ¨ur Forst- und Holtzwirtschaft, Hamburg, 1996. 840
BGD
3, 837–869, 2006Emission of NO and
N2O from forest soils
K. Pilegaard et al. Title Page Abstract Introduction Conclusions References Tables Figures J I J I Back Close
Full Screen / Esc
Printer-friendly Version
Interactive Discussion
EGU
Br ¨uggemann, N., Rosenkranz, P., Papen, H., Pilegaard, K., and Butterbach-Bahl, K.: Pure stands of temperate forest tree species modify soil respiration and N turnover, Biogeosci. Discuss., 2, 303–331, 2005. 850
Brumme, R. and Beese, F.: Effects of liming and nitrogen fertilization on emissions of CO2and N2O from a temperate forest, J. Geophys. Res., 96, 9321–9328, 1992. 841
5
Burton, J. L., Pregitzer, K. S., Crawford, J. N., Zogg, G. P., and Zak, D. R.: Simulated chronic NO−3 deposition reduces soil respiration in northern hardwood forests, Global Change Biol., 10, 1080–1091, 2004. 849
Butterbach-Bahl, K., Gasche, R., Breuer, L., and Papen, H.: Fluxes of NO and N2O from temperate forest soils: Impact of forest type, N deposition and of liming on the NO and N2O
10
emissions, Nutrient Cycling in Agroecosystems, 48, 79–90, 1997. 840,841,843,849,850,
860,861
Butterbach-Bahl, K., Rothe, A., and Papen, H.: Effect of tree distance on N2O and CH4– fluxes from soils in temperate forest ecosystems, Plant and Soil, 240, 91–103, 2002. 850
Castro, M. S., Steudler, P. A., Melillo, J. M., Aber, J. D., and Millhamet, S.: Exchange of N2O and
15
CH4 between the atmosphere and soils in spruce-fir forests in Northeastern United States, Biogeochemistry, 18, 119–135, 1993. 841
Christensen, S., Simkins, S., and Tiedje, J. M.: Spatial variation in denitrification: Dependency of activity centers on the soil environment, Soil Sci. Soc. Am. J., 54, 1608–1613, 1990. 861
Dise, N. B. and Wright, R. F.: Nitrogen leaching from European forests in relation to nitrogen
20
deposition, Forest Ecol. Manage., 71, 153–161, 1995. 840
Duyzer, J. H.: Measurements of the atmospheric emission of N2O from biogenic sources in general and by grassland ecosystems in particular, Tech. Rep. TNO-MEP R 95/213, TNO Institute of Environmental Sciences, 1995. 861
Fenn, M. E., Poth, M. A., Aber, J. D., Baron, J. S., Bormann, B. T., Johnson, D. W., Lemly,
25
A. D., McNulty, S. G., Ryan, D. F., and Stottlemeyer, R.: Nitrogen excess in North American ecosystems: predisposing factors, ecosystem responses, and management strategies, Ecol. Appl., 8, 1998. 840
Ferr ´e, C., Leip, A., Matteucci, G., Previtali, F., and Seufert, G.: Impact of 40 years poplar cultivation on soil carbon stocks and greenhouse gas fluxes, Biogeosci. Discuss., 2, 897–
30
931, 2005. 842
Finzi, A., van Breemen, N., and Canham, C. D.: Canopy tree–soil interactions within temperate forests: Species effects on soil carbon and nitrogen, Ecol. Appl., 8, 440–446, 1998. 850
BGD
3, 837–869, 2006Emission of NO and
N2O from forest soils
K. Pilegaard et al. Title Page Abstract Introduction Conclusions References Tables Figures J I J I Back Close
Full Screen / Esc
Printer-friendly Version
Interactive Discussion
EGU
Firestone, M. K. and Davidson, E. A.: Microbial basis of NO and N2O production and consump-tion in soil, in: Exchange of trace gases between terrestrial ecosystems and the atmosphere, edited by: M. O. Andreae and D. S. Schimel, 7–21, John Wiley & Sons Ltd., Chichester, U.K., 1989. 846
Gasche, R. and Papen, H.: A 3-year continuous record of nitrogen trace gas fluxes from
un-5
treated and limed soil of a N-saturated spruce and beech forest ecosystem in Germany 2. NO and NO2fluxes, J. Geophys. Res., 104, 18 505–18 520, 1999. 841,847,850
Groffman, P., Brumme, R., Butterbach-Bahl, K., Dobbie, K. E., Mosier, A. R., Ojima, D., Papen, H., Parton, W. J., Smith, K. A., and Wagner-Riddle, C.: Evaluating annual nitrous oxide fluxes at the ecosystem scale, Global Biogeochem. Cycles, 14, 1061–1070, 2000. 848
10
H ¨artel, C., Zechmeister, S., and Gerzabek, M.: Gaseous nitrogen losses from a forest site in the north Tyrolean limestone Alps, Environ. Sci. Pollut. Res., Special Issue, 2, 23–30, 2002.
861
Hofmann, G.: Kiefern ¨okosysteme im Wandel, Der Wald, 45, 262–267, 1995. 840
Holtermann, C.: A transportable system for the on–line measurements of NOx (NO , NO2)
15
-emission from soils, Die Bodenkultur, 47, 235–244, 1996. 860
Horv ´ath, L., F ¨uhrer, E., and Lajtha, K.: Nitric oxide and nitrous oxide emission from Hungarian forest soils; link with atmospheric N-deposition, Biogeosci. Discuss., 2, 703–722, 2005. 842
Janssens, I. A., Lankreijer, H., Matteucci, G., Kowalski, A., Buchmann, N., Epron, D., Pile-gaard, K., Kutsch, W., Longdoz, B., Gr ¨unwald, T., Montagnani, L., Dore, S., Rebmann, C.,
20
Moors, E., Grelle, A., Rannik, ¨U., Morgenstern, K., Clement, R., Gudmundsson, J., Minerbi, S., Berbigier, P., Ibrom, A., Moncrieff, J., Aubinet, M., Berhofer, C., Jensen, N., Vesala, T., Granier, A., Schulze, E.-D., Lindroth, A., Dolman, A., Jarvis, P., Ceulemans, R., and Valentini, R.: Productivity and disturbance overshadow temperature in determining soil and ecosystem respiration across European forests, Global Change Biol., 7, 269–278, 2001. 848
25
Kitzler, B., Zechmeister-Boltenstern, S., Holtermann, C., Skiba, U., and Butterbach-Bahl, K.: Nitrogen oxides emission from two beech forests subjected to different nitrogen loads, Bio-geosci. Discuss., 2, 1381–1422, 2005a. 842
Kitzler, B., Zechmeister-Boltenstern, S., Holtermann, C., Skiba, U., and Butterbach-Bahl, K.: Controls over N2O, NOx and CO2 fluxes in a calcareous mountain forest soil, Biogeosci.
30
Discuss., 2, 1423–1455, 2005b. 842
Klemedtsson, L., von Arnold, K., Weslien, P., and Gundersen, P.: Soil CN ratio as a scalar parameter to predict nitrous oxide emissions, Global Change Biol., 11, 1142–1147, 2005.
BGD
3, 837–869, 2006Emission of NO and
N2O from forest soils
K. Pilegaard et al. Title Page Abstract Introduction Conclusions References Tables Figures J I J I Back Close
Full Screen / Esc
Printer-friendly Version
Interactive Discussion
EGU 848
Kreutzer, K.: Effects of liming on soil processes, Plant and Soil, 168–169, 447–470, 1995. 840
Kreutzer, K. and Weiss, T.: The H ¨oglwald field experiments – aims, concepts and basic data, Plant and Soil, 199, 1–10, 1998. 840
Kristensen, H. L., Gundersen, P., Callesen, I., and Reinds, G. J.: Throughfall nitrogen
deposi-5
tion has different impacts on soil solution nitrate concentration in European coniferous and deciduous Forests, Ecosystems, 7, 180–192, 2004. 840
Leip, A.: Nitrous oxide (N2O) emissions from a coastal catchment in the Delta of the Po river. Measurement and modeling of fluxes from a Mediterranean lagoon and agricultural soil, Tech. Rep. EUR 19052, Office for Official Publications of the European Communities,
Lux-10
embourg, 2000. 861
Ludwig, J., Meixner, F. X., Vogel, B., and F ¨orstner, J.: Soil–air exchange oif nitric oxide: An overview of processes, environmental factors, and modeling studies, Biogeochemistry, 52, 225–257, 2001. 847
MacDonald, J. A., Skiba, U. M., Sheppard, L. J., Ball, B., Roberts, J. D., Smith, K. A., and
15
Fowler, D.: The effect of nitrogen deposition and seasonal variability on methane oxidation and nitrous oxide emission rates in an upland spruce plantation and moorland, Atmos. Envi-ron., 31, 3693–3706, 1998. 861
Magill, A. H., Aber, J. D., Hendricks, J. J., Bowden, R. D., Melillo, J. M., and Steudler, P. A.: Biogeochemical response of forest ecosystems to simulated chronic nitrogen deposition,
20
Ecol. Appl., 7, 402–415, 1997. 840
Meixner, F. X., Fickinger, T., Marufu, L., Serca, D., Nathaus, F. J., Makina, E., Mukurumbira, L., and Andreae, M. O.: Preliminary results of nitric oxide emission from a southern African savanna ecosystem, Nutrient Cycling in Agroecosystems, 48, 123–138, 1997. 860
Ormeci, B., Sanin, S. L., and Peirce, J. J.: Laboratory study of NO flux from agricultural soil:
25
Effects of soil moisture, pH, and temperature, J. Geophys. Res., 104, 1621–1629, 1999. 847
Papen, H. and Butterbach-Bahl, K.: A 3-year continuous record of nitrogen trace gas fluxes from untreated and limed soil of a N-saturated spruce and beech forest ecosystem in Ger-many – 1. N2O emissions, J. Geophys. Res., D104, 18 487–18 503, 1999. 846,850
Persson, T., Rudebeck, A., Jussy, J. H., Colin-Belgrand, M., Priem ´e, A., Dambrine, E., Karlsson,
30
P. S., and Sj ¨oberg, R. M.: Carbon and nitrogen cycling in European forest ecosystems, vol. 142 of Ecological Studies, chap. Soil nitrogen turnover – Mineralisation, nitrification and denitrification in European forest soils, 297–340, Springer Verlag, 2000. 849
BGD
3, 837–869, 2006Emission of NO and
N2O from forest soils
K. Pilegaard et al. Title Page Abstract Introduction Conclusions References Tables Figures J I J I Back Close
Full Screen / Esc
Printer-friendly Version
Interactive Discussion
EGU
Pilegaard, K.: Air–soil exchange of NO, NO2, and O3in forests, Water, Air and Soil Pollution: Focus, 1, 79–88, 2001. 860
Pilegaard, K., Hummelshøj, P., and Jensen, N. O.: Nitric oxide emission from a Norway spruce forest floor, J. Geophys. Res., D(104), 3433–3445, 1999. 840,841,843
Pilegaard, K., Hummelshøj, P., Jensen, N. O., and Chen, Z.: Two years of continuous CO2
5
eddy-flux measurements over a Danish beech forest, Agric. Forest Meteorol., 107, 29–41, 2001. 841
Pitcairn, C. E. R., Skiba, U. M., Sutton, M., Fowler, D., Munro, R., and Kennedy, V.: Defining the spatial impacts of poultry farm ammonia emissions on species composition of adjacent woodland groundflora using Ellenberg Nitrogen Index, nitrous oxide and nitric oxide
emis-10
sions and foliar nitrogen as marker variables, Environ. Pollut., 199, 9–21, 2002. 840
Priha, O. and Smolander, A.: Nitrification, denitrification and microbial biomass in soil from two N-fertilized and limed Norway spruce forests, Soil Biol. Biochem., 27, 305–310, 1995. 840
Pumpanen, J., Ilvesniemi, H., Keronen, P., Nissinen, A., Pohja, T., Vesala, T., and Hari, P.: An open chamber system for measuring soil surface CO2efflux: Analysis of error sources
15
related to the chamber system, J. Geophys. Res., 106, 7985–7992, 2001. 860
Remde, A., Ludwig, J., Meixner, F., and Conrad, R.: A study to explain the emission of nitric oxide from a marsh soil, J. Atmos. Chem., 17, 249–275, 1993. 843
Rosenkranz, P., Br ¨uggemann, N., Papen, H., Xu, Z., Seufert, G., and Butterbach-Bahl, K.: N2O, NO and CH4exchange and microbial N turnover over a Mediterranean pine forest soil,
20
Biogeosciences, 3, 121–133, 2006. 842,862
Rothe, A., Huber, C., Kreutzer, K., and Weis, W.: Deposition and soil leaching in stands of Norway spruce and European Beech: Results from the H ¨oglwald research in comparison with other European case studies, Plant and Soil, 240, 33–45, 2002. 851
Schindlbacher, A., Zechmeister-Boltenstern, S., and Butterbach-Bahl, K.: Effects of soil
mois-25
ture and temperature on NO, NO2, and N2O emissions from European forest soils, J. Geo-phys. Res., 109, D17302, 1–12, 2004. 847
Schulze, E. D.: Air pollution and forest decline in spruce Picea abies forest, Science, 244, 776–783, 1989. 840
Skiba, U., Sheppard, L., Pitcairn, C. E. R., Leith, I., Crossley, A., van Dijk, S., Kennedy, V. H.,
30
and Fowler, D.: Soil nitrous oxide and nitric oxide emissions as indicators of elevated atmo-spheric N deposition rates in seminatural ecosystems, Environ. Pollut., 102, 457–461, 1998.
BGD
3, 837–869, 2006Emission of NO and
N2O from forest soils
K. Pilegaard et al. Title Page Abstract Introduction Conclusions References Tables Figures J I J I Back Close
Full Screen / Esc
Printer-friendly Version
Interactive Discussion
EGU
Slemr, F. and Seiler, W.: Field measurements of NO and NO2 emissions from fertilized and unfertilized soils, J. Atmos. Chem., 2, 1–24, 1984. 846
Smith, K. A., Thomson, P. E., Clayton, H., McTaggart, I. P., and Conen, F.: Effects of temper-ature, water content and nitrogen fertilisation on emissions of nitrous oxide by soils, Atmos. Environ., 32, 3301–3309, 1998. 841,846
5
Syv ¨asalo, E., Regina, K., Pihlatie, M., and Esala, M.: Emissions of nitrous oxide from boreal agricultural clay and loamy sand soil, Nutrient Cycling in Agroecosystems, 69, 155–165, 2004. 861
Umweltbundesamt: Daten zur Umwelt, Tech. rep., Umweltbundesamt, Berlin; Germany, 1997.
840 10
van Cleemput, O. and Baert, L.: Nitrite – A key compound in N-loss processes under acid conditions, Plant and Soil, 76, 233–242, 1984. 851
van der Eerden, L. J. M., de Visser, P. H. B., and van Dijk, C. J.: Risk of damage to crops in the direct neighborhood of ammonia sources, Environ. Pollut., 102, 49–52, 1998. 840
van Dijk, S. M. and Duyzer, J. H.: Nitric oxide emissions from forest soils, J. Geophys. Res.,
15
104, 15 955–15 961, 1999. 840,841,843,847,860
Venterea, R. T., Groffman, P. M., Verchot, L. V., Magill, A. H., Aber, J. D., and Steudler, P. A.: Nitrogen oxide gas emissions from temperate forest soils receiving long-term nitrogen inputs, Global Change Biol., 9, 346–357, 2003. 850
Williams, E. J., Guenther, A., and Fehsenfeld, F. C.: An inventory of nitric oxide emissions from
20
soils in the United States, J. Geophys. Res., 97, 7511–7519, 1992. 841
Wolf, I. and Russow, R.: Different pathways of formation of N2O, N2and NO in black earth soil, Soil Biol. Biochem., 32, 229–239, 2000. 846
BGD
3, 837–869, 2006Emission of NO and
N2O from forest soils
K. Pilegaard et al. Title Page Abstract Introduction Conclusions References Tables Figures J I J I Back Close
Full Screen / Esc
Printer-friendly Version
Interactive Discussion
EGU Table 1. Geographical location, and tree species of forest field sites for continuous
measure-ments of NO and N2O fluxes.
Country Site Species Latitude Longitude Finland Hyyti ¨al ¨a Scots pine 61.85◦N 24.28◦E Scotland Glencorse(B) birch 55.85◦N 2.17◦E Scotland Glencorse(S) Sitka spruce 55.85◦N 3.17◦W
Denmark Sorø beech 55.48◦N 11.63◦E
The Netherlands Speulderbos Douglas fir 52.22◦N 5.65◦E Germany H ¨oglwald(B) beech 48.50◦N 11.17◦E Germany H ¨oglwald(S) spruce 48.50◦N 11.17◦E Austria Schottenwald beech 48.23◦N 15.25◦E Austria Klausen-L. beech 48.12◦N 16.05◦E Hungary M ´atra mtns.(S) spruce 47.89◦N 19.95◦E Hungary M ´atra mtns.(O) oak 47.87◦N 19.97◦E Austria Achenkirch spruce 47.58◦N 11.65◦E Italy Parco Ticino(M) mixed 45.20◦N 9.07◦E Italy Parco Ticino(P) poplar 45.20◦N 9.07◦E Italy San Rossore pine 43.73◦N 10.28◦E
BGD
3, 837–869, 2006Emission of NO and
N2O from forest soils
K. Pilegaard et al. Title Page Abstract Introduction Conclusions References Tables Figures J I J I Back Close
Full Screen / Esc
Printer-friendly Version
Interactive Discussion
EGU Table 2. Characteristics of forest field sites.
Site Type Age C/N pH Soil Soil WFPS Precipitation temperature moisture
years ◦C %v/v % mm y−1
Hyyti ¨al ¨a coniferous 41 37.7 3.3 4.6 26.3 38 500 Glencorse(B) deciduous 19 13.8 5.1 6.6 31.4 44 1047 Glencorse(S) coniferous 19 13.8 5.1 6.3 25.9 36 1047 Sorø deciduous 84 17.7 4.5 7.6 24.6 36 845 Speulderbos coniferous 43 24.5 3.7 9.4 17.9 31 721 H ¨oglwald(B) deciduous 87 15.8 3.4 8.3 937 H ¨oglwald(S) coniferous 96 18.8 3.2 8.6 31.5 56 937 Schottenwald deciduous 141 13.4 4.3 8.1 27.0 60 509 Klausen-L. deciduous 60 16.0 5.0 8.4 41.0 59 612 M ´atra mtns.(S) coniferous 39 12.9 3.6 5.6 26.0 53 817 M ´atra mtns.(O) deciduous 74 13.5 4.7 8.2 26.0 59 817 Achenkirch coniferous 126 18.0 7.0 6.2 50.2 60 1355 Parco Ticino(M) deciduous 150 17.9 4.6 12.2 30.7 44 825 Parco Ticino(P) deciduous 13 15.3 6.4 13.9 29.3 51 825 San Rossore coniferous 38 29.9 6.5 14.0 11.1 21 959
BGD
3, 837–869, 2006Emission of NO and
N2O from forest soils
K. Pilegaard et al. Title Page Abstract Introduction Conclusions References Tables Figures J I J I Back Close
Full Screen / Esc
Printer-friendly Version
Interactive Discussion
EGU Table 3. Characteristics of chamber systems used in NO flux measurements.
Site Type Method Chambers Frames Frequency Area Volume Flow Analysis Analyser Reference No. No. m2 l l min−1
Hyyti ¨al ¨a dynamic automatic 3 3 1/h 0.028 5.7 4 field TEI42S Pumpanen et al.(2001) Glencorse(B) dynamic automatic 4+1 4+1 1/h 0.08 17 11.5 field TEI42C Pilegaard(2001) Glencorse(S) dynamic automatic 4+1 4+1 1/h 0.08 17 11.5 field TEI42C Pilegaard(2001) Sorø dynamic automatic 4+1 10+1 4/h 0.078 12 10 field TEI42CTL Pilegaard(2001) Speulderbos dynamic automatic 4 4 1/h 0.48 75 125 field TEI42S van Dijk and Duyzer(1999) H ¨oglwald(B) dynamic automatic 5+1 5+1 1/h 0.25 37.5 50 field CLD770ALppt+PLC760 Butterbach-Bahl et al.(1997) H ¨oglwald(S) dynamic automatic 5+1 5+1 1/h 0.25 37.5 50 field CLD770ALppt+PLC760 Butterbach-Bahl et al.(1997) Schottenwald dynamic automatic 5+1 2/h 0.0314 3.27 1 field Horiba APNA-360 Holtermann(1996) Klausen-L. dynamic automatic 5+1 2/h 0.0314 3.27 1 field Horiba APNA-360 Holtermann(1996) M ´atra mtns.(S) dynamic manual 2 2 1/month 0.080 0.444 0.327 field Horiba Meixner et al.(1997) M ´atra mtns.(O) dynamic manual 2 2 4/year 0.080 0.444 0.327 field Horiba Meixner et al.(1997) Achenkirch dynamic automatic 5+1 2/h 0.0314 3.27 1 field Horiba APNA-360 Holtermann(1996) San Rossore dynamic automatic 5+1 5+1 1/h 0.25 37.5 50 field CLD770ALppt+PLC760 Butterbach-Bahl et al.(1997)
BGD
3, 837–869, 2006Emission of NO and
N2O from forest soils
K. Pilegaard et al. Title Page Abstract Introduction Conclusions References Tables Figures J I J I Back Close
Full Screen / Esc
Printer-friendly Version
Interactive Discussion
EGU Table 4. Characteristics of chamber systems used in N2O flux measurements.
Site Type Method Chambers Frames Frequency Area Volume Analysis Analyser Reference No. No. m2 l
Hyyti ¨al ¨a static manual 2 6 2/month 0.116 32.48 laboratory HP-GC 6890 Syv ¨asalo et al.(2004) Glencorse(B) static manual 4 4 4 campaigns 0.14 25 laboratory HP-GC-5890 MacDonald et al.(1998) Glencorse(B) static semi-automatic 1 1 1/day 1 72 laboratory HP-GC-5890 MacDonald et al.(1998) Glencorse(S) static manual 4 4 4 campaigns 0.14 25 laboratory HP-GC-5890 MacDonald et al.(1998) Glencorse(S) static semi-automatic 1 1 1/day 1 72 laboratory HP-GC-5890 MacDonald et al.(1998) Sorø static manual 6 6 2/month 0.071 8 laboratory Shimadzu 14b w/ECD Ambus et al.(2001) Sorø static semi-automatic 1 1 1/day 0.49 60 laboratory Shimadzu 14b w/ECD Ambus et al.(2001) Speulderbos static automatic 4 4 1/hour 0.48 75 field Chompack cp-9001 GC63Ni-ECD Duyzer(1995)
H ¨oglwald(B) static automatic 5 5 2/hour 0.25 37.5 field Shimadzu 14a w/ECD Butterbach-Bahl et al.(1997) H ¨oglwald(S) static automatic 5 5 2/hour 0.25 37.5 field Shimadzu 14a w/ECD Butterbach-Bahl et al.(1997) Schottenwald static manual 4 4 2/month 1.0 80 laboratory GC-63Ni ECD H ¨artel et al.(2002)
Schottenwald static semi-automatic 1 1 1/day 0.49 49 laboratory GC-63Ni ECD
Klausen-L. static manual 4 4 1/month 1.0 80 laboratory GC-63Ni ECD H ¨artel et al.(2002) Klausen-L. static semi-automatic 1 1 1/day 0.49 49 laboratory GC-63Ni ECD
M ´atra mtns.(S) static manual 8 8 2/month 0.0080 0.4 laboratory HP-GC 5890+ HP-MS 5972 Christensen et al.(1990) M ´atra mtns.(O) static manual 8 8 2/month 0.0080 0.4 laboratory HP-GC 5890+ HP-MS 5972 Christensen et al.(1990) Achenkirch static manual 4 4 2/month 1.0 80 laboratory GC-63Ni ECD H ¨artel et al.(2002)
Achenkirch static semi-automatic 1 1 1/day 0.49 49 laboratory GC-63Ni ECD
Parco Ticino(M) static manual 4 4 2/month 0.13 28 laboratory Shimadzu GC14B Leip(2000) Parco Ticino(M) static semi-automatic 1 1 1/day 0.46 60 laboratory Shimadzu GC14B
Parco Ticino(P) static manual 4 4 2/month 0.13 28 laboratory Shimadzu GC14B Leip(2000) Parco Ticino(P) static semi-automatic 1 1 1/day 0.46 60 laboratory Shimadzu GC14B
San Rossore static manual 4 8 2/month 0.13 28 laboratory Shimadzu GC14B Leip(2000) San Rossore static semi-automatic 1 1 1/day 0.46 60 laboratory Shimadzu GC14B
BGD
3, 837–869, 2006Emission of NO and
N2O from forest soils
K. Pilegaard et al. Title Page Abstract Introduction Conclusions References Tables Figures J I J I Back Close
Full Screen / Esc
Printer-friendly Version
Interactive Discussion
EGU Table 5. Annual nitrogen deposition (NO−3+NH+4) in throughfall (g N m−2y−1) and average
emis-sion of NO and N2O (µg N m−2h−1) from forests in Europe listed in the order of deposition. Data from July 2002–June 2003, except Speulderbos September 2002–August 2003, and NO in Sorø May 2003–April 2004. nd=below detection limit.
Site Nitrogen deposition NO emission N2O emission g N m−2y−1 µg N m−2h−1 µg N m−2h−1 Speulderbos 3.85 75.2 2.3 H ¨oglwald(S) 2.91 81.7 9.0 Schottenwald 2.44 4.2 6.4 Sorø 2.36 2.6 8.4 M ´atra mtns.(O) 1.59 2.1 20.3 M ´atra mtns.(S) 1.42 1.2 14.8 H ¨oglwald(B) 1.30 13.4 13.0 Parco Ticino(M) 1.3 nd 4.9 Parco Ticino(P) 1.3 5.0∗ 19.7 Glencorse(S) 1.14 27.0 14.9 Achenkirch 1.00 0.9 2.8 Klausen-L. 0.98 0.7 5.4 San Rossore 0.76 5.4† 2.1 Glencorse(B) 0.52 1.5 11.9
Hyyti ¨al ¨a 0.22 0.006 0.3
∗
Based on 2 measurements in August and November 2002 †
Based on continuous measurements during 23 April–4 June 2003 and 28 October–3 Decem-ber 2003
BGD
3, 837–869, 2006Emission of NO and
N2O from forest soils
K. Pilegaard et al. Title Page Abstract Introduction Conclusions References Tables Figures J I J I Back Close
Full Screen / Esc
Printer-friendly Version
Interactive Discussion
EGU Table 6. Regression coefficients. Units as given in Tables 2and5. Significance: ***p<0.001;
**p< 0.01; *p<0.05;+p<0.1.
parameter coefficient signif.
NO emission intercept −3.29 all N deposition 19.45 ** (r2=0.71) type (dec.) −22.45 + NO emission intercept −13.93 coniferous N deposition 25.52 * (r2=0.82) NO emission intercept 3.52 deciduous N deposition 0.37 (r2=0.004) N2O emission intercept 26.49 *** all C/N −0.69 *** (r2=0.67) age −0.07 * ln(N2O emission) intercept 4.82 *** all C/N −0.14 *** (r2=0.87) age −0.01 * N2O emission intercept 9.60 * all N deposition −0.33 (r2=0.03) NO+N2O emission intercept −6.33 all N deposition 20.06 ** (r2=0.53)
NO+N2O emission intercept −6.20
coniferous N deposition 25.34 *
(r2=0.80)
NO+N2O emission intercept 16.58
deciduous N deposition −1.05
(r2=0.04)
NO/N2O emission intercept −2.23
all N deposition 7.82 ***
BGD
3, 837–869, 2006Emission of NO and
N2O from forest soils
K. Pilegaard et al. Title Page Abstract Introduction Conclusions References Tables Figures J I J I Back Close
Full Screen / Esc
Printer-friendly Version Interactive Discussion EGU Speulderbos Sorø Mátra mtns. Glencorse Parco Ticino San Rossore Glencorse Hyytiälä Höglwald Achenkirch Klausen−Leopoldsdorf Schottenwald
BGD
3, 837–869, 2006Emission of NO and
N2O from forest soils
K. Pilegaard et al. Title Page Abstract Introduction Conclusions References Tables Figures J I J I Back Close
Full Screen / Esc
Printer-friendly Version Interactive Discussion EGU
0
1
2
3
4
0
20
40
60
80
100
N deposition (g N m−2 y−1) NO emission ( µ g N m −2 h −1) Speulderbos Schottenwald Höglwald(S) Höglwald(B) Glencorse(S) Glencorse(B) Coniferous DeciduousFig. 2. NO emission (µg N m−2h−1) as a function of nitrogen deposition (g N m−2y−1). Re-gression lines (solid=significant, dashed=non significant) for coniferous and deciduous sites, respectively.
BGD
3, 837–869, 2006Emission of NO and
N2O from forest soils
K. Pilegaard et al. Title Page Abstract Introduction Conclusions References Tables Figures J I J I Back Close
Full Screen / Esc
Printer-friendly Version Interactive Discussion EGU
C/N
10
15
20
25
30
35
40
0
5
10
15
20
N2 O emission ( µ g N m −2 h −1) Speulderbos Schottenwald Höglwald(S) Höglwald(B) Mátra mtns.(O) Glencorse(S) Parco Ticino(M) Parco Ticino(P) San Rossore Klausen−Leopoldsdorf Achenkirch Glencorse(B) Hyytiälä Sorø Mátra mtns.(S) Coniferous DeciduousFig. 3. N2O emission (µg N m−2h−1) as a function of C/N ratio. The full line represents a linear regression and the dotted line a regression after logarithmic transformation of N2O emission.
BGD
3, 837–869, 2006Emission of NO and
N2O from forest soils
K. Pilegaard et al. Title Page Abstract Introduction Conclusions References Tables Figures J I J I Back Close
Full Screen / Esc
Printer-friendly Version Interactive Discussion EGU
0
1
2
3
4
0
5
10
15
20
25
30
N deposition (g N m−2 y−1) N2 O emission ( µ g N m −2 h −1) Speulderbos Schottenwald Höglwald(S) Sorø Höglwald(B) Mátra mtns.(O) Glencorse(S) Parco Ticino(P) San Rossore Klausen−Leopoldsdorf Achenkirch Glencorse(B) Hyytiälä Mátra mtns.(S) Parco Ticino(M) Coniferous DeciduousBGD
3, 837–869, 2006Emission of NO and
N2O from forest soils
K. Pilegaard et al. Title Page Abstract Introduction Conclusions References Tables Figures J I J I Back Close
Full Screen / Esc
Printer-friendly Version Interactive Discussion EGU
0
1
2
3
4
0.0
0.2
0.4
0.6
0.8
1.0
N deposition (g N m−2 y−1) NO+N 2 O emitted ( g N m −2 y −1 ) Speulderbos Höglwald(S) Sorø Mátra mtns.(S) Höglwald(B) Glencorse(S) Klausen−Leopoldsdorf Achenkirch Glencorse(B) Hyytiälä Schottenwald Mátra mtns.(O) Coniferous DeciduousFig. 5. Sum of N-oxides emitted as a function of nitrogen deposition (g N m−2y−1). Regression lines (solid=significant, dashed=non significant) for coniferous and deciduous sites, respec-tively.
BGD
3, 837–869, 2006Emission of NO and
N2O from forest soils
K. Pilegaard et al. Title Page Abstract Introduction Conclusions References Tables Figures J I J I Back Close
Full Screen / Esc
Printer-friendly Version Interactive Discussion EGU