HAL Id: insu-03210017
https://hal-insu.archives-ouvertes.fr/insu-03210017
Submitted on 27 Apr 2021
HAL is a multi-disciplinary open access
archive for the deposit and dissemination of
sci-entific research documents, whether they are
pub-lished or not. The documents may come from
teaching and research institutions in France or
abroad, or from public or private research centers.
L’archive ouverte pluridisciplinaire HAL, est
destinée au dépôt et à la diffusion de documents
scientifiques de niveau recherche, publiés ou non,
émanant des établissements d’enseignement et de
recherche français ou étrangers, des laboratoires
publics ou privés.
A statistical survey of ELF waves in a geostationary
orbit
Michel Parrot, C. Gaye
To cite this version:
Michel Parrot, C. Gaye. A statistical survey of ELF waves in a geostationary orbit. Geophysical
Research Letters, American Geophysical Union, 1994, 21 (23), pp.2463-2466. �10.1029/94GL01700�.
�insu-03210017�
GEOPHYSICAL RESEARCH LETTERS, VOL. 21, NO. 23, PAGES 2463-2466, NOVEMBER 15, 1994
A statistical survey of ELF waves in a geostationary orbit
M. Parrot and C.A. Gaye
Laboratoire de Physique et Chimie de l'Environnement, CNRS, Orltans, France
Abstract. GEOS 2 is a geostationary satellite that was launched with a wave experiment. The data provided during its lifetime (--- 3.5 years) constitute a unique set for the
statistical study of electromagnetic and electrostatic waves at
L = 6.6. The aim of this paper is to present maps of the
average intensity of the electric and magnetic field. The location of the more intense emissions up to 4.6 kHz is
shown as a function of local time and frequency. Such
emissions are mainly composed of hiss, chorus and electron-
cyclotron harmonic (ECH) waves. Their locations were specified and compared with data from the OCK) 5 and
SCATHA satellites. In particular, this study highlights the
characteristics of chorus emissions with a gap at half the
electron gyrofrequency. It is also shown that global magnetic
activity only slightly influences wave amplitude.
Introduction
This paper presents a statistical study concerning the amplitude of ELF emissions recorded by the geostationary GEOS 2 satellite during several years. Electromagnetic waves observed in the magnetosphere below the electron gyrofrequency are mainly chorus and hiss. These whistler- mode emissions have been known since a long time
(Tsurutani and Smith, 1974; Burtis and Helliwell, 1976), but
their generation mechanism is still under discussion
(Cornilleau-Wehrlin et al., 1993a, and references therein).
General characteristics of the waves observed by the GEOS 1 and GEOS 2 satellites are described by Cornilleau-Wehrlin et al. [1978]. Derailed analysis of events concerning hiss and chorus emissions was made by Hayakawa et al. [1984], and Parrot and Lefeuvre [1986]. Evidence of pitch angle scattering of energetic electrons due to cyclotron resonance with chorus waves has been presented by Foster and Rosenberg [1976]. A substorm dependence of these chorus emissions was noted (e.g. Tsurutani and Smith, 1977; Curtis, 1978; Isenberg et al., 1982). In the frequency range we have
investigated, i.e. 0. - 4.6 kHz, electrostatic waves known as
electron-cyclotron harmonic 0ECH) waves are also present and tend to occur at (n+•A) f•, where f• is the electron gyrofrequency. These ECH waves were intensively studied on GEOS 2 by Gouph et al. [1981], and Belmont et al.
[1983]. Their importance in the diffuse auroral electron
precipitation was investigated by Belmont et al. [ 1983], Canu
et al. [1984], and Roeder and Koons [1989]. The last two
authors have used data from the AMPTE-IRM satellite
(elliptical orbit with a 28.6 ø inclination) and the SCATHA satellite (equatorial orbit with a 7.78 R•, apogee and a 5.32 R•. perigee); they have also statistically analyzed the equatorial magnetospheric wave activity observed by SCATHA (Koons and Roeder, 1990). Unlike the present paper, their work is related to visual inspection of daily
spectrograms, in order to determine the nature of the wave
emissions and their relative occurrence in local time. Section
2 of this paper is devoted to a short description of the GEOS 2 wave experiment and to the data that were used. Statistics and comparisons with previous analyses are given in section 3. Finally, conclusions are presented in section 4.
The data
The GEOS 2 satellite was launched into a geostationary orbit in July 1978, with a wave experiment (S-300) similar to that of the GEOS 1 satellite. Only data from step frequency analyzers (SFA's) are used in this paper. For a detailed description of the GEOS S-300 experiment, see S- 300 Experimenters [1979]. The SFA's could sweep in the range 0-77 kHz, either between two predetermined frequency steps, or between two frequency steps automatically determined to register the most intense signals. However, the signals were mainly recorded between 0.-4.6 kHz, the minimum duration of a frequency step being 86 ms.
The data were recorded 24 hours per day and two types of records were produced: raw data with the time resolution
of the experiment, and compressed data in order to select the
most interesting part of the raw data. The compressed data contain average values of waveforms over 86 ms (the factor of compression was 128) for a given frequency step.
For the purpose of our statistical work, the compressed data were again averaged over 10 minutes for the different
frequency steps between 150 and 4650 Hz. Our data set
contains the amplitude spectrum of one electric and one magnetic component as a function of days and local time. Data from July 26, 1978, until July 31, 1980, and from
February 1, 1981, until June 30, 1982, were taken into
account. This corresponds to measurements performed during roughly 20,000 hours because sometimes the S-300 experiment was outside our frequency range of investigation
or was in an active mode.
Copyright 1994 by the American Geophysical Union. The results
Paper number 94GL01700
0094-8534/94/94GL-01700503.00
All data are summarized in Figures 1 and 3, which represent respectively the average values of the magnetic and
2464 PARROT AND GAYE: ELF WAVES IN GEOSTATIONARY ORBIT
M,.'ACNL
i IC COM
I:•()Nt-LN-!
!
Iooo 2ooo .x}oo 4o0o I- Rt- ()UEN('Y (H)
2O
, , [ ,I, --.(.'.
I,R.
!C COMPONI
•-i.. ,.
1000 2000 5000 4000
F RI- QLJENCY (Hz)
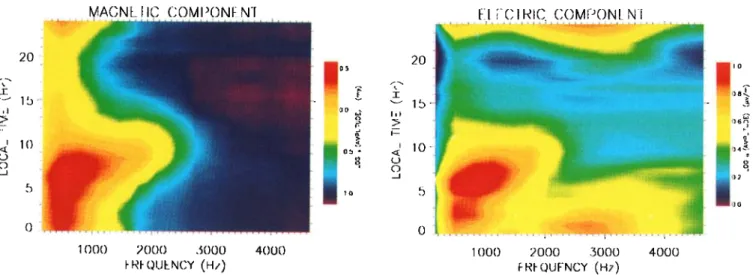
Figure 1. Average intensity of the magnetic signal recorded by the geostationary satellite GEOS 2. The amplitude is represented as a function of local time and frequency, and colour-coded according to the scale on the right.
electric intensities. The data were first averaged in batches of one hour and one frequency step, and shown as a function of local time and frequency. Therefore, they are smoothed, and colour-coded according to the scale on the right. Concerning the magnetic component, the maximum intensity is observed in Figure 1 between 400 and 700 Hz and mainly between 0 LT and 9 LT, with a maximum peak around 6 LT. This point is more clear in Figure 2 where the average magnetic intensity at 450 Hz is represented as a function of local time. Between 6 and 8 LT, strong wave activity can be also
observed up to 1.3 kHz. No intense waves are detected
between 16 and 22 LT. The maximum average magnetic intensity corresponds to 5 my. The electric component in Figure 3 also presents a maximum at the same location, but
in addition electrostatic waves can be seen between 2.1 and
3.4 kHz, and 23 and 2 LT. The maximum average electric intensity of all emissions in Figure 3 is 12 pV/m.
MAGNETIC
COMPONE,
.N.T.
(,4.50.
Hz)
6 i
'
,
•---. 5E 4
-'e ._.3 .-- a_ 2 E '< 1 0 .... I .... i .... i .... i , ß ß 0 5 10 15 20 Local TimeFigure 2. From the data set shown in Figure 1, amplitude of the average intensity of the magnetic signal at 450 Hz
represented as a function of local time
Figure
3. Same
as in Figure.
1 but for the electric
signal.
The lack of emissions between 16 and 22 LT occurred
when GEOS 2 was located inside the plasmasphere in the bulge. According to Higel and Wu lei [1984], the average local time of bulge crossing by GEOS 2 was around 18 LT, and showed that this local time and the duration of crossing the bulge depended on magnetic activity. This lack of emissions was also observed with aGO 5 by Tsurutani and Smith [1977], and with SCATHA by Koons and Roeder
[1990].
The emissions, which are mainly located between 400 and 700 Hz, are certainly a mixture of hiss and chorus. Preliminary observations with GEOS 1 by Cornilleau- Webflirt et al. [ 1978] have indicated that very commonly hiss and chorus occur together. They have shown that chorus are mainly observed well before dawn and up to noon, whereas hiss are more present from noon to dusk. This is consistent
with our observations, which show that, because chorus
intensity generally is higher than hiss intensity, the maximum amplitude in Figures 1 and 3 is observed between 0 and 9 LT. This result is confirmed by SCATHA observations (Koons and Roeder, 1990). Hiss and chorus generally occur
in the same frequency band, except when chorus are composed of two frequency bands: one above f•/2, and the other below f•/2 (Tsurutani and Smith, 1974; Anderson and Maeda, 1977). Different mechanisms to explain this frequency gap are generally invoked. Tsurutani and Smith [1974] ascribed the gap to a Landau damping mechanism, whereas Maeda et al. [1976] proposed a two-source model. Curtis [1978] suggested that the lower emission is
represented
by whistler
noise,
and the upper
emission
by
ordinary mode emissions.Visual
inspection
of spectragrams
recorded
at regular
intervals during the GEOS 2 lifetime, have shown that hiss
bands are never above 1 kHz. Therefore, our statistics indicate that the characteristic two-banded chorus emissions are mostly observed between 6 and 12 LT, when the
frequency of the more intense electromagnetic emissions
increases
up to 2.2 kHz. At this
local
time
the average
value
of f•2 is about
1.3 kHz, but the fluctuation
of this
quantity
does
not allow a real determination
of the gap between
the
PARROT AND GAYE: ELF WAVES IN GEOSTATIONARY ORBIT 2465
two chorus bands. During the same time interval we notice that, first, the lower frequency band is consistently more intense than the upper frequency band, and, second, that the more intense emissions occur at the beginning, between 6 and 9 LT. This general observation is well supported by a case study by Hayakawa et al. [1984], who investigated all chorus emissions with GEOS 2 for a specific day. Koons and
Roeder [1990] deduced from SCATHA data that there is no
distinction in local time between chorus containing a gap at f•J2 and others, because they only surveyed the occurrence
and not the intensity of the emissions. GEOS 2 data,
however, show chorus emissions with a gap at fd2 for
different local times (Hayakawa et al., 1984), but their
discrete elements were fewer in number and their amplitudes
much lower. This observation of strong two-banded chorus
emissions between 6 and 9 LT must be considered in the
future to explain their generation mechanism. For example,
the enhancement of chorus in this time interval fits well with
mechanism of intensification of the loss cone instability due
to the inclusion of thermal plasma from the sunlit ionosphere (Jentsch, 1976; Tsurutani and Smith,1977).
The electrostatic emission around 2.7 kHz, seen in
Figure 3 between 23 and 2 LT, corresponded to the first
harmonic (n= 1) of ECH waves occurring at (n-PA) f•. The
more intense emissions occurred at 2.7 kHz and around 1
LT. This observation specifies and confirms the general results of Canu et al. [1984], who investigated with GEOS
2 the ECH waves up to 77 kHz. However, the location in local time of the SCATHA ECH emissions, presented by
Koons and Roeder [1990], is more centred around 6 LT.
Figures 1-3 were obtained for all levels of magnetic
activity. If we now consider the same statistics for different
levels of magnetic activity, the positions of the maximum wave intensity do not significantly vary and only maximum
average values change. For example, we respectively obtain
10 my and 24 gV/m for the magnetic and electric
components when we only take into account the emissions
with AE > 300. In this last calculation, we considered that
the equatorial chorus are substorm related (e.g. Tsurutani and Smith, 1977): the drift time of 25 keV electrons from midnight to GEOS 2 was introduced. A search of the more
intense values of our data set was thus made, and the
maximum value of the magnetic component (averaged over 10 minutes) now is 1.04 T. The maximum value of the electric component is 0.73 mV/m, and the maximum intensity
of the first harmonic of the ECH waves is 0.69 mV/m. This
relatively small maximum value measured in the nightside
during all the GEOS 2 lifetime confirm the observations of
Belmont et al. [1983], and their hypothesis that diffuse auroras are not only due to ECH waves.
Conclusions
Compared with previous studies, we have presented
more detailed statistics of emissions observed at L = 6.6 up
to 4.6 kHz. Average spectrograms (frequency, local time) of one electric and one magnetic component were discussed. Concerning the amplitude, the main conclusions are: i) the most intense electromagnetic emissions occur at a frequency
of 400 to 700 Hz, and at a local time between 0 and 9 LT, ii) the most intense electrostatic emissions occur at a
frequency of 2.1 to 3.4 kHz, and at a local time between 23 and 2 LT, iii) the most intense chorus emissions with a gap at f•J2 occur at a local time between 6 and 9 LT. Magnetospheric substorms (AE > 300) do not trigger emissions in other places and only enhance their maximum average amplitudes by a factor of 2.
In the future, it is expected that new investigations will be part of the ISTP (lntemational Solar-Terrestrial Physics) programme with the projects CLUSTER and EQUATOR-S. The frequency range of our statistical study is similar to that of the planned CLUSTER wave experiment (Cornilleau-
Wehrlin et al., 1993b).
Acknowledgments. Thanks are due to P. Crozet for his
help during the data handling. The authors are grateful to the referees for their useful comments.
References
Anderson, R.R., and K. Maeda, VLF emissions associated
with enhanced magnetospheric electrons, J. Geophys.
Res., 82, 135-146, 1977.
Belmont, G., D. Fontaine, and P. Canu, Are equatorial electron cyclotron waves responsible for diffuse auroral
precipitation?, J. Geophys. Res., 88, 9163-9170, !983.
Burfi's, W.J., and R.A. Helliwell, Magnetospheric chorus: occurrence patterns and normalized frequency, Planet.
Space Sci., 24, 1007-1024, 1976.
Canu, P., G. Belmont, and D. Fonmine, Role of the
equatorial ECH waves in the generation of diffuse
auroras, ESA SP-217, 581-584, 1984.
Comilleau-Wehrlin, N., R. Gendrin, F. Lefeuvre, M. Parrot,
R. Grard, D. Jones, A. Bahnsen, E. Ungstrup, and W. Gibbons, VLF electromagnetic waves observed onboard
GEOS 1, Space Sci. Rev., 22, 371-382, 1978.
Cornilleau-Wehrlin, N., J. Solomon, A. Korth, and G.
Kremser, Generation mechanism of plasmaspheric ELF/VLF hiss: A statistical study from GEOS 1 data,
J. Geophys. Res., 98, 21,471-21,479, 1993a.
Comilleau-Wehrlin, N., et al., STAFF (Spatio Temporal Analysis of Field Fluctuations) experiment for the
CLUSTER mission, ESA SP-1159, 33-48, 1993b.
Curtis, S.A., A theory for chorus generation by energetic
electrons during substorms, J. Geophys. Res., 83,3841-
3848, 1978.
Foster, J.C., and T.J. Rosenberg, Electron precipitation and VLF emissions associated with cyclotron resonance interactions near the plasmapause, J. Geophys. Res., 81,
2183-2192, 1976.
Gouph, M.P., P.J. Christiansen, and E.J. Gershuny, ES wave
morphology near geostationary orbit, Adv. Space Res.,
1,337-343, 1981.
Hayakawa, M., Y. Yamanaka, M. Parrot, and F. Lefeuvre,
The wave normals of magnetospheric chorus emissions
observed on board GEOS 2, J. Geophys. Res., 89, 2811-
2821, 1984.
Hige!, B., and Wu Lei, Electron density and plasmapause characteristics at 6.6 R•.: A statistical study of the
2466 PARROT AND GAYE: ELF WAVES IN GEOSTATIONARY ORBIT
GEOS
2 relaxation
sounder
data,
J. Geophys.
Res.,
89,
1583-1601, 1984.Isenberg, P.A., H.C. Koons, and J.F. Fennell, Simultaneous observations of energetic electrons and dawnside chorus
in geosynchronous
orbit,
J. Geophys.
Res.,
87, 1495-
1503, 1982.
Jentsch, V., Electron precipitation in the morning sector of the auroral zone, J. Geophys. Res., 81, 135-146, 1976. Koons, H.C., and J.L. Roeder, A survey of equatorial
magnetospheric wave activity between 5 and 8
Planet. Space Sci., 38, 1335-1341, 1990.
Maeda, K., P.H. Smith, and R.R. Anderson, VLF emissions
from ring current electrons, Nature, 263(5572), 37-39,
1976.
Parrot, M., and F. Lefeuvre, Statistical study of the
propagation characteristics of ELF hiss observed on
GEOS 1, inside and outside the plasmasphere, Annales
Geophysicae, 4A, 363-384, 1986.
Roeder, J.L., and H.C. Koons, A survey of electron cyclotron waves in the magnetosphere and the diffuse auroral electron precipitation, J. Geophys. Res., 94, 2529-2541,
1989.
S300 Experimenters, Measurements of electric and magnetic wave fields and of cold plasma parameters on-board GEOS 1. Preliminary results, Planet. Space Sci., 27,
317-339, 1979.
Tsumtani, B.T., and E.J. Smith, Postmidnight chorus: a substorm phenomenon, J. Geophys. Res., 79, 118-127,
1974.
Tsumtani, B.T., and E.J. Smith, Two types of magnetospheric ELF chorus and their substorm dependences, J.
Geophys. Res., 82, 5112-5128, 1977.
C.A. Gaye and M. Parrot, Laboratoire de Physique et Chimie
de l'Environnement, 3A, Avenue de la Recherche, 45071
Orl6ans Cedex 02, France (e-mail:[email protected]).
(Received: December ! 0, 1990;
Revised: February 04, 1991;