HAL Id: cea-01004432
https://hal-cea.archives-ouvertes.fr/cea-01004432
Submitted on 26 Sep 2019
HAL is a multi-disciplinary open access
archive for the deposit and dissemination of
sci-entific research documents, whether they are
pub-lished or not. The documents may come from
teaching and research institutions in France or
abroad, or from public or private research centers.
L’archive ouverte pluridisciplinaire HAL, est
destinée au dépôt et à la diffusion de documents
scientifiques de niveau recherche, publiés ou non,
émanant des établissements d’enseignement et de
recherche français ou étrangers, des laboratoires
publics ou privés.
Dust and gas in luminous proto-cluster galaxies at
z=4.05: the case for different cosmic dust evolution in
normal and starburst galaxies
Q. Tan, Emanuele Daddi, G. Magdis, M. Pannella, M. Sargent, D. Riechers,
M. Béthermin, F. Bournaud, C. Carilli, E. da Cunha, et al.
To cite this version:
Q. Tan, Emanuele Daddi, G. Magdis, M. Pannella, M. Sargent, et al.. Dust and gas in luminous
proto-cluster galaxies at z=4.05: the case for different cosmic dust evolution in normal and starburst
galaxies. Astronomy and Astrophysics - A&A, EDP Sciences, 2014, 569, pp.A98.
�10.1051/0004-6361/201423905�. �cea-01004432�
arXiv:1403.7992v2 [astro-ph.GA] 15 Aug 2014
April 2, 2018
Dust and gas in luminous proto-cluster galaxies at z=4.05: the case
for different cosmic dust evolution in normal and starburst galaxies
Q. Tan
1, 2, 3, E. Daddi
1, G. Magdis
4, M. Pannella
1, M. Sargent
5, D. Riechers
6, M. Béthermin
1, F. Bournaud
1, C. Carilli
7,
E. da Cunha
8, H. Dannerbauer
9, M. Dickinson
10, D. Elbaz
1, Y. Gao
2, J. Hodge
8, F. Owen
7, and F. Walter
8 1 CEA Saclay, DSM/Irfu/Service d’Astrophysique, Orme des Merisiers, F-91191 Gif-sur-Yvette Cedex, France2 Purple Mountain Observatory & Key Laboratory for Radio Astronomy, Chinese Academy of Sciences, Nanjing 210008, China 3 Graduate University of the Chinese Academy of Sciences, 19A Yuquan Road, Shijingshan District, Beijing 10049, China 4 Department of Physics, University of Oxford, Keble Road, Oxford OX1 3RH, UK
5 Astronomy Center, Dept. of Physics & Astronomy, University of SUssex, Brighton BN1 9QH, UK 6 Department of Astronomy, Cornell University, 220 Space Sciences Building, Ithaca, NY 14853, USA 7 National Radio Astronomy Observatory, P.O. Box O, Socorro, NM 87801, USA
8 Max-Planck Institute for Astronomy, Königstuhl 17, 69117 Heidelberg, Germany 9 Universität Wien, Institut für Astrophysik, Türkenschanzstrasse 17, 1180 Vienna, Austria 10 National Optical Astronomical Observatory, 950 North Cherry Avenue, Tucson, AZ 85719, USA
Received 30 March 2014/Accepted 11 July 2014
ABSTRACT
We measure the dust and gas content of the three sub-millimeter galaxies (SMGs) in the GN20 proto-cluster at z = 4.05 using new IRAM Plateau de Bure interferometer (PdBI) CO(4-3) and 1.2–3.3 mm continuum observations. All these three SMGs are heavily dust obscured, with UV-based star formation rate (SFR) estimates significantly smaller than the ones derived from the bolometric infrared (IR), consistent with the spatial offsets revealed by HST and CO imaging. Based also on evaluations of the specific SFR, CO-to-H2conversion factor and gas depletion timescale, we classify all the three galaxies as starbursts (SBs), although with a lower
confidence for GN20.2b that might be a later stage merging event. We place our measurements in the context of the evolutionary properties of main sequence (MS) and SB galaxies. ULIRGs have 3–5 times larger L′
CO/Mdustand Mdust/M⋆ratios than z = 0 MS
galaxies, but by z ∼ 2 the difference appears to be blurred, probably due to differential metallicity evolution. SB galaxies appear to slowly evolve in their L′
CO/Mdustand Mdust/M⋆ratios all the way to z > 6 (consistent with rapid enrichment of SB events), while
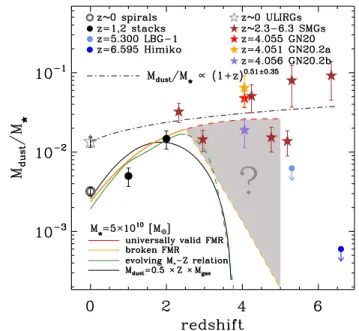
MS galaxies rapidly increase in Mdust/M⋆from z = 0 to 2 (due to gas fraction increase, compensated by a decrease of metallicities).
While no IR/submm continuum detection is available for indisputably normal massive galaxies at z > 2.5, we show that if metallicity indeed decrease rapidly for these systems at z > 3 as claimed in the literature, we should expect a strong decrease of their Mdust/M⋆,
consistent with recent PdBI and ALMA upper limits. We conclude that the Mdust/M⋆ratio could be a powerful tool for distinguishing
starbursts from normal galaxies at z > 4.
Key words. galaxies: evolution – galaxies: high-redshift – galaxies: starburst –galaxies: star formation – submillimeter: galaxies
1. Introduction
Submillimeter (submm) and millimeter observations are efficient in detecting and studying dusty, star-forming galaxies, due to the effect of negative K-correction, which results in nearly constant observed brightness for galaxies with same infrared (IR) lumi-nosity over a broad range of redshifts. However, most current deep submm surveys are limited to the brightest sources and submm-selected galaxies (SMGs; Blain et al. 2002), due to the limited spatial resolution and sensitivity of submm observations. SMGs are massive, highly dust obscured galaxies with extreme star formation rates (SFRs) of order 103M
⊙yr−1(e.g., review by Blain et al. 2002; Casey et al. 2014), and are generally thought to represent the progenitors of local massive elliptical galaxies. While spectroscopic studies of SMGs originally gave a median redshift of z∼2.5 (Chapman et al. 2005), recent deep submm/mm continuum and radio observations show evidence for a signifi-cant population of higher redshift massive starbursts (SBs; e.g., Dannerbauer et al. 2004; Smolˇci´c et al. 2012; Swinbank et al. 2013; Dowell et al. 2014), extending the redshift peak beyond
z = 3. A substantial number of z > 4 SMGs have been
identified to date (e.g., Dannerbauer et al. 2008; Daddi et al. 2009a,b; Capak et al. 2008, 2011; Schinnerer et al. 2008; Coppin et al. 2009; Knudsen et al. 2010; Riechers et al. 2010a, 2013; Smolˇci´c et al. 2011; Walter et al. 2012; Combes et al. 2012; Vieira et al. 2013). The surface density of these galaxies is found to be significantly higher than that expected from the-oretical models (e.g., Baugh et al. 2005; Hayward et al. 2013), suggesting that current models of galaxy formation underpredict the number of high-redshift starbursts.
Observations of the molecular gas in high-redshift galax-ies reveal that while SMGs are highly gas-rich systems (Tacconi et al. 2008), the gas fractions of these systems are comparable to those of typical massive galaxies at similar epochs (∼40-60%; Daddi et al. 2008, 2010), implying that SMGs have higher star formation efficiencies (SFEs; Daddi et al. 2010; Genzel et al. 2010). However, these results are compli-cated by the large uncertainties associated with the CO-to-H2
conversion factor αCO 1, which likely changes between nor-mal disk galaxies and starbursts (see review by Bolatto et al. 2013; Carilli & Walter 2013). In the literature, an “ULIRG-like” value of αCO = 0.8 (Downes & Solomon 1998; but see Papadopoulos et al. 2012 for a higher value of αCO) is widely adopted for SMGs due to the lack of direct measurements, while a value of αCO∼4 is favored for Milky Way and normal galaxies. This carries a significant uncertainty since high redshift SMGs may be dramatically different from local ULIRGs, given the more extended gas distribution and different physical conditions revealed in some SMGs (Riechers et al. 2011; Ivison et al. 2011; Carilli & Walter 2013; Scoville et al. 2014). Therefore, it is of significant importance to obtain a direct calibration of αCO, since well-determined molecular gas masses are critical to study the variations in physical properties across the galaxy populations at high redshift.
Because of the extreme high specific star formation rates (sSFRs), some of the most luminous SMGs are placed as out-liers above the main sequence (MS) of star formation, which is a tight correlation observed between the stellar mass and the SFR over a broad range of redshifts (e.g., Noeske et al. 2007; Elbaz et al. 2007; Daddi et al. 2007b; Rodighiero et al. 2010, and references therein). While galaxies on the MS are thought to form stars gradually with a long duty cycle and represent the bulk of the galaxy population, starbursts exhibit very intense and rapid star formation activity, likely driven by mergers (e.g., Daddi et al. 2007a,b; Tacconi et al. 2008, 2010; Elbaz et al. 2011; Rodighiero et al. 2011). Recent studies on the molecular gas of z > 3 Lyman break galaxies (LBGs) found these galaxies to be rather deficient in CO emission for their star formation activity (Magdis et al. 2012b; Tan et al. 2013). Similar results have also been reported for a luminous LBG at
z = 6.595 called “Himiko”, for which the 1.2 mm dust
contin-uum and [CII] 158 µm emission are much lower than predicted by local correlations and measured SFRs (Ouchi et al. 2013). It has been found that normal galaxies at z > 3 are increasingly metal poor, with metallicities dropping by about 0.6 dex as com-pared to local galaxies of similar stellar mass (Mannucci et al. 2010; Sommariva et al. 2012; Troncoso et al. 2014). This may suggest that metallicity effects could be a probable explanation for the deficit of CO emission, since the photodissociation of CO by far-UV radiation is enhanced at low metallicity (Leroy et al. 2011; Genzel et al. 2012; Narayanan et al. 2012; Bolatto et al. 2013). The decrease of CO emission in z > 3 normal galax-ies for their IR luminosity is also predicted by simulations with a galaxy-formation model (Lagos et al. 2012), a result driven by the low metallicities in such objects. Similar detailed study of a local metal poor star-forming galaxy, I Zw 18, concluded that it would be much harder than hitherto anticipated to de-tect gas and dust in high-redshift galaxies like Himiko (sev-eral tens of days of integration with the complete ALMA; see Fisher et al. 2014), if assuming I Zw 18 is an analog of primitive galaxy population in the early Universe. Dust is expected and observed to be well mixed with gas in the interstellar medium (ISM), because it is composed of metals and regulates the gas phase abundances of the elements through accretion and destruc-tion processes (Draine & Li 2007). The comparison of dust and gas properties of galaxies at different redshifts is thus crucial to explore the interplay between dust, gas, and metals in the ISM, and allow us to achieve a better understanding of galaxy
1 α
CO= MH2/L
′
CO, with units of M⊙(K km s
−1pc2)−1, which are
omit-ted from the text for brevity. Note that the contribution from Helium is included in the αCOestimates.
evolution throughout cosmic time. For galaxies at z > 3, to date only very few luminous SMGs have been detected in both dust continuum and gas emission (e.g., Dannerbauer et al. 2008; Daddi et al. 2009a,b; Coppin et al. 2009, 2010; Walter et al. 2012; Riechers et al. 2013), while no dust continuum detection is available for indisputably normal galaxies at z > 3.5.
GN20 is one of the brightest SMGs in the GOODS-N field (Pope et al. 2006), of which the redshift (z = 4.055) was es-tablished by a serendipitous detection of its CO(4-3) emis-sion (Daddi et al. 2009b). Two additional SMGs, GN20.2a and GN20.2b, were found to lie within ∼25′′ of GN20 (projected physical separation ∼ 170 kpc) and have redshifts of z ∼ 4.055±0.005. These two galaxies are separated by only a few arcseconds and hence are not spatially separated from each other in existing submm images (e.g., SCUBA 850 µm). Daddi et al. (2009b) also found 14 B-band dropouts (roughly z ∼ 4) lying within 25′′from GN20, which corresponds to an overdensity of 5.8σ in the GOODS-N field, suggesting a massive proto-cluster environment at z ∼ 4.05, just 1.6 Gyr after the Big Bang. All three massive SMGs in the GN20 proto-cluster have been de-tected in CO emission, indicative of large amounts of molecular gas (Daddi et al. 2009b; Carilli et al. 2010, 2011; Hodge et al. 2012, 2013), feeding vigorous ongoing star formation (SFR ∼ a few to ten times 100 M⊙yr−1). The deep, high-resolution CO(2-1) observations reveal a clumpy, extended gas disk (14±4 kpc in diameter) for GN20 (Hodge et al. 2012), and extended gas reservoirs (∼ 5–8 kpc) for GN20.2a and GN20.2b (Hodge et al. 2013). Hodge et al. (2012, 2013) have attempted to constrain the estimate of CO-to-H2conversion factor by dynamical analysis, deriving αCOof ∼ 1–2 for these three galaxies. For the dust con-tinuum emission, however, only GN20 has been reported in
Her-schel and (sub)mm detections (Daddi et al. 2009b; Magdis et al.
2011). Here we use PACS and PdBI mm data for GN20.2a and GN20.2b to study the dust properties of these two galaxies. By combining with the molecular gas properties and dynami-cal analysis, we aim to achieve a more comprehensive under-standing of the nature of the massive SMGs in the GN20 proto-cluster environment. We further investigate the metallicity ef-fects on molecular gas and dust emission by comparison of CO luminosity-to-dust mass ratio and dust-to-stellar mass ratio be-tween normal galaxies and starbursts.
This paper is organized as follows. In Sect. 2 we present the new PdBI CO(4-3) observations and the reduction of data for the SMGs GN20, GN20.2a, and GN20.2b. Section 3 presents the re-sults of CO and millimeter continuum observations, the methods used to compute SFR, dust mass, stellar mass, metallicity, dy-namical mass, and CO-to-H2conversion factor. This section also describes the derived physical properties including sSFR, SFE, radio-IR correlation constraints, gas fraction, and gas depletion timescales. In Sect. 4 we discuss the nature of GN20, GN20.2a, and GN20.2b based on the physical properties of optical mor-phology, molecular gas, dust, and dynamical constraints. We fur-ther discuss the implications for the cosmic evolution of dust content in galaxies in sect. 5. Finally, we summarize our results in Sect. 6. We adopt a cosmology with H0=71 km s−1 Mpc−1,
ΩM=0.3, ΩΛ=0.7, and a Chabrier (2003) initial mass function (IMF) throughout the paper.
2. Observations and Data Reductions
We used the IRAM PdBI to observe the CO(4-3) emission in the GN20 field in the AB, C and D configurations. The AB configu-ration observations were pointed close to a nearby z = 1.5 galaxy and have been reported in Daddi et al. (2009b), while the new C
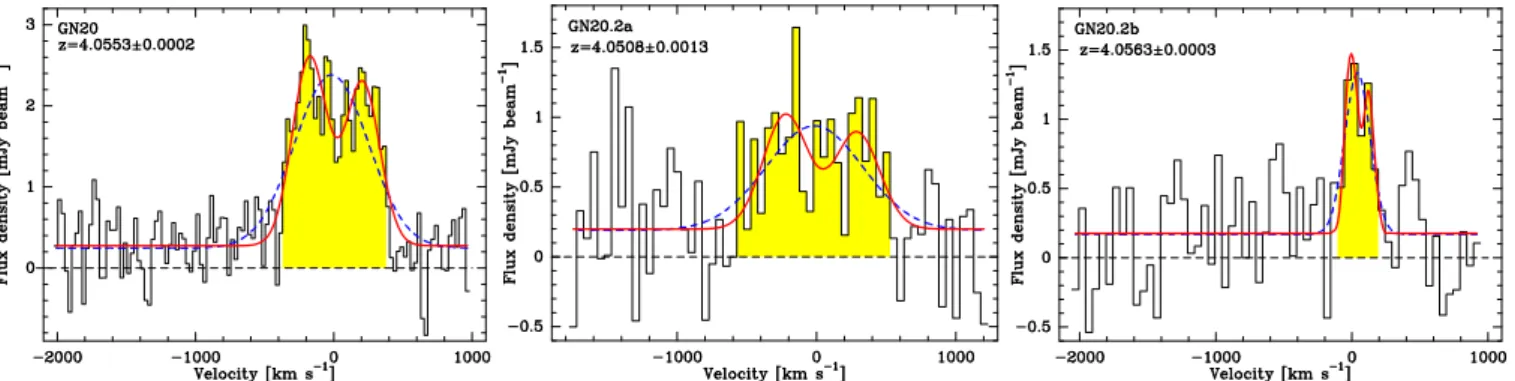
Fig. 1. CO(4-3) spectra binned in steps of 25 km s−1 for GN20 (left), 50 km s−1 for GN20.2a (middle) and GN20.2b (right). The yellow color
indicates the velocity ranges where line emission is detected. These regions have been used to derive the integrated fluxes. The red lines show best-fitting double Gaussian profiles to the spectra, and the blue dashed lines show the fits with a single Gaussian. Zero velocities correspond to the redshifts listed in Table 1.
Table 1. Observed and derived CO emission properties
Source R.A.CO Decl.CO zCO zkeck FWHM ICO(4−3) L′CO(4−3)
(J2000) (J2000) (km s−1) (Jy km s−1) (K km s−1pc2)
GN20 12:37:11.91 62:22:12.1 4.0553±0.0002 4.06±0.02 583±36 1.68±0.10 6.56×10¹⁰
GN20.2a 12:37:08.76 62:22:01.6 4.0508±0.0013 4.059±0.007 760±180 0.65±0.08 2.70×10¹⁰
GN20.2b 12:37:09.68 62:22:02.2 4.0563±0.0003 ... 220±43 0.27±0.04 1.06×10¹⁰
and D configuration observations, carried out in June 2009 and January-April 2013, were centered near a z = 4.058 LBG, which is located ∼ 16′′south of GN20 (Daddi et al. 2009b). Both GN20 and its companions, GN20.2a and GN20.2b, are within the pri-mary beam of the PdBI observations. The pripri-mary beam attenua-tion (PBA) for GN20, GN20.2a, and GN20.2b are 1.29, 1.44, and 1.20 in C configuration observations, and 1.27, 1.18, and 1.06 in D configuration observations, respectively. All observations were tuned at a central frequency of 91.375 GHz and performed in dual polarization mode with six antennas available. For the observations performed in 2013, a 3.6 GHz WIDEX correlator was used. Further details on the observations can be found in Tan et al. (2013).
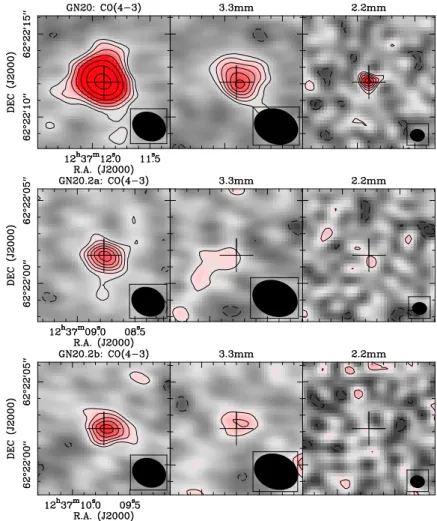
We reduced the data with the GILDAS software packages CLIC and MAPPING. After flagging bad and high phase noise data, and correcting for the PBA, the total effective on-source in-tegration time for GN20, GN20.2a, and GN20.2b are 14.6 h, 11.9 h, and 15.1 h, respectively. We combined the C and D configura-tion data with published AB configuraconfigura-tion observaconfigura-tions to max-imize the sensitivity. The spectra shown in Fig. 1 were extracted from the combined UV data by using a circular Gaussian model with a fixed full width at half maximum (FWHM) of 0.72′′, 0.53′′, 0.88′′ for GN20, GN20.2a, and GN20.2b (Carilli et al. 2010; Hodge et al. 2013), respectively. The CO(4-3) images in-tegrating over the velocity range where emission was detected and the 3.3 mm maps averaging over the line-free channels for the three galaxies are shown in Fig. 2. In order to avoid the con-tamination from the side lobes of the bright GN20 galaxy, the emission at the position of GN20 was fitted in the UV data with a circular Gaussian source model and subtracted before creat-ing the images of GN20.2a and GN20.2b shown in Figure 2. The sensitivities of combined data set at the position of GN20, GN20.2a, and GN20.2b are 0.41, 0.63, and 0.52 mJy beam−1per 25 km s−1channel.
We make use of the 1.2 mm and 2.2 mm continuum obser-vations of the GN20 field with the PdBI. The 2.2 mm continuum data of our three galaxies haven been reported in Carilli et al.
(2010). More details on the 1.2 mm observations and reduction will be given in Riechers et al. (in prep.).
3. Results and Analysis
3.1. CO(4-3) emission properties
The CO detections of GN20, GN20.2a, and GN20.2b at var-ious transitions have been presented in some recent studies (Daddi et al. 2009b; Carilli et al. 2010, 2011; Hodge et al. 2012, 2013). Compared to these published work, our new deep CO(4-3) data allow us to improve the constraint on the CO redshift, flux density, and line width, which is a vital parameter for the deter-mination of dynamic mass. In addition, we put useful constraints on the 3 mm continuum emission for these SMGs. Table 1 sum-marizes the observed and derived CO properties for these three galaxies.
To measure the velocity centroid and line width of CO emission of GN20, we fitted Gaussians to the observed spec-tra (Fig. 1), which is exspec-tracted at the fixed CO position from Daddi et al. (2009b), allowing for the presence of faint under-lying continuum. The CO(4-3) spectrum of GN20 shows clear evidence of double-peaked structure. A single Gaussian fit to the spectrum shown in Fig. 1 yields a peak flux density of 2.13±0.14 mJy and an FWHM of 630±51 km s−1, consistent with Daddi et al. (2009b). We also fitted the spectrum with a double Gaussian function by fixing the FWHM in each com-ponent to the same value. The peak flux densities for the two components are 2.33±0.17 mJy and 2.02±0.16 mJy, respec-tively. We find that the total FWHM (583±36 km s−1) derived from a double Gaussian fitting is better constrained than that from a single one. The redshift derived from a double Gaussian is 4.0553±0.0002, consistent with the previous measurements (Daddi et al. 2009b; Carilli et al. 2011; Hodge et al. 2012). A circular Gaussian model fit with a fixed FWHM of 0.72′′ (we here adopt the FWHM of the CO(6-5) image measured by Car-illi et al. 2010) to the CO(4-3) image of GN20 (Fig. 2) yields a
Fig. 2. PdBI maps (from left to right) of CO(4-3) line, 3.3 mm, and 2.2 mm continuum emission for GN20 (top), GN20.2a (middle), and GN20.2b
(bottom). The CO(4-3) images are averaged over the observed velocity range of CO emission (see Fig. 1) and were cleaned. The 2.2 mm and 3.3 mm continuum maps were created by averaging over the line-free emission channels and were not cleaned given the relatively low S/N. The crosses show the positions where we extract CO spectra. For GN20, the contours level of CO(4-3) are shown increase by a factor of 1.5 starting at ±2σ, with positive (negative) contours shown as solid (dashed) lines. For all the continuum maps and CO(4-3) maps of GN20.2a and GN20.2b, contours start at ±2σ in steps of 1σ. Beam sizes are displayed in the lower right corner of each integrated map.
velocity-integrated flux of ICO = 1.68 ± 0.10 Jy km s−1, in line with the measurements in Daddi et al. (2009b).
For GN20.2a, the fits with a single Gaussian and two Gaus-sian functions yield FWHM of 820±237 km s−1 and 763±180 km s−1, respectively. The spectrum is extracted at the fixed CO position from Daddi et al. (2009b). We find the CO spectrum of GN20.2a appears to be better described by a double Gaussian profile (Fig. 1), given the relatively low uncertainties of FWHM derived from double Gaussian fitting and the rapid decrease of the flux at the edges of the spectrum, though there is no clear in-dication of double-peaked emission in the spectrum. The favored fit with two Gaussian functions could in principle suggests either the existence of a rotating component, or kinematically distinct components undergoing a merger within the system. We will further discuss the possibility in the following section. The two components in the double Gaussian fitting have peak flux densi-ties of 0.82±0.21 mJy and 0.69±0.22 mJy, respectively. A Gaus-sian fit to the CO spectrum gives a redshift of 4.0508±0.0013. We used a circular Gaussian model with a fixed FWHM of 0.53′′ (derived from CO(2-1) image in Hodge et al. 2013) to fit the CO(4-3) map and derive a velocity-integrated flux of 0.65±0.08 Jy km s−1. All the measurements derived for GN20.2a are con-sistent with published results (Daddi et al. 2009b; Carilli et al.
2011; Hodge et al. 2013), but exhibit significantly improved sen-sitivity and signal-to-noise (S/N) ratio.
The CO(4-3) spectrum of GN20.2b has been presented in Hodge et al. (2013). Compared to the large uncertainty in the line width fitted in Hodge et al. (2013), our deeper CO(4-3) data provide a much better constraint on the estimate of the line width. Similarly, we performed Gaussian fits to the spectrum (Fig. 1) extracted at the fixed position of 1.2 mm emission in GN20.2b (Riechers et al., in prep.) with a single Gaussian and double Gaussian functions, respectively. Both Gaussian fits give a similar FWHM with value of ∼ 220 ± 40 km s−1, which is much smaller than GN20 and GN20.2a, and also the SMGs at
z ∼ 2 − 4 with mean FWHM of 470±80 km s−1(Bothwell et al.
2013). The Gaussian fit to the spectrum has a peak flux density of 1.17±0.19 mJy and a redshift of 4.0563±0.0003. The velocity-integrated flux density derived from the CO(4-3) map with a cir-cular Gaussian model (fixed FWHM of 0.88′′; see Hodge et al. 2013) is 0.27±0.04 Jy km s−1.
We calculate the CO(4–3) line luminosities (in K km s−1pc2) using the standard relation given by Solomon et al. (1997):
L′CO= 3.25 × 10⁷SCO∆Vν−obs2D 2 L(1 + z)
−3 (1)
where SCO∆V is the velocity-integrated line flux in Jy km s−1,
νobsis the observed frequency in GHz and DL is the luminos-ity distance in Mpc. With L′
(2011), we find CO(4-3)/CO(2-1) line brightness temperature ra-tios of r43/21 = 0.41, 0.36, and 0.44 for GN20, GN20.2a, and GN20.2b, respectively. These are consistent with the mean ratio (∼0.48±0.10) measured for SMGs at z ∼ 2 − 4 (Bothwell et al. 2013).
3.2. The infrared properties
3.2.1. Millimeter continuum emission
Figure 1 shows evidence for 3.3 mm continuum emission. Av-eraging the spectrum in the uv space for velocities outside of CO(4-3) line emission range, we find a bright source at the po-sition of GN20, and 3.3 mm continuum detections with signif-icance of 2.5σ and 3.3σ for GN20.2a and GN20.2b (Fig. 2), respectively. The flux densities are measured by fitting Gaussian functions to the maps using sizes estimated from the CO imag-ing and are summarized in Table 2. The 3.3 mm flux density of GN20 is consistent with the lower S/N measurement reported in Daddi et al. (2009b), while for GN20.2a and GN20.2b, they are presented here for the first time.
In addition, we detect 1.2 mm emission of GN20, GN20.2a, and GN20.2b in PdBI maps with significant S/N level (see Riechers et al., in prep.). Measured fluxes are in the range of 3.3–8.5 mJy (Table 2) and are used in the remainder of the pa-per. We also make use of 2.2 mm continuum data of these three galaxies, which have been reported in Carilli et al. (2010). Sim-ilar to the measure of CO(4-3) flux density, we used a circular Gaussian model with a fixed FWHM, same as the one used for CO(4-3) map, to fit the 1.2 and 2.2 mm images for each galaxy. For a consistency check, assuming an GN20-like spectral en-ergy distribution (SED; Magdis et al. 2011), we extrapolate the flux density of 1.2 mm to 2.2 mm and 3.3 mm for GN20.2a and GN20.2b, and find these predictions match with the 2.2 mm and 3.3 mm flux densities derived from PdBI maps. The derived mm flux densities for these galaxies are summarized in Table 2.
3.2.2. Dust masses, dust temperatures and SFRs
Because they sample the rest-frame far-IR/submm bands at the Rayleigh-Jeans tail, the mm data have been demonstrated to have significant impact on the derivation of far-IR properties of high redshift galaxies (Magdis et al. 2012a), particularly crucial to re-duce the uncertainties of dust mass estimates. Combining the
Spitzer IRAC, MIPS photometry (Daddi et al. 2009b) with the Herschel PACS 100 µm, 160 µm and SPIRE 250 µm
photome-try (for GN20.2a and GN20.2b, the 250 µm data were not used for SED fitting because the 250 µm photometry is blended be-tween these two galaxies) and following Magdis et al. (2012a), we derive the dust mass of the galaxies by fitting the IR SED using the Draine & Li (2007, hereafter DL07) dust models. The DL07 model describes the interstellar dust as a mixture of car-bonaceous and amorphous silicate grains, with a size distribu-tion mimicking the Milky Way extincdistribu-tion curve. The fracdistribu-tion of dust mass in the form of polycyclic aromatic hydrocarbon (PAH) grains (with < 103carbon atoms) is parametrized by the PAH index, qPAH. The PAH abundance has an important effect in shaping the galaxy SED at short wavelengths. According to the DL07 model, the spectrum of a galaxy can be described by a linear combination of one stellar component approximated by a blackbody with a color temperature of 5000 K and two dust com-ponents (see Magdis et al. 2012a). The majority (i.e., 1 − γ with 0.0 < γ < 0.3) of the dust grains are located in the diffuse ISM and heated by a radiation field contributed by many stars with
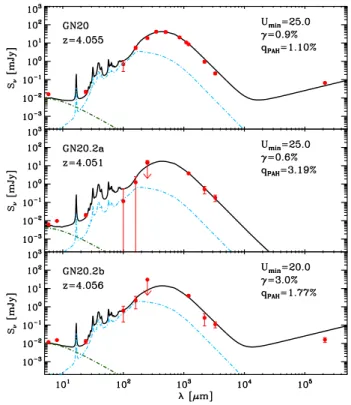
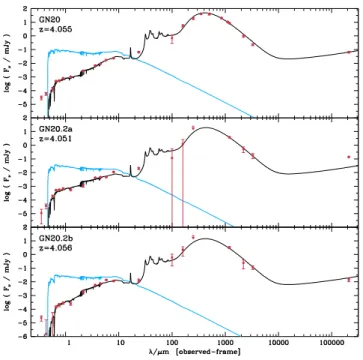
Fig. 3. Observed mid-IR to millimeter SED of GN20, GN20.2a, and
GN20.2b, overlaid with the best-fit Draine & Li (2007) models. The black line is the DL07 model consisting of one stellar component and two dust components: diffuse ISM and photodissociation region. Green dot-dashed and cyan dot-dashed lines show stellar component and “PDR” component, respectively. The best-fit parameters from DL07 models are listed within each panel. The arrows represent 5σ upper limits.
a minimum intensity Umin(U is a dimensionless factor normal-ized to the local ISM), and the rest dust grains are exposed to a power-law radiation field ranging from Uminto Umax, associated with photodissociation regions (PDRs). Following the prescrip-tions of DL07, we fit the mid-IR to millimeter data points for each galaxy. For GN20, we use the updated 3.3 mm flux den-sity for SED fitting and find a consistent dust mass with the es-timates in Magdis et al. (2011, 2012a). In order to more accu-rately derive far-IR properties, we also add 1.4 GHz measure-ments (Table 2; Owen et al. 2014, in preparation) to the SED fitting, with the exception of GN20.2a, due to the presence of an AGN (Daddi et al. 2009b). The 1.4 GHz flux density of GN20.2b measured from our new deep radio map is revised to a factor of 2 lower than the value reported previously (Daddi et al. 2009b; Morrison et al. 2010). The best-fit models along with the ob-served SEDs for GN20, GN20.2a, and GN20.2b are shown in Fig. 3, and the derived parameters are summarized in Table 2.
The radiation field intensities hUi derived from the best-fit models are 27.2+2.6 −2.2, 26.4 +8.1 −14.1, and 25.8 +6.3 −12.5for GN20, GN20.2a and GN20.2b, respectively. These can be represented as dust temperatures if assuming that the dust is heated only by radi-ation. Integrating over the best-fitting template from 8 to 1000
µm, we derive LIR= (1.86±0.09)×1013L⊙, (8.0±0.7)×1012L⊙, and (6.9 ± 1.0) × 1012 L
⊙ for GN20, GN20.2a, and GN20.2b, respectively. We find that the uncertainties of IR luminosity estimates are significantly reduced by adding 1.4 GHz mea-surements. To convert the observed IR luminosities into SFRs, we adopt a Kennicutt (1998) conversion of SFR[M⊙ yr−1] =
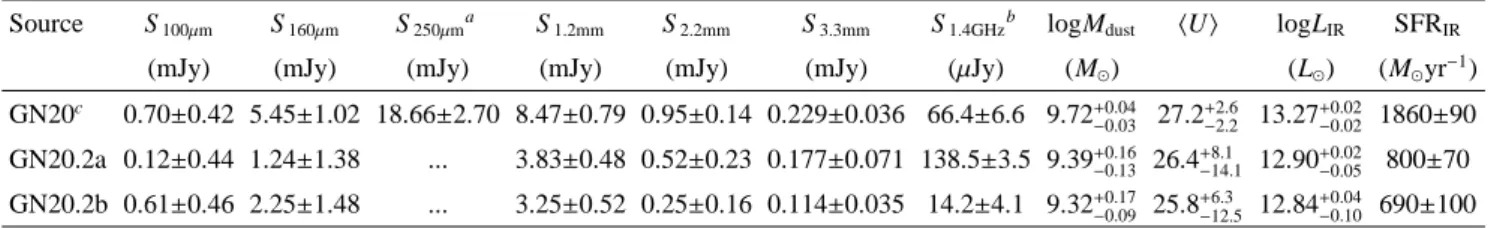
Table 2. Far-IR and (sub)mm properties of GN20, GN20.2a and GN20.2b
Source S100µm S160µm S250µma S1.2mm S2.2mm S3.3mm S1.4GHzb logMdust hUi logLIR SFRIR
(mJy) (mJy) (mJy) (mJy) (mJy) (mJy) (µJy) (M⊙) (L⊙) (M⊙yr−1)
GN20c 0.70±0.42 5.45±1.02 18.66±2.70 8.47±0.79 0.95±0.14 0.229±0.036 66.4±6.6 9.72+0.04 −0.03 27.2 +2.6 −2.2 13.27 +0.02 −0.02 1860±90 GN20.2a 0.12±0.44 1.24±1.38 ... 3.83±0.48 0.52±0.23 0.177±0.071 138.5±3.5 9.39+0.16 −0.13 26.4 +8.1 −14.1 12.90 +0.02 −0.05 800±70 GN20.2b 0.61±0.46 2.25±1.48 ... 3.25±0.52 0.25±0.16 0.114±0.035 14.2±4.1 9.32+0.17 −0.09 25.8 +6.3 −12.5 12.84 +0.04 −0.10 690±100
Notes.(a)The SPIRE 250µm detections for GN20.2a and GN20.2b are blended, due to the small separation (∼6.8′′) between these two galaxies.
(b)JVLA 1.4GHz flux density from new deep radio measurements (Owen et al., in prep.). For GN20.2b, we list flux density derived from a circular
Gaussian fit with fixed FWHM of 0.88′′. The peak flux density measurement is 12.5±3.5 µJy. (c)GN20 also has secure detections in SPIRE 350
and 500 µm bands (Magdis et al. 2011) and in the SCUBA 850 µm band (Pope et al. 2006; Daddi et al. 2009b).
derived in this way is used for analysis in the remainder of the paper.
3.2.3. The Radio-IR correlation
The IR-radio correlation is usually quantified by the so-called
q-parameter (Helou et al. 1985):
q = log( LIR
3.75 × 10¹²W) − log(
L1.4GHz
W Hz−1). (2)
where L1.4GHzis the k-corrected radio luminosity assuming Sν∝
να with α = −0.8. Using the 1.4 GHz flux density measure-ments (Table 2; Owen et al., in prep.) and the IR luminosities derived above, we find values of q=2.41±0.07, 1.72±0.05, and 2.60±0.19 for GN20, GN20.2a, and GN20.2b, respectively. The
q values of GN20 and GN20.2b are compatible with the local
relation (q=2.64±0.02, scatter: 0.26; Bell 2003) and galaxies at z ∼1–2 (Sargent et al. 2010), suggesting that dust heating in these two galaxies originates predominantly from star formation. The mid-IR observations of GN20 reveal a significant power-law component, likely related to the presence of an obscured AGN (Riechers et al. 2014b). However, the infrared SED fits to GN20 after correcting for the AGN fraction show that the AGN con-tribution to the total IR luminosity is only .15% (Riechers et al. 2014b). In contrast, GN20.2a falls below the range defined for star-forming galaxies (Yun et al. 2001; Bell 2003), the relatively low q value is suggestive of AGN activity boosting radio flux. In addition, we found that the q value of GN20.2a is similar to that of the Cloverleaf quasar at z=2.55, which hosts a known radio-loud AGN (Beelen et al. 2006; Kayser et al. 1990).
3.3. Multiwavelength counterparts
Figure 4 shows the CO(6-5) contours of GN20, GN20.2a, and GN20.2b with resolution of 0.9′′/6.1 kpc overlaid on the HST+ACS 850z-band, the HST+WFC3 F160W-band, the CHFT+WIRCam K-band, and the Spitzer+IRAC 3.6 µm im-ages. The WFC3 images are publicly available from the CAN-DELS survey (Grogin et al. 2011; Koekemoer et al. 2011). For GN20.2b, the multi-wavelength counterparts are found to be co-incident with the CO source. We note that a nearby companion galaxy lies ∼ 2′′ to the west of GN20.2b, which is also likely to be a B-band dropout based on the ACS images shown in Daddi et al. (2009b). For GN20.2a, we find a significant offset between CO position and optical counterpart, which has already been presented in Hodge et al. (2013) with higher resolution of CO(2-1) map. This is similar to the large offset found between CO and optical counterpart for GN20 (Carilli et al. 2010), re-vealing a substantial dust obscuration over a scale ∼ 10 kpc. The
spectroscopic redshift (z = 4.059 ± 0.007; Daddi et al. 2009) de-rived for the optical counterpart is found to be very close to the CO redshift of GN20.2a, makes it likely that the HST galaxy to the northeast of the radio position is related to the CO emission (see Fig. 4).
3.4. Stellar mass and UV-based SFR estimates
The photometric information we use to measure the physical properties of our galaxy sample is drawn from the GOODS-N multi-wavelength catalog presented in Pannella et al. (2014). For the sake of clarity we give here only a brief summary of the cata-log properties while referring the reader to Pannella et al. (2014) for a more detailed description. The extended GOODS-N cat-alog is a Ks-band selected multi-wavelength catcat-alog spanning 20 passbands from GALEX NUV to IRAC 8 µm. PSF-matching corrections have been applied to account for the different angular resolution of the images. Aperture magnitudes (2′′diameter) are used to sample the galaxy SED. Finally, all derived properties were extrapolated to “total” masses using the ratio between the total (FLUX_AUTO) and aperture flux in the K-band detection image. The catalog contains 53675 objects over the WIRCAM Ks image field of 900 arcmin2and down to an AB magnitude of 24.5, the 5σ limiting magnitude of the image. The U BVRIzJHK photometry, plus the photometry in IRAC bands are shown for GN20, GN20.2a, and GN20.2b in Fig. 5.
The stellar masses were estimated by fitting the multi-wavelength photometry of U- to IRAC 4.5 µm band to Bruzual & Charlot (2003) templates using FAST (Fitting and Assessment of Synthetic Templates; Kriek et al. 2009) through a χ2 minimization. We fix the spectroscopic redshift as given by the CO line identification. The IRAC 3.6 µm measurements were not used in the SED fitting, to avoid the possible flux con-tamination from Hα emission, which happened to fall into this band. Given that all our galaxies are actively star forming, we adopt the templates with a constant star formation history (SFH), a large range of ages, a Chabrier (2003) IMF, and allowing the metallicity to vary within a range of Z=0.2-2.5 solar. We used an extinction correction from Calzetti et al. (2000) with an opti-cal extinction AV= 0−6 mag. The typical uncertainty of stellar mass estimate is 0.2 dex. For comparison, we also assume an ex-ponentially declining SFH for the modeling and find the stellar masses are on average increased by 0.05 dex for each galaxy, while the UV-based SFRs are lowered by ∼ 0.5 dex. Therefore, the uncertainties of stellar mass estimates resulted from different assumptions of single-component SFH are relatively small for our sources. We also find that the stellar masses derived from the best-fitting model allowing a varied metallicity are not signifi-cantly different from the one assuming a solar metallicity. We
Fig. 4. PdBI CO(6-5)+continuum contours (Carilli et al. 2010) at resolution of 0.90′′×0.76′′for GN20 (inset), GN20.2a and GN20.2b overlaid
on the ACS 850z-band (top left), WFC3 F160W-band (top right), WIRCam Ks-band (bottom left), and IRAC 3.6µm (bottom right) images. GN20 lies about 24′′to the northeast of GN20.2a. Black and red crosses show the positions of the 1.4 GHz counterparts (Owen et al., in prep.) and optical
counterparts of GN20, GN20.2a and GN20.2b, respectively. Contour levels are shown in steps of 1σ for GN20.2a and GN20.2b and 3σ for GN20 starting at ±3σ. The beam sizes of CO(6-5) are displayed in the left corner of each map.
Fig. 5. Observed optical to mid-IR SED of GN20 (left), GN20.2a (middle), and GN20.2b (right). Red circles with error bars represent the
multi-wavelength photometry. The solid lines show the best-fitting templates from the libraries of Bruzual & Charlot (2003) at the derived CO redshift for each galaxy, assuming a constant SFH models with solar metallicity and using an extinction correction from Calzetti et al. (2000). We adopt the templates with a constant SFH to derive stellar mass by fitting the photometry of U- to IRAC 4.5µm band.
adopt the modeling results derived by assuming a constant SFH for analysis in the remainder of the paper.
For GN20.2b, the stellar masses derived from the SED fit-ting up to K-band and to IRAC 4.5 µm band are differing by 0.2 dex. Given that the IRAC photometry for GN20.2b is likely to be blended with the companion source (see Fig. 4), we adopt the av-erage of these two estimates, M⋆ = 1.1 × 10¹¹M⊙, and an uncer-tainty of about 0.2 dex. Looking at the IRAC image of GN20.2a, we find that the IRAC peak is coincident with the northeast op-tical counterpart and close to the CO peak, and thus we take into account the IRAC 4.5 µm photometry in the SED fitting for the stellar mass derivation, yielding M⋆= 3.8 × 10¹⁰ M⊙. We stress that the stellar mass estimate of GN20.2a should be treated with
caution, due to the possible contamination in the IRAC band emission from its nearby companion galaxy (see Fig. 4), and the possibility that the optical “counterpart” is a distinct unrelated galaxy from the CO-emitting dusty starburst galaxy. It is not easy to disentangle this issue given the current available data.
We estimated the UV-based SFR with the same SED fitting approach used to derive stellar masses. However, also to avoid possible uncertainties linked to blending in the IRAC bands, we only consider the photometry of U- to K-bands for the mea-sure of UV-based SFR, as the observed K band corresponds to the rest-frame 4000 Å Balmer break. Comparing the SFR es-timated from dust-corrected UV luminosity with the one
con-Fig. 6. Global UV to FIR fits to our galaxies based on MAGPHYS.
The black line is the best-fit SED and the blue line is the corresponding unattenuated stellar emission.
verted from IR luminosity, we find that the IR-based SFR es-timates are generally larger than the UV-based ones for these three SMGs. The ratios of SFRIR/SFRUVwe derived are 13, 26, and 6 for GN20, GN20.2a, and GN20.2b, respectively. As dis-cussed above, the UV-based SFRs would be lowered by a factor of ∼3 if assuming an exponentially declining SFH, thus result in even higher SFRIR/SFRUV ratios. The extremely large value of SFRIR/SFRUV measured in GN20.2a is indicative of heavily obscured UV/optical emission at the positions of CO/radio emis-sion, in agreement with the large offset observed between opti-cal and CO peaks shown in Fig. 4. As discussed in Daddi et al. (2009b), both the complex morphology and large ratio of IR/UV-derived SFRs may suggest that GN20.2a is undergoing a ma-jor merger with a B-band dropout companion (∼ 0.7′′ west to GN20.2a; see Fig. 4).
3.5. Physical parameters from global UV to FIR SED fitting
In order to verify the stability of our results and test against pos-sible systematic effects affecting our modelling, we obtained si-multaneous estimates of the stellar masses, SFRs, IR luminosi-ties and dust masses using MAGPHYS (da Cunha et al. 2008). We use an updated version of MAGPHYS where the parame-ter priors are appropriate for high-redshift galaxies (da Cunha et al. 2014, in prep). This code includes a wide range of possible SFHs and dust properties, and fits the full SED consistently from the UV to the far-IR by requiring an energy balance between the UV/optical and far-IR output (Fig. 6).
We find in general excellent agreement with the results ob-tained from separate UV/optical and IR fitting described in pre-vious sections. In all cases the SFRs are very close to what in-ferred from the IR luminosities applying a standard Kennicutt (1998) conversion. After correcting for the different κ values (κ is the dust absorption coefficient) adopted in MAGPHYS and in the DL07 model, the differences of dust mass estimates for these
three sources are within 25–30%. For the stellar mass, except GN20.2b, the differences are also only 20%.
For GN20.2b, MAGPHYS provide two degenerate solutions for the stellar mass. One is consistent with our previous deriva-tion (about 1011M
⊙) and a second one with much smaller values up to factors of 3–5.
3.6. The CO-to-H2conversion factor
Recently, a few attempts at the direct measurements of the CO luminosity to H2 gas mass conversion factor for high red-shift galaxies have been mainly based on dynamical ing, gas-to-dust measurements, and radiative transfer model-ing (e.g., Bolatto et al. 2013; Carilli & Walter 2013, and refer-ences therein). A pilot study performed by Magdis et al. (2011) showed that the gas-to-dust ratio method applied to GN20 leads to a conversion factor of αCO<1.0, consistent with the dynam-ical estimate measured by Carilli et al. (2010). Having derived the dust, stellar, and dynamical masses, we use two independent methods of dynamical modeling and gas-to-dust mass ratio to es-timate αCO. To avoid the uncertainties resulting from the extrapo-lation from high-order CO transitions, we adopt the low-J (J=1, 2) CO luminosities measured by Carilli et al. (2010, 2011). The CO luminosities are summarized in Table 3.
3.6.1. The dynamical mass method
Assuming that our SMGs are a mix of disc-like and virialized systems, we estimate the dynamical mass by taking the average of two different estimators: the isotropic virial estimator (e.g., Spitzer 1987; Pettini et al. 2001)
Mdyn(r < r1/2) = 5σ2r
1/2
G (3)
where r1/2is the half-light radius, σ= ∆υFWHM/2.35 is the one-dimensional velocity dispersion (∆υFWHMis the line width), and
G is the gravitational constant, and the rotating disk estimator
(Neri et al. 2003), corrected for < sin2i >= 2/3 in mass: Mdyn(r < r1/2) = 6 × 10⁴∆υ2FWHMr1/2 (4) This method has been widely applied to the dynamical mass estimate for SMGs (e.g., Tacconi et al. 2008; Bothwell et al. 2013; Hodge et al. 2013). Unlike the dynamical mass traced by HI emission line in local universe, the CO-based dynami-cal mass represents more compact star formation region (e.g., Solomon & Vanden Bout 2005; de Blok & Walter 2014). Adopt-ing the FWHM of CO(4-3) line derived from our best-fittAdopt-ing double Gaussian models and the CO size measured from re-solved CO(2-1) maps (Carilli et al. 2010; Hodge et al. 2013), the implied dynamical mass of GN20 within r1/2 ∼4 kpc is (1.8 ± 0.2) × 1011 M⊙, of GN20.2a within r1/2 ∼ 2.5 kpc is (1.9 ± 0.9) × 1011 M
⊙, and of GN20.2b within r1/2 ∼4 kpc is (2.6 ± 1.0) × 1010 M
⊙. The uncertainties were estimated based on the uncertainties on the FWHM measures. The dy-namical mass estimates for GN20 and GN20.2a are consistent within uncertainties with the estimates by Carilli et al. (2010) and Hodge et al. (2012, 2013). For GN20.2b, our dynamical mass estimate is better constrained than the one measured by Hodge et al. (2013), as the uncertainty in its fitted line width is significantly reduced.
To estimate the gas mass from the dynamical modeling, we follow the method in Daddi et al. (2010)
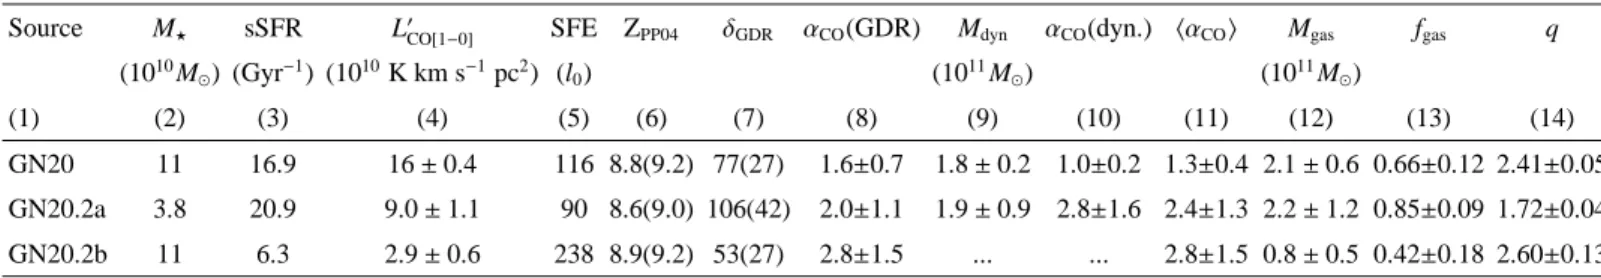
Table 3. Physical properties of GN20, GN20.2a and GN20.2b
Source M⋆ sSFR L′CO[1−0] SFE ZPP04 δGDR αCO(GDR) Mdyn αCO(dyn.) hαCOi Mgas fgas q
(1010M ⊙) (Gyr−1) (1010K km s−1pc2) (l0) (1011M⊙) (1011M⊙) (1) (2) (3) (4) (5) (6) (7) (8) (9) (10) (11) (12) (13) (14) GN20 11 16.9 16 ± 0.4 116 8.8(9.2) 77(27) 1.6±0.7 1.8 ± 0.2 1.0±0.2 1.3±0.4 2.1 ± 0.6 0.66±0.12 2.41±0.05 GN20.2a 3.8 20.9 9.0 ± 1.1 90 8.6(9.0) 106(42) 2.0±1.1 1.9 ± 0.9 2.8±1.6 2.4±1.3 2.2 ± 1.2 0.85±0.09 1.72±0.04 GN20.2b 11 6.3 2.9 ± 0.6 238 8.9(9.2) 53(27) 2.8±1.5 ... ... 2.8±1.5 0.8 ± 0.5 0.42±0.18 2.60±0.13
Notes. Column 1: Name of the object. Column 2: Stellar mass determined from synthetic template fitting of the U- to IRAC 4.5µm-band photometry
(without 3.6 µm-band), assuming a constant SFH and a Chabrier (2003) IMF. The typical uncertainties are 0.2 dex. For GN20.2b, the stellar mass is estimated by taking an average of the results from SED fitting with and without 4.5 µm-band. Column 3: Specific star formation rate. sSFR = SFR/M⋆, with SFR derived from the bolometric IR luminosity. Column 4: For GN20, the CO(1-0) luminosity is measured by Carilli et al.
(2010). For GN20.2a and GN20.2b, we convert the CO(2-1) luminosity measured by Carilli et al. (2011) to CO(1-0) luminosities by assuming
r21=0.84 (Bothwell et al. 2013). Column 5: SFE = LIR/L′COin units of l0=L⊙(K km s−1pc2)−1. Column 6: Metallicity estimated based on the
FMR (values outside the parenthesis) and mass-metallicity (values in the parenthesis) relation applied to the present-day elliptical galaxies. We have corrected for the metallicity scale from KD02 to PP04 for the FMR by adopting the prescriptions in Kewley & Ellison (2008). Column 7: Gas-to-dust ratio derived from the relation of Magdis et al. (2012a) which relates the δGDRto metallicity. The values in the parenthesis are inferred
assuming a metallicity estimated from the mass-metallicity relation of present-day elliptical galaxies, while the values outside the parenthesis are from the FMR relation. Column 8: CO-to-H2 conversion factor in units of M⊙(K km s−1pc2)−1, inferred from αCO = Mgas/L′CO[1−0], with Mgas
= Mdust×δGDR. Column 9: dynamical masses within the half-light radius. For GN20.2b, we do not derive an estimate of dynamical mass, as
the dynamical mass estimated in this way is found to be smaller than stellar mass. Column 10: CO-to-H2 conversion factor estimated based on
the dynamical method. Column 11: The average of CO-to-H2conversion factor derived from gas-to-dust ratio method and dynamical modeling.
Column 12: Molecular gas mass measured from L′
CO[1−0]and hαCOi. Column 13: Molecular gas fraction: fgas= Mgas/(Mgas+ M⋆).The uncertainties
are mainly dominated by the uncertainties in molecular gas estimates. Column 14: IR-radio correlation parameter.
where the dynamical mass within the half-light radius is com-posed of the half of the total amount of stellar mass and gas mass, and the amount of dark matter within r1/2. Subtract-ing the stellar mass, includSubtract-ing a 25% dark matter contribution, which is a typical value adopted for z ∼ 1 − 2 normal galaxies (Daddi et al. 2010) and z ∼ 2 SMGs (Tacconi et al. 2008), we find αCO= 1.0 ± 0.2 and 2.8 ± 1.6 for GN20 and GN20.2a, re-spectively. The derived αCOfor GN20 is consistent with previous estimates (Carilli et al. 2010; Hodge et al. 2012). For GN20.2b, the dynamical mass is found to be much smaller than our pre-ferred estimate of the stellar mass, suggesting that our method may possibly significantly underestimate the dynamical mass. If we adopt the rotating disk estimator and make an assumption for the extreme case that GN20.2b is composed of stellar mass and dark matter only, the maximum inclination angle derived for this galaxy would be about 20◦, close to face-on. This is con-sistent with the narrow CO line width that we observed. On the other hand, the alternative lower stellar mass value suggested by MAGPHYS for this object is compatible with the inferred dy-namical mass. Nevertheless, given all the uncertainties, no infer-ence on dynamical mass and αCOfor GN20.2b can be directly obtained in this way.
3.6.2. The gas-to-dust ratio method
Some recent studies have revealed a tight correlation between the gas-to-dust ratio (δGDR) and the gas-phase oxygen abun-dance, with δGDRdecreasing for more metal-rich galaxies (e.g., Leroy et al. 2011; Magdis et al. 2011). Under the assumption that the local observed δGDR−Z relation is valid at high red-shift, Magdis et al. (2012a) derived indirect estimates of αCO for a sample of star-forming galaxies at z ∼ 2 and found that the variation tendency of αCO is in line with previous studies (Leroy et al. 2011). Following the prescription in Magdis et al. (2012a), we attempt to apply this approach to the three galaxies in our sample to estimate αCO.
Having obtained the dust masses for our sources, we need the measurements of their metallicities, for which we have to rely on indirect indicators. The fundamental metallicity relation (FMR) of Mannucci et al. (2010) that relates the metallicity to both SFR and M⋆ is one of the methods that is commonly used for mea-suring metallicity. However, the FMR relation is valid only up to z ∼ 2.5, and thus we also apply the mass-metallicity rela-tion of present-day elliptical galaxies (e.g., Calura et al. 2009), assuming that the high redshift strongly star-forming galaxies are the progenitors of the local ellipticals, given that the large SFR (∼ 690 − 1860 M⊙yr−1) of our sources could be due to a final burst of star formation triggered by a major merger, and the galaxy will eventually evolve into a massive elliptical with unchanged mass and metallicity once there are no further star formation activities. The metallicity estimates based on this sce-nario and the FMR relation lead to 12+log[O/H] = 8.8-9.2 for GN20 (agree with the values in Magdis et al. 2011), 8.6-9.0 for GN20.2a, and 8.9-9.2 for GN20.2b.
With the derived metallicity, we estimate the δGDRfollowing the relation of Magdis et al. (2012a) which relates the δGDR to metallicity, i.e.,
logδGDR= (10.54 ± 1.0) − (0.99 ± 0.12) × (12 + 1og[O/H]) (6) The fit to this relation indicates a value for δGDRof ∼ 77(27) for GN20, ∼ 106(42) for GN20.2a, and ∼ 53(27) for GN20.2b, as-suming a metallicity estimated based on the FMR relation (mass-metallicity relation of present-day elliptical galaxies). With the gas-to-dust ratios, we can determine the Mgasand estimate αCO from the equation αCO= L′CO/Mgas. Here we have assumed that at high redshift MH2 ≫ MHI and therefore that Mgas ⋍ MH2. This assumption is based on the observed high surface densi-ties, above the characteristic threshold for HI saturation and thus most of the gas is in molecular form (e.g., Bigiel et al. 2008; Obreschkow & Rawlings 2009). The αCOderived based on gas-to-dust method are 1.6 ± 0.7, 2.0 ± 1.1, and 2.8 ± 1.5 for GN20, GN20.2a, and GN20.2b, respectively. We note that our αCO esti-mate for GN20 is larger than previously found by Magdis et al.
(2011) with the same method, which is due to the revised esti-mates of dust and stellar mass used in our study. We caution that these αCOestimates are systematically uncertain due to the large uncertainties of metallicity estimates.
3.6.3. Comparison of the CO-to-H2conversion factor
Comparing the αCO estimates summarized in Table 3, we find that the αCOdetermined based on the metallicity-dependent gas-to-dust ratio method are consistent within uncertainties with those measured from the dynamical modeling for each galaxy. The average αCOare 1.3 ± 0.4, 2.4 ± 1.3, and 2.8 ± 1.5 for GN20, GN20.2a, and GN20.2b, respectively, which are found to be be-tween the typical value (∼0.8) determined for ULIRGs and the value (∼4) appropriate for the Milky Way. However, these values might be well below the value appropriate for normal galaxies at those epochs, as the αCOof z > 4 normal galaxies could be much higher than the Milky Way value (e.g., Genzel et al. 2012; Bolatto et al. 2013; Carilli & Walter 2013; Tan et al. 2013). We caution that the uncertainty of αCOestimates derived from each method is significant. For the dynamical analysis, the main un-certainties are the crude estimates of dynamical mass based on marginally resolved imaging data and the stellar mass based on SED fitting, which is caused by the extreme dust obscuration and the potentially complex SFHs, while for the gas-to-dust method, the large uncertainties might result from the dust model assumed and the uncertainty on metallicity estimate. The consistency of
αCOestimates derived from two independent approaches further confirm the reliability of the gas-to-dust ratio method.
3.7. The specific star formation rates and star formation efficiency
With the stellar masses and star formation rates derived above, we estimate sSFR of 16.9 Gyr−1, 20.9 Gyr−1, and 6.3 Gyr−1for GN20, GN20.2a, and GN20.2b, respectively. Both GN20 and GN20.2a exhibit larger sSFRs with a factor of ∼ 6 than the aver-age of equally massive galaxies on the SFR-M⋆main-sequence at z ∼ 4 (Sargent et al. 2013), while GN20.2b shows a sSFR-excess of 2.4 (which could be larger though, in case of the lower-mass MAGPHYS solution is adopted instead). The large sSFR-excess for GN20 and GN20.2a, similar to the z ∼ 2 − 3 SMGs, have been revealed in Daddi et al. (2009b), suggesting that these galaxies are undergoing starburst events with short duty cycles, likely triggered by mergers.
The ratio between LIR and L′CO(i.e., SFE, in units of L⊙(K km s−1 pc2)−1) can be used as a measure of the efficiency with which molecular gas is converted into stars. Given that the to-tal available reservoir of gas within a galaxy could be better traced by low-J CO emission, we use directly observed CO(1-0) luminosity or the one extrapolated from CO(2-1) observa-tions for SFE derivation to avoid the uncertainties in the under-lying gas excitation. We find ratios of ∼90–238 for these three galaxies, comparable to those derived for other high-redshift SMGs (Ivison et al. 2011; Bothwell et al. 2013), and higher than in normal star-forming galaxies (∼84±12; Daddi et al. 2010), but slightly lower than in local ULIRGs (∼250±30; Solomon et al. 1997).
3.8. Gas fractions, depletion timescales, and the evolutionary status
Table 3 lists the molecular gas masses for our three galax-ies, derived based on the average αCO inferred in Section 3.6 and the measured L′
CO. Combining the gas mass with the stel-lar mass estimates, we find molecustel-lar gas fraction of fgas =
Mgas/(Mgas+ M⋆) = 0.66±0.12, 0.85±0.09, and 0.42±0.18 for GN20, GN20.2a, and GN20.2b, respectively. These values are comparable to other SMGs at z = 2−4 (Bothwell et al. 2013) and high-z massive, gas-rich star-forming galaxies (e.g., Daddi et al. 2010; Tacconi et al. 2010). Bothwell et al. (2013) compared the gas fraction of SMGs to that of local LIRGs and found an in-crease of gas fraction up to z ∼ 2 followed by a flattening to-ward higher redshift. This is similar to the redshift evolution trend of gas fraction revealed in normal star-forming galax-ies (Magdis et al. 2012b; Tan et al. 2013), despite that SMGs have typically an order of magnitude higher SFRs than nor-mal galaxies. The 2 star formation mode (2-SFM) predictions by Sargent et al. (2013) have also revealed that the average gas fraction of starbursts is only slightly lower than that of main se-quence galaxies.
Dividing the stellar masses by the SFRs, we estimate the stellar mass building-up timescale of τbuild ∼59 Myr, 48 Myr, and 159 Myr for GN20, GN20.2a, and GN20.2b, respectively, if assuming that these galaxies have sustained their current SFRs continuously. Similarly, assuming that the SFRs contin-ues at the current rate and neglecting the effect of feedback, the minimum time for exhausting the molecular gas reservoir can be given by the gas depletion timescale, τgas = M(H2)/SFR, which we find to be ∼113 Myr, ∼ 275 Myr, and ∼116 Myr for GN20, GN20.2a, and GN20.2b, respectively. These timescales are relatively short than in massive, normal galaxies (∼0.4–0.9 Gyr; e.g., Daddi et al. 2010; Tacconi et al. 2010), indicating a rapid star formation mode with intense burst for SMGs, prob-ably undergoing major mergers or rapid cold accretion (e.g., Narayanan et al. 2010; Davé et al. 2010). In addition, the ex-tremely high gas surface density revealed in GN20.2a may in-dicate a triggering mechanism of major merger, while the sur-face density of GN20.2b is found to be comparable to normal star-forming galaxies (Hodge et al. 2013). If we define starburst phase to be the fraction of stars have already been formed over the available gas reservoir, simply calculated as M⋆/(Mgas+ M⋆), taking these numbers at face value we would find that the rel-atively young stellar age and long gas-consumption timescale of GN20.2a place it at an early stage, ∼15%±9% of the way through its starburst, while GN20 and GN20.2b have experi-enced ∼35%±14% and ∼60%±35% of their starburst phase, re-spectively. The CO excitation analysis has also revealed different merging states for these three galaxies, of which GN20.2b dis-play lowest excitation (Carilli et al. 2010; Hodge et al. 2013).
4. What is the nature of GN20, GN20.2a and GN20.2b?
We have presented multiwavelength properties of GN20, GN20.2a and GN20.2b, including UV/optical, far-IR, and mm photometry and molecular gas content. Table 4 lists the ra-tios of sSFR/sSFRMS and SFRIR/SFRUVfor these three SMGs. The large sSFR-excess observed for GN20 and GN20.2a sug-gest that these two galaxies are starbursting outliers above the main sequence (Rodighiero et al. 2011; Sargent et al. 2013). Although GN20.2b might situate within the MS scatter with sSFR/sSFRMS ∼2.4, the large value of SFRIR/SFRUVindicates
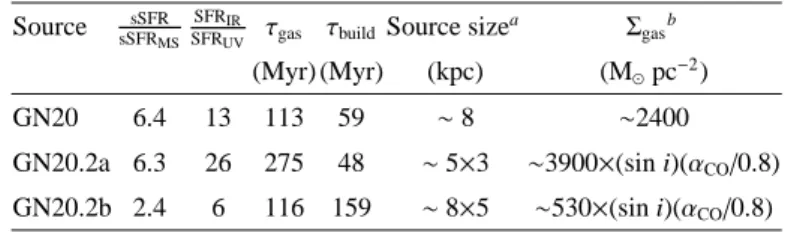
Table 4. Derived properties of GN20, GN20.2a, and GN20.2b
Source sSFRsSFR
MS SFRIR
SFRUV τgas τbuild Source size
a Σ
gasb
(Myr) (Myr) (kpc) (M⊙pc−2)
GN20 6.4 13 113 59 ∼8 ∼2400 GN20.2a 6.3 26 275 48 ∼5×3 ∼3900×(sin i)(αCO/0.8)
GN20.2b 2.4 6 116 159 ∼8×5 ∼530×(sin i)(αCO/0.8)
Notes. (a) Deconvolved CO(2-1) size (Gaussian FWHM). From
Carilli et al. (2010) and Hodge et al. (2013). (b) Average gas surface
density. From Carilli et al. (2010) and Hodge et al. (2013).
that a large fraction of UV emission from this galaxy is ob-scured, pointing also toward a population of starburst galaxy (Daddi et al. 2007b, 2010). For GN20 and GN20.2a, the large offsets between the CO positions and the optical counterparts show clear evidence of extreme obscuration, consistent with the heavy dust extinction observed in the UV emission. In addition, the high gas surface densities derived for GN20 and GN20.2a suggest that the star formation is dominated by the compact star-forming sites (Table 4; Carilli et al. 2010; Hodge et al. 2012, 2013). As discussed in Sect. 3.8, the gas-consumption time-scales (see Table 4) of these three SMGs are found to be sig-nificantly shorter than those of normal galaxies, indicative of a more rapid star formation mode. The extreme SFRs (&700 M⊙ yr−1) and high radiation field intensity (hUi >25) observed for our SMGs would also favor the scenario of intense starbursts, as suggested by Magdis et al. (2011) (see also Magnelli et al. 2012a). In addition, our three SMGs appear to be dynamically distinct from the normal disk galaxies, since these galaxies are clearly separated from disk galaxies in the velocity-size plane, which can be used as a tool to constrain the angular momentum properties of galaxies (Courteau 1997; Bouché et al. 2007). The low orbital angular momentum observed in our SMGs might be caused by a recent or ongoing merger.
Two main modes are typically considered for trigger-ing star formation in high redshift SMGs: major mergers (Narayanan et al. 2010) and secular mode with smooth mass infall from the intergalactic medium and along the cosmic web (Dekel et al. 2009; Davé et al. 2010). However, it is still a matter of debate to identify which mode of star forma-tion is responsible for the majority of the SMG populaforma-tion. High-resolution CO imaging of local ULIRGs and z ∼ 2 SMGs have revealed large reservoirs of molecular gas con-centrated in the galaxy nuclei with disturbed CO kinemat-ics/morphologies, suggesting a merger-driven mechanism for the star formation activity (Downes & Solomon 1998; Tacconi et al. 2008; Engel et al. 2010). However, the resolved CO imaging of GN20 shows ordered rotation and an extended gas distri-bution (Carilli et al. 2010; Hodge et al. 2012), which could be suggestive of a rotating disk. On the other hand, hydrody-namical simulations of gas-rich mergers have shown that the merger remnant gas can cool quickly and produce an extended star-forming disk (Springel & Hernquist 2005; Robertson et al. 2006; Robertson & Bullock 2008).
GN20.2a has a smaller CO size than GN20 and GN20.2b, but exhibits a much larger line width, implying a much deeper gravi-tational potential well, as CO line emission traces the kinematics of the potential well where the molecular gas lies. Comparing the L′
CObetween the one observed directly and the one predicted from the L′
CO-FWHM relation discovered in Bothwell et al.
(2013), we find the observed L′COis in good agreement with the prediction for all our three SMGs, indicating that the dynam-ics within the gas emission region is dominated by the baryons. Given that the stellar mass of GN20.2a is the smallest one among these three galaxies, we infer that a large reservoir of molecular gas dominates the dynamics of the region probed by our obser-vations. This is consistent with the heavily dust-obscured UV emission observed in this galaxy. Similar to GN20, the physical properties of GN20.2a would point toward a major merger driven stage, likely approaching the final coalescence with substantial radio emission powered by an AGN, given the high gas surface density and extreme bright radio emission (Daddi et al. 2009b; Hodge et al. 2013). However, the complex optical morphology makes it difficult to understand the detailed physical process of star formation in this galaxy.
Comparing the physical properties of GN20.2b with those of GN20 and GN20.2a, we find that GN20.2b exhibits compara-ble gas surface density and perhaps even distance with respect to the MS of the SFR-M⋆ plane with that observed in normal star-forming galaxy at z ∼ 2. However, the optically thick UV emission and the high SFE observed in GN20.2b agree better with the case of a starburst. In combination with the analysis in Sect. 3.8, the relatively old stellar age and short gas-consumption timescale of GN20.2b are likely to suggest that this galaxy has already passed its peak of star formation activity, probably ob-served at the decaying stage of a major merger. In addition, we note that the line width (∼ 220 ± 43 km s−1) of GN20.2b is much narrower (by a factor of ∼2.5–3.5) than those of GN20 and GN20.2a. Given the extreme obscuration of UV/optical emission in GN20.2a and GN20.2b, higher resolution and sensitivity CO imaging would be highly beneficial for the exploration of gas morphology and kinematics in these systems.
Despite the large uncertainties associated with the above analysis, our sample of three SMGs appears to be in different evolutionary stages: GN20 - a major merger undergoing final coalescence; GN20.2a - a major merger approaching final co-alescence; and, GN20.2b - at the decaying stage of a merger-driven starburst. We consider that it could be reasonable to find starbursts at different stages in the same massive proto-cluster structure at z = 4.05, as it would be hard to expect absolute synchronisation to much better than the 100 Myr timescale of a merger-driven starburst.
5. Implications for the cosmic evolution of dust content in galaxies
The aim of this section is to study the interplay between metals, gas, and dust grains, and the effect of metallicity evo-lution on observations of galaxies, by investigating the evoevo-lution of CO-luminosity-to-dust mass ratio and dust-to-stellar mass ra-tio across cosmic time for starbursts as well as for MS galaxies, thus placing the observations of the GN20 proto-cluster SMGs in the general context.
5.1. The evolution ofL′ CO/Mdust
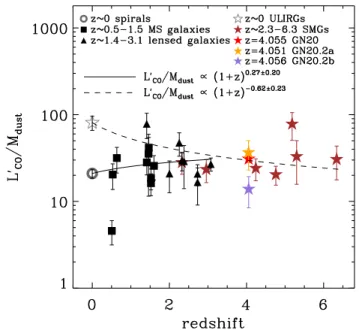
We start by looking at the cosmic evolution of the dust mass to CO luminosity ratios, looking for empirical trends and try-ing to understand possible expectations for the relative evolution of these two quantities versus redshift, the effect of metallicity, and searching for possible different behaviours of MS versus SB galaxies. Figure 7 shows the evolution of L′
red-shift for normal star-forming galaxies and starbursts. For MS galaxies, the sample available for our analysis consists of z ∼ 0 local group galaxies from Leroy et al. (2011) and individually detected MS galaxies at z ∼ 0.5 and z ∼ 1.5 from Magdis et al. (2012a). We also show z ∼ 1.4 − 3.1 lensed star-forming galax-ies from Saintonge et al. (2013), although for lensed galaxgalax-ies in general there is the possibility of a ‘lensing bias’ affecting their selection (high surface brightness in the UV rest frame, and/or high intrinsic IR luminosity), so that it is not clear if they should be considered as typical MS galaxies, often times they could be starbursts (see also Tan et al. 2013). To reduce the possible uncertainty resulting from the assumption of exci-tation correction, for two of the UV-bright lensed sample galax-ies, cB58 and Cosmic Eye, we adopt the CO(1-0) luminosity measured by Riechers et al. (2010b) instead of the one extrapo-lated from CO(3-2) shown in Saintonge et al. (2013). The dust masses of these galaxies are derived based on the DL07 model. For the starburst galaxies, besides our three z = 4.05 SMGs, we add additional objects located at z ∼ 0 − 6.3 from the literature (Downes & Solomon 1998; Coppin et al. 2010; Gilli et al. 2014; Cox et al. 2011; Swinbank et al. 2010; Riechers et al. 2010a, 2011, 2013; Capak et al. 2011; Dwek et al. 2011; Walter et al. 2012). To be consistent with our targets, we also use DL07 mod-els to estimate dust mass for the literature sources, except for ID 141 at z = 4.24, LESS J033229.3-275619 at z = 4.76, and HDF850.1 at z = 5.183, for which we adopt the dust mass esti-mates in the literature after a correction factor of 2, given that the dust mass estimates based on a single-temperature modi-fied blackbody model are on average a factor of ∼2 lower com-pared to those derived using DL07 model (Magdis et al. 2012a; Magnelli et al. 2012b). For the z = 6.3 SMG (Riechers et al. 2013), our DL07 estimate of Mdustis much higher than the pub-lished one, and we adopt a log-averaged value which is within 0.2 dex from both estimates.
The best fit to the MS galaxies yields a nearly flat ratio with redshift of L′
CO/Mdust ∝ (1 + z)0.27±0.20 from z = 0 to 3.1, indicating that L′
CO/Mdust remains roughly constant for normal galaxies. The best fit to the starburst galaxies gives a relation of
L′
CO/Mdust ∝(1 + z)
−0.62±0.23. The GN20, GN20.2a and GN20.2b galaxies agree well with the general SB trend. Local ULIRGs have a mean ratio of L′CO/Mdust higher than normal galaxies by factors of 3–4, but the higher redshift starburst galaxies show consistent L′CO/Mdust with normal galaxies. These result do not change substantially, regardless of whether we include the lensed galaxies in the normal galaxy sample or in the starburst sample.
We now attempt a simple interpretation of these trends, start-ing from the MS galaxies. We recall that both L′CO and Mdust are intimately related to the gas mass, with L′
CO = MH2/αCO and Mdust = Mgas/δGDR, respectively. Therefore, the ratio of
L′
CO/Mdust can be expressed as δGDR/αCO, provided that most of the gas contained in the region where the CO and IR lu-minosity arise is molecular. As discussed in Section 3.6.2, H2 is thought to dominate the gas mass of normal massive
M⋆ > 1010M⊙ galaxies at low and high redshift, based on the large molecular gas fraction observed in high-z MS galaxies (Daddi et al. 2010; Tacconi et al. 2010) and the theoretical ar-guments (e.g., Obreschkow & Rawlings 2009; Bournaud et al. 2011; Lagos et al. 2011). It has been found that the gas-to-dust mass ratio is metallicity dependent with a relation of δGDR ∝
Z−1for normal galaxies (see Leroy et al. 2011; Sandstrom et al. 2013). Meanwhile, studies of CO-to-H2 conversion factor have shown that αCO also scales with metallicity on average as ∝
Z−1 for metallicities not much below 1/3 solar (see review by Bolatto et al. 2013; Genzel et al. 2012; Sargent et al. 2013).
Fig. 7. Redshift evolution of L′
CO/Mdustfor MS galaxies and starbursts.
At z ∼ 0 we use the average value derived from the samples of Leroy et al. (2011) for the spirals (gray circle). Black squares repre-sent individually detected normal star-forming galaxies at z ∼ 0.5 − 1.5 (Daddi et al. 2010; Magdis et al. 2012a), while the black triangles de-note lensed galaxies at z ∼ 1.4 − 3.1 (Saintonge et al. 2013). The best fit to the normal galaxies yields a relation of L′
CO/Mdust∝(1 + z)0.27±0.20
(solid line). In addition to GN20, GN20.2a, and GN20.2b in our sam-ple at z = 4.05, we also plot starbursts (grey and color stars) from the literature as follows: z ∼ 0 ULIRGs (Downes & Solomon 1998); SMM J2135-0102 at z = 2.325 (Swinbank et al. 2010); HSLW-01 at z = 2.957 (Riechers et al. 2011); ID 141 at z = 4.243 (Cox et al. 2011); LESS J033229.4-275619 at z = 4.760 (Coppin et al. 2010; Gilli et al. 2014); HDF 850.1 at z = 5.183 (Walter et al. 2012); AzTEC-3 at z = 5.298 (Capak et al. 2011; Riechers et al. 2010a; Dwek et al. 2011); HFLS3 at
z = 6.34 (Riechers et al. 2013). The best fit to the starburst galaxies
gives a relation of L′
CO/Mdust∝(1 + z)−0.62±0.23(dashed line).
Based on these derivations, the ratio of L′
CO/Mdustshould not re-ally depend strongly on metallicity (hence neither on stellar mass nor on redshift), for massive galaxies.
One might wonder if this expectation would change if the metallicity of massive galaxies in the high redshift Universe was substantially lower. Recent studies of dwarf galaxies have sug-gested that both αCOand δGDRcould rise more rapidly at metal-licities < 10 times smaller than solar (e.g., with αCO∝Z−2.4in Schruba et al. 2012). Studies of gas-to-dust mass ratios of local galaxies over a large metallicity range reveal a broken power-law relation between δGDR and metallicity (Rémy-Ruyer et al. 2014; Fisher et al. 2014), with a steeper slope (∝ Z−3) for dwarf galaxies with metallicities lower than ∼ 8.0. Also in this case, the ratio of L′
CO/Mdustwould remain roughly constant as normal star forming galaxies with higher metallicity, i.e., the ratio of
L′
CO/Mdust changes little with metallicity and thus cosmic time. Of course, the ratio could instead decrease substantially in any regime in which the molecular to total hydrogen fraction was substantially smaller than unity.
Focusing now on the SB galaxies, we already noted that the local ULIRGs show comparatively large L′
CO/Mdust than that of normal galaxies of similar metallicity (see also Fig. 6 of Magdis et al. 2012a). It is interesting to try to interpret this empirical finding. As the ULIRGs are most likely H2 domi-nated, this might be reconnected to either a larger δGDRand/or a lower αCOthan normal galaxies, at fixed metallicities (i.e., stellar