HAL Id: hal-00302105
https://hal.archives-ouvertes.fr/hal-00302105
Submitted on 13 Sep 2006HAL is a multi-disciplinary open access
archive for the deposit and dissemination of sci-entific research documents, whether they are pub-lished or not. The documents may come from teaching and research institutions in France or abroad, or from public or private research centers.
L’archive ouverte pluridisciplinaire HAL, est destinée au dépôt et à la diffusion de documents scientifiques de niveau recherche, publiés ou non, émanant des établissements d’enseignement et de recherche français ou étrangers, des laboratoires publics ou privés.
First Odin sub-mm retrievals in the tropical upper
troposphere: humidity and cloud ice signals
M. Ekström, P. Eriksson, B. Rydberg, D. P. Murtagh
To cite this version:
M. Ekström, P. Eriksson, B. Rydberg, D. P. Murtagh. First Odin sub-mm retrievals in the tropical upper troposphere: humidity and cloud ice signals. Atmospheric Chemistry and Physics Discussions, European Geosciences Union, 2006, 6 (5), pp.8649-8680. �hal-00302105�
ACPD
6, 8649–8680, 2006Odin upper tropospheric
humidity
Ekstr ¨om et al.
Title Page Abstract Introduction Conclusions References Tables Figures J I J I Back Close Full Screen / Esc
Printer-friendly Version Interactive Discussion
EGU
Atmos. Chem. Phys. Discuss., 6, 8649–8680, 2006 www.atmos-chem-phys-discuss.net/6/8649/2006/ © Author(s) 2006. This work is licensed
under a Creative Commons License.
Atmospheric Chemistry and Physics Discussions
First Odin sub-mm retrievals in the
tropical upper troposphere: humidity and
cloud ice signals
M. Ekstr ¨om, P. Eriksson, B. Rydberg, and D. P. Murtagh
Department of Radio and Space Science, Chalmers University of Technology, Gothenburg, Sweden
Received: 31 May 2006 – Accepted: 8 June 2006 – Published: 13 September 2006 Correspondence to: M. Ekstr ¨om ([email protected])
ACPD
6, 8649–8680, 2006Odin upper tropospheric
humidity
Ekstr ¨om et al.
Title Page Abstract Introduction Conclusions References Tables Figures J I J I Back Close Full Screen / Esc
Printer-friendly Version Interactive Discussion
EGU
Abstract
Odin-SMR is a limb-sounder operating in the 500 GHz region with the capability of performing measurements down to altitudes of about 10 km with relatively low influ-ence of ice clouds. Until now spectra from tropospheric tangent altitudes have been disregarded due to inadequate handling of scattering. A first method to extract upper
5
tropospheric quantities has now been developed, yielding the humidity in two layers around 200 and 130 hPa and information on cloud ice content above 200 hPa.
The main concern for these retrievals is the calibration performance. A careful anal-ysis indicates a systematic calibration error of about 1 K, but also a random component that differs between the two bands. The random calibration uncertainty results in
re-10
trieval errors of 10–60% depending on humidity and band. Presently this prohibits use of single retrievals, but averages can be presented with good accuracy. The fixed calibration error can largely be removed, leaving the spectroscopic uncertainties to dominate the humidity retrieval accuracy, estimated to be around 20%.
First results are presented that are in agreement with seasonal structure obtained
15
from other satellite measurements. An encouraging comparison between MOZAIC data and measurements for the 200 hPa layer gives further confidence in the capability of Odin-SMR to measure humidity in the upper tropical troposphere.
1 Introduction
Water is the strongest greenhouse agent in the Earth’s atmosphere and as such is an
20
important factor for the Earth’s radiation budget. In the upper troposphere (UT) water vapour and clouds are known to be the dominating factor for the out-going longwave radiation (OLR), see e.g.Harries (1996). The role of water in the climate system is complicated by the fact that both positive and negative feedback processes as a re-sult of an increased surface temperature have been suggested (e.g.Ramanathan and
25
ACPD
6, 8649–8680, 2006Odin upper tropospheric
humidity
Ekstr ¨om et al.
Title Page Abstract Introduction Conclusions References Tables Figures J I J I Back Close Full Screen / Esc
Printer-friendly Version Interactive Discussion
EGU
of these processes is to a large extent still uncertain. A review of the status of research on possible feedback processes connected to water vapour and cloud formation is pro-vided byHarries(2000).
Long-term measurements of upper tropospheric humidity (UTH) with complemen-tary instruments have been recommended to increase our understanding of its role
5
for the climate (Kley et al., 2000). To achieve global coverage satellite observations are the only practical option. The UT is frequently associated with cloud cover. For example,Mergenthaler et al. (1999) reported occurrence frequencies above 60% for large parts of the tropical region in 1992/1993 based on CLAES observations. Also the SAGE II 6-year climatology (Wang et al.,1996) and the later OSIRIS 3-year climatology
10
(Bourassa et al.,2005) give mean cloud occurrences of more than 25% for the tropi-cal UT. The frequent cloud coverage restricts the application of visible and infrared limb sounding and observations in these wavelengths are mainly performed in down-looking geometries. This results in a low vertical resolution and measurements that are most sensitive to a layer in the lower part of the UT. For example, infrared measurements
15
in the 6.3 µm band are sensitive to the water vapour column over a few hundred hPa around 300 hPa (e.g.Schmetz and Turpeinen,1988andSoden and Bretherton,1996). The microwave region exhibits a lower influence of cloud scattering, and therefore limb sounding can be performed to give improved vertical resolution in the UT. The small group of microwave limb-sounders deployed in orbit consists of UARS-MLS, Odin-SMR
20
and Aura-MLS. The best existing dataset of UTH was provided by UARS-MLS (Read
et al.,2001;Kley et al.,2000), partly for the reasons discussed above, while the UTH retrieval for Aura-MLS (Froidevaux et al.,2006) and Odin-SMR is in development.
Odin-SMR operates in the range 480–580 GHz, thus at sub-millimetre wavelengths, and was originally intended for upper atmospheric research. However the
measure-25
ments have sensitivity down to ∼10 km, that should allow for a possibility to retrieve UTH in the tropical region. This so far unused potential of Odin-SMR should be ex-ploited, considering the importance of UTH and the advantages of microwave limb sounding in the field. There is also potential for synergy with the MLS instruments
ACPD
6, 8649–8680, 2006Odin upper tropospheric
humidity
Ekstr ¨om et al.
Title Page Abstract Introduction Conclusions References Tables Figures J I J I Back Close Full Screen / Esc
Printer-friendly Version Interactive Discussion
EGU
as Odin-SMR covers partly the time gap between the UARS and Aura missions. In addition OdSMR would provide an independent microwave UTH data set as the in-strument designs and the observed frequency bands differ between the missions.
The retrieval of UTH requires that the influence of cloud scattering can be quantified, and this can now be achieved with recent development in the area of radiative transfer
5
calculations. This paper describes a first method (Sect.3) to retrieve UTH together with the ice cloud signal in the tropical upper troposphere. The results (Sect.4) will serve as an indication whether Odin radiances (Sect.2) can be utilised to retrieve water vapour and other constituents in the upper troposphere and lower stratosphere (UTLS) region. Comparisons with in-situ measurements are used as a quality check.
10
2 Data
2.1 Odin-SMR
Odin is a small Swedish research satellite built in cooperation with Canada, France and Finland (Nordh et al.,2003). It was launched into a sun-synchronous orbit in February 2001. The altitude of the orbit is 600 km and the period is 1.5 h. The satellite
car-15
ries a Sub-Millimetre Radiometer (SMR) which is time-shared between astronomy and aeronomy observations. For the aeronomy observations there is also a complemen-tary instrument that combines the optical and infrared region, the Optical Spectrograph and Infrared Imaging System (OSIRIS). The design lifetime of 2 years has now been surpassed by twice as much, and the instruments are continuously providing
measure-20
ments. Level 1 data are available from the later half of 2001 up to present time. The objective of the aeronomy mission is to provide global distributions of atmo-spheric species in the stratosphere and the mesosphere (Murtagh et al.,2002). This is achieved by limb-sounding measurements of thermal emission from the atmosphere. The satellite performs a scanning motion to cover the atmosphere from a few kilometres
25
ACPD
6, 8649–8680, 2006Odin upper tropospheric
humidity
Ekstr ¨om et al.
Title Page Abstract Introduction Conclusions References Tables Figures J I J I Back Close Full Screen / Esc
Printer-friendly Version Interactive Discussion
EGU
grouped into different observation modes associated with different frequency bands. Most of the observation time of the aeronomy mission is dedicated to the stratospheric mode and data are available for approximately every third day. Data from this observa-tion mode is used in this study, both due to the amount of data and to the fact that it has been thoroughly inspected for the operational inversions of stratospheric species (
Ur-5
ban et al.,2005). Stratospheric mode observations use two frequency bands around 501 and 544 GHz. The spectra cover a total of 800 MHz with a resolution of 1 MHz, either in a split-mode (501) or as a continuous frequency band (544). In the UT the signal in the window channels of these frequency bands consists mainly of far-wing absorption of the 557 GHz H2O line. These measurements have sensitivity down to
10
about 10 km in the 501 band which is farther away from the 557 GHz H2O line centre, and down to 14 km for the frequencies around 544 GHz.
2.2 MOZAIC
The Measurement of Ozone and Water Vapour by Airbus In-Service Aircraft (MOZAIC) program has been utilising commercial aircraft to perform measurements of water
15
vapour and other species in the upper troposphere since 1993 (Marenco et al.,1998). Its third phase, MOZAIC III, started in 2000 and continued to 2004, overlaps the first years of measurements performed by Odin. MOZAIC consists of automatic and regu-lar measurements on several long range passenger airliners. Of these flights roughly 20% pass into or through the tropical region. Most of the measurements (90%)
corre-20
spond to cruise altitudes around 9–12 km. This corresponds to the lowest altitude layer measured by Odin in the 501 GHz band. The instrument for water vapour is based on the Vaisala Humicap-H capacitive relative humidity sensor. The sensor is calibrated every 500 flight hour in an environmental simulation chamber and is shown to have an mean total uncertainty of ±7% RH in the upper troposphere (Helten et al.,1998). The
25
horizontal resolution at cruise altitude is about 15–50 km.
During 2001–2004 a total number of 1793 flights carrying the MOZAIC instrument entered or passed the tropical region. From these measurements around 455 000
ACPD
6, 8649–8680, 2006Odin upper tropospheric
humidity
Ekstr ¨om et al.
Title Page Abstract Introduction Conclusions References Tables Figures J I J I Back Close Full Screen / Esc
Printer-friendly Version Interactive Discussion
EGU
observations recorded at cruise altitude have been used in this study.
3 Method
The retrieval method described here is similar to the methods used to derive UTH from METEOSAT (Schmetz and Turpeinen,1988) and TOVS (Soden and Bretherton,
1996) radiances, but with the important differences that in this case the surface and
5
clouds interact much less with the retrieval and that spectra are handled individually. Temperature fields from ECMWF are used to compute the brightness temperatures, TB, for a set of relative humidities. The result is used as a mapping function to retrieve relative humidity with respect to ice (RHi) from the measured brightness temperatures. In cases of significant scattering the clear-sky RHi is cloud corrected using spectral
10
information from the observation. 3.1 Radiative transfer
The radiative transfer calculations are performed using the Atmospheric Radiative Transfer System (ARTS) forward model, which is a general forward model for the mil-limetre and sub-milmil-limetre spectral region (http://www.sat.uni-bremen.de/arts/). It
han-15
dles atmospheric geometries from 1-D to 3-D and also any observation geometry and sensor position needed. Detailed sensor characteristics are also handled effectively with an innovative sensor matrix method (Eriksson et al.,2006). In this study the side-band filter and antenna characteristics are included in the forward simulations. Some details on the calculation of gaseous absorption are given in Sect.4.1.2.
20
In ARTS the vector radiative transfer equation can be solved for all four Stokes com-ponents, at the same time as spherical geometry is considered. Together with two different modules to perform scattering calculations (Emde et al.,2004;Davies et al.,
2005) it is now possible to rigorously study the impact of ice clouds on limb sounding spectra.
ACPD
6, 8649–8680, 2006Odin upper tropospheric
humidity
Ekstr ¨om et al.
Title Page Abstract Introduction Conclusions References Tables Figures J I J I Back Close Full Screen / Esc
Printer-friendly Version Interactive Discussion
EGU
3.2 Tropospheric retrieval aspects
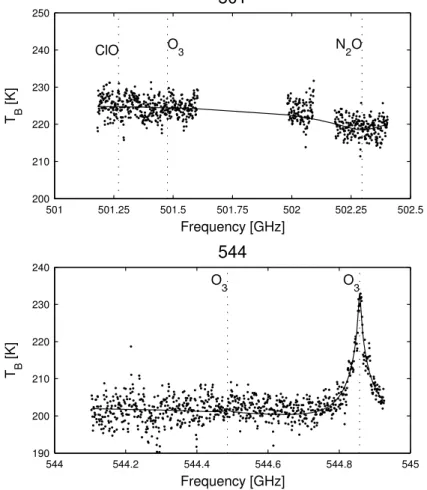
Odin spectra are saturated for the lowest tangent altitudes of the scan. The atmosphere has here very high optical thickness and with the 557 H2O line outside the frequency range covered the brightness temperature spectra become spectrally flat (Fig.1).
The retrieval is restricted to absolute brightness temperatures, since no shape
infor-5
mation is available. Consequently it is important to accurately know the temperature and the contribution of different species. At the frequencies considered in this retrieval water vapour completely dominates the absorption in most of the troposphere. The other strong absorbers in the UT are N2, O2and N2O. In the troposphere these species have very long lifetimes and their abundances are well known, hence they have no
im-10
pact on the retrieval. More important, other species such as ClO and O3, which could impact with the retrieval become significant only above 16 km at these frequencies. The signal in the windows channels of the tropospheric spectra can therefore be con-sidered to depend only on the amount of water vapour and temperature. Temperature is known with high accuracy from ECMWF analysis and a retrieval method relying on
15
the absolute brightness temperature is feasible.
Figure2 shows water vapour weighting functions for the two frequency bands. The weighting functions are defined as the sensitivity of the measurement to changes of H2O at different altitudes. A vertical resolution of 3–4 km can be estimated from the weighting functions. The sounding altitude of the measurements can be estimated
20
as the weighted mean altitude of these functions. Due to the shape of the weighting function the weighted mean altitude is slightly higher than the maximum of the weight-ing function. It can be seen that the soundweight-ing altitude is dependant on the UTH. For dry conditions the sensitivity will move toward lower altitudes and vice versa. For the 501 GHz band the sounding altitude goes from 10 km up to 13 km, and for 544 GHz the
25
range is 14–15.5 km.
Simulations have revealed that the sounding altitude throughout is found at more or less the same optical depth τ, however at different τ for the different bands. This is
ACPD
6, 8649–8680, 2006Odin upper tropospheric
humidity
Ekstr ¨om et al.
Title Page Abstract Introduction Conclusions References Tables Figures J I J I Back Close Full Screen / Esc
Printer-friendly Version Interactive Discussion
EGU
exploited to determine the sounding altitude of the individual measurements, where optical depth of τ=0.45 and τ=0.7 are used for 501.2 and 544.4 GHz, respectively. These values have been determined empirically by simulations of different humidity profiles, tangent altitudes and temperature profiles. The sensitivity to water vapour of this first retrieval scheme drops as the sounding altitude approaches the tropopause
5
and as a consequence only the tropical region (30◦S–30◦N) is considered. 3.3 Clear-sky conditions
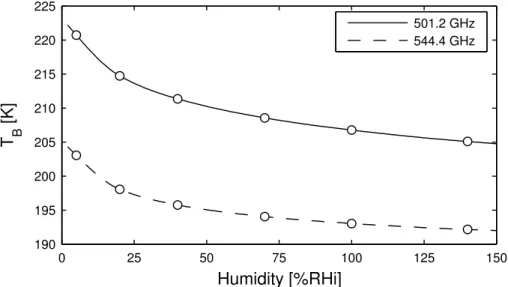
As a first step clear-sky conditions are assumed and a transfer function from TBto RHi is calculated by forward simulations for different RHi. This can basically be seen as creating a look-up table between TB and RHi. In the simulations the relative humidity
10
levels are assumed constant throughout the whole troposphere with a 2 km transition layer around the tropopause that connects the tropospheric humidity with a H2O clima-tology. The forward calculations are performed in a 2-D atmosphere, where temper-ature data are taken from ECMWF. Volume mixing ratios for other species than water vapour are taken from the Odin operational climatology.
15
The procedure starts by extracting the sensor position and geographic location of the targeted tangent point from the level 1b data. Temperature and mixing ratios are fetched for the time of the orbit. Odin measures in the orbital plane so the 2-D temper-ature field is extracted from the original 3-D grid along the satellite sub-track. In this way, the temperature gradients in the ECMWF field are preserved. With all forward
20
model input set up, the brightness temperatures are calculated for a set of RHi using ARTS. The set of RHi is chosen to cover humidities from very dry (5 %RHi) to super-saturated (140 %RHi), and to be dense enough to allow for interpolation of brightness temperatures between the fixed values. These simulated TB form together with their corresponding RHi level, the transfer function by which the measured TBis mapped to
25
RHi (Fig.3).
From the measured spectra a band of 100 MHz is averaged. This reduces the noise and also any contamination of periodic patterns, which can be discerned in averaged
ACPD
6, 8649–8680, 2006Odin upper tropospheric
humidity
Ekstr ¨om et al.
Title Page Abstract Introduction Conclusions References Tables Figures J I J I Back Close Full Screen / Esc
Printer-friendly Version Interactive Discussion
EGU
tropospheric spectra with a period of ∼100 MHz. The averaged brightness temperature is mapped to a RHi using the transfer function. Cubic interpolation is used for TBinside the calculated set of RHi, and for the values outside the range a linear extrapolation maintaining continuity up to the first derivative at the end points is applied.
The clear-sky retrieval procedure does not restrict how high the outcoming RHi can
5
be. Very high values of super-saturation are for example found for spectra with ice cloud interference. These spectra are handled by the cloud correction, described below. 3.4 Cloud interference
Clouds in the upper troposphere act to both scatter away the up-welling radiation from the lower warmer atmosphere and to scatter into the line-of-sight the radiation from the
10
region surrounding the ice cloud. For spectra measured at the lowest tangent altitudes the former dominates and the net effect throughout is a brightness temperature de-pression (Fig.4). The emission lines in the spectra, where the atmosphere becomes optical thick at altitudes above the cloud region, are less affected by the cloud scat-tering. These lines are used as a reference for verifying the TB depression derived
15
from the window channels. The difference between the line and the window channels is here denoted∆TB. In the frequency bands considered the strong emission lines are the 502.3 GHz N2O line in the 501 band, and the 544.86 GHz O3line in the 544 band.
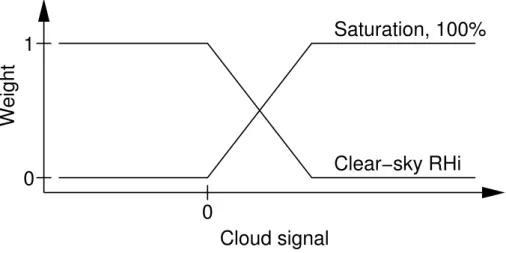
For cases of really strong scattering, i.e. thick ice clouds, the humidity is assumed to be saturated. By interpreting the TBdepression as a measure of the scattering power
20
of the cloud, it is used to weight the retrieved RHi with saturation (Fig.5). The weights are based on statistics from a large number of retrieved RHi and∆TB. The lowest∆TB level for a scattered signal is determined by linear regression of the clear-sky retrieved RHi for strong ice cloud signals. The upper limit in∆TBfor the weighting is determined by the 95 percentile of the maximum∆TBfor retrieved clear-sky RHi below 180%. Thus
25
allowing a supersaturation of 180 %RHi for clear sky. The 180 %RHi limit was chosen from the humidity distribution of MOZAIC measurements.
Initial studies have shown that the scattering signatures in the spectra are closely 8657
ACPD
6, 8649–8680, 2006Odin upper tropospheric
humidity
Ekstr ¨om et al.
Title Page Abstract Introduction Conclusions References Tables Figures J I J I Back Close Full Screen / Esc
Printer-friendly Version Interactive Discussion
EGU
related to the integrated cloud ice content above the sounding altitude (Rydberg,2004). The cloud ice signal is here given as the TB depression in the windows channel with respect to retrieved humidity. To accurately estimate the amount of ice from the cloud ice signal, assumptions on particle shape and size distribution are needed. This lies outside the scope of this paper, but is dealt with in an accompanying paper (Eriksson et
5
al., manuscript in preparation). As a rule of thumb, the amount of ice needed to cause a 0.5 K TBdepression in the window channel is ∼1 g/m2above 12.5 km. Here the cloud ice signal is presented as it is, without transformation to ice content.
3.5 Quality criteria
Measurements are discarded when either the spectrum is considered of bad quality or
10
the retrieval conditions are poor. The determination of spectra quality is complicated by the fact that scattering signatures can be difficult to distinguish from errors in calibration or spectrometer read out. To test the quality of the spectra a series of tests are per-formed based on features of the spectra that are less affected by ice cloud scattering. The quality bounds are based on statistics of a large number of spectra, both clear-sky
15
and with apparent cloud signature.
The retrieval method rely on the temperature gradient in the upper troposphere. For atmospheric conditions where the temperature gradient is low the uncertainty of the retrieved humidity becomes too large. To account for this, it is demanded that the TB range of the transfer function exceeds 15 K for 501 and 11 K for 544. The few cases of
20
negative retrieved RHi are rejected.
4 Results and discussion
4.1 Error estimation
Errors in the retrieval arise from uncertainties in the data and parameters used, both measured and modelled. The most important parts of the error budget are the
ACPD
6, 8649–8680, 2006Odin upper tropospheric
humidity
Ekstr ¨om et al.
Title Page Abstract Introduction Conclusions References Tables Figures J I J I Back Close Full Screen / Esc
Printer-friendly Version Interactive Discussion
EGU
tainties in calibration and therefore these are discussed separately. The error sources are divided into systematic and random. Due to the non-linearity of the transfer func-tion used in the retrieval (Fig.3), the sensitivity to uncertainties increases with relative humidity. The errors are here presented for the 100 %RHi level to obtain conservative estimates.
5
4.1.1 Calibration accuracy
The retrieval performance is very sensitive to the calibration of the measured radiances, partly as the retrieval method deals with absolute brightness temperatures. The accu-racy of current version of the calibration algorithm has been thoroughly investigated using in-flight observations (Ekstr ¨om and Eriksson,2006). The study was performed
10
by comparing simulated and measured Odin-SMR spectra, exploiting the fact that mea-sured values are completely determined by the atmospheric temperature if the atmo-sphere is isothermal and has a high optical thickness. Highly accurate simulations can be performed for such conditions even if there are considerable uncertainties regard-ing the amount of different gas species and instrument responses such as sideband
15
ratio and pointing offsets. This is the case as the atmosphere will act as a blackbody independently of gas variations, as long as a sufficiently high optical thickness is pre-served, and that measured TBdepends on neither tangent altitude nor frequency. The only demand is that the atmospheric temperature is known accurately. A completely isothermal atmosphere is not required in practice, it is sufficient that the temperature
20
gradient is close to zero in the altitude range corresponding to optical thicknesses in the order of one. These conditions are most closely met for Odin-SMR in the sub-arctic region for tangent altitudes below 8 km. ECMWF is used throughout as a priori temper-ature information for Odin-SMR, and the calibration was then assessed with respect to ECMWF temperatures, instead of in completely absolute terms. Detailed simulations
25
confirmed that significant differences between observed and simulated TB are directly related to calibration errors. For more details seeEkstr ¨om and Eriksson(2006).
It was found that the calibration error for tropospheric spectra (TB≈200 K) consist of 8659
ACPD
6, 8649–8680, 2006Odin upper tropospheric
humidity
Ekstr ¨om et al.
Title Page Abstract Introduction Conclusions References Tables Figures J I J I Back Close Full Screen / Esc
Printer-friendly Version Interactive Discussion
EGU
a systematic and a random component. The systematic part was estimated to 1 K. The random calibration error was found to be ∼2 K, with probably a smaller value for the 501 band and a larger in the 544 band. These values were later found to be consistent with the distribution of UTH values obtained that lie outside the expected range (Sect.4.2). 4.1.2 Systematic errors
5
A systematic calibration error of 1 K was established (Sect.4.1.1) and Odin-SMR val-ues are corrected before the inversion with this value. This procedure should remove the main part of this error source. A rough estimate for the systematic error in the cal-ibration study is 0.2 K and this value is used to represent the remaining retrieval error. It is worth repeating that the calibration accuracy was evaluated only with respect to
10
ECMWF temperatures.
Other major systematic errors are associated with uncertainties in spectroscopic data used . The 557 GHz H2O line dominates the spectral region, and changes to its spectroscopic parameters have been investigated. Line intensities in the microwave re-gion are generally assumed to be known with 2 % accuracy, and this value is adopted
15
here. The air broadened width is derived from measurements of the corresponding line in a vibrational band at 1.39 µm (Moretti et al.,2001) and a direct error estimate is difficult. The value is 3.20 MHz/hPa. The temperature exponent for the air broadening is set to 0.64, taken from HITRAN.Kuhn(2003) gives a complete review of absorption models for the microwave region. Reported values for air broadening parameters
dis-20
cussed vary between 3.00–3.24 MHz/hPa and 0.60–0.69, respectively. The values of 3.00 MHz/hPa and 0.60 give the highest difference to the values assumed here, and are used to establish an error estimate. These values are both from the 1987 version of the Millimeter-wave Propagation Model, and gives a 8% lower line width at 200 K. This combined uncertainty is in Table 5 covered by a 8% error in the air broadened
25
width, aγ.
The calculation of nitrogen absorption follows Liebe et al. (1993). The maximum uncertainty for this term is set to 30%. This value is based on discussions in Kuhn
ACPD
6, 8649–8680, 2006Odin upper tropospheric
humidity
Ekstr ¨om et al.
Title Page Abstract Introduction Conclusions References Tables Figures J I J I Back Close Full Screen / Esc
Printer-friendly Version Interactive Discussion
EGU
(2003). For example, Pardo et al. (2001) found that the best fit to measured data was found with a 29% increase of the nitrogen absorption. The discrepancy found is not necessarily associated with nitrogen, it could be caused by gases and molecular interactions normally not considered in the microwave region.
The calculation of water vapour includes the addition of an empirically determined
5
term, normally denoted as continuum absorption. This term is taken fromKuhn(2003). The uncertainty of this term at 500 GHz is not known and a value of 30% is applied here as well.
The systematic retrieval errors are summarised in Table5. 4.1.3 Random errors
10
The random error sources considered are given in Table 2, together with the asso-ciated UTH errors. Uncertainties and errors are throughout assumed to be normally distributed and reported as one standard deviation.
The retrievals are based on 100 MHz wide spectral averages and the variation due to thermal noise is for Odin-SMR at this frequency resolution 0.5 K. However, the thermal
15
noise is here overshadowed of the random part of the calibration error, estimated to be 2 K (Sect.4.1.1). Increasing the width of the spectral averaging would decrease the thermal noise, but not the calibration uncertainty as it is completely correlated between the spectrometer channels.
Another instrumental error source is pointing off-sets. The standard processing has
20
shown that present version of level 1 data has a pointing uncertainty of 0.01◦. The potential to decrease this uncertainty still exists. All level 1 data do not include latest updates of the attitude data, and a reprocessing will be performed before next ver-sion of the standard retrieval products. A further improvement would be obtained by incorporating the pointing off-set determined in the operational processing, having a
25
precision of ∼0.0025◦. The nature of the observation gives a higher impact of a point-ing off-set towards higher tangent altitudes, and this direction has been assumed when mapping the pointing uncertainty to an UTH error.
ACPD
6, 8649–8680, 2006Odin upper tropospheric
humidity
Ekstr ¨om et al.
Title Page Abstract Introduction Conclusions References Tables Figures J I J I Back Close Full Screen / Esc
Printer-friendly Version Interactive Discussion
EGU
The precision in ECMWF temperatures was assumed to be 1 K (1σ). The retrieval assumes a constant RHi through the troposphere, and the impact of this assumption has been determined empirically. This was done by simulating a large set of measure-ments with randomly selected linear varying humidity profiles in the troposphere. The result was an average deviation of 2 %RHi.
5
Cloud scattering induces additional uncertainty in the UTH retrieval. A characteri-sation of this error would require a better knowledge on ice clouds in the upper tropo-sphere than that provided by existing observation systems. However, it is estimated that the cloud correction algorithm does not cause any substantial systematic errors, the correction can result in both too low and too high retrieved RHi, with similar
proba-10
bility and size in both directions. If the scattering is strong, it is expected that the water vapour is in equilibrium with the cloud ice particles causing the scattering and UTH is accordingly set to 100 %RHi. The retrieval can thus be said to only use a priori infor-mation. The humidity variation inside clouds at low temperatures (below −40◦C) was reported byOvarlez et al.(2002) to be 20 %RHi. A conservative estimate of the overall
15
precision of the cloud correction is also 20 %RHi, and this value is applied generally. An interesting consequence of the assumptions around the cloud correction is that the retrieval error is relatively small for cases with strong scattering. The retrieval error is then equal to the a priori uncertainty for humidity inside ice clouds (20%).
Treating the random errors as independent variables, the total error at 100 %RHi
20
can be estimated to 39 %RHi for 501.2 GHz and 59 %RHi for 544.4 GHz. The retrieval precision is hence too poor for an useful analysis of individual data points. However, these errors are expected to be of pure random nature and averaged values will have considerably smaller errors. For long term averages the retrieval error will accordingly be of primarily systematic nature.
25
4.2 Upper tropospheric humidity
The sounding range of the 501 GHz band coincides with the altitude of the bulk of MOZAIC data, as noted in Sect.2.2. The MOZAIC data then offer an interesting
op-ACPD
6, 8649–8680, 2006Odin upper tropospheric
humidity
Ekstr ¨om et al.
Title Page Abstract Introduction Conclusions References Tables Figures J I J I Back Close Full Screen / Esc
Printer-friendly Version Interactive Discussion
EGU
tion for validation. It was found that the MOZAIC flights into the tropical region are too few to allow a comparison with data separated geographically. The two data sets are instead compared statistically by their distributions. All MOZAIC data are included in the comparison, while for Odin-SMR only data from regions around the flight routes are considered. The comparison is shown in Fig.6. Both distributions show the same
5
overall pattern, but with notable differences for <20 %RHi and >120 %RHi. However, simulations showed that the differences at both ends of the distribution can be ex-plained as an effect of the established random calibration uncertainty. The differences between the distributions are thus primarily caused by the relatively large random re-trieval error for Odin-SMR. The comparison indicates further that no larger systematic
10
errors exist, which is consistent with the findings of Sect.4.1.2.
As already stated, the low precision of the calibration makes the individual results less interesting and the purpose of this paper is not to investigate the data set in detail. Only some long term averages are here presented, with the aim of checking if the data have the expected geographical and seasonal variations. The highest number of
15
measurements is found for 501.2 GHz during December–February (DJF) and March– May (MAM). This as the aeronomy part of the mission is given priority during these seasons in order to study Arctic ozone depletion. This is compensated by more time given to astronomy during the other seasons, June–August (JJA) and September– November (SON). The amount of data retrieved is also limited by the quality of the
20
measured spectra. With the current calibration scheme, the 501 spectra have shown to be more stable than for those 544, and therefore more data are at hand for the lower altitude layer.
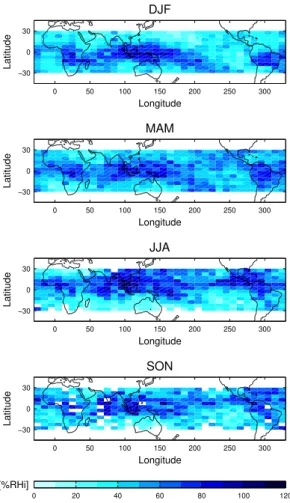
In Fig.7 multi-year seasonal averages of the 200 hPa relative humidity are shown. The standard deviation for the averaged humidity in the gridboxes is below 7 %RHi.
25
High relative humidities are found over Central Africa, the maritime continent and Central- and South America. These regions are the centra of the three tropical mon-soon systems, regions with strong convection. The band of high humidity associated with the intertropical convergence zone is also visible over the Pacific Ocean. The
ACPD
6, 8649–8680, 2006Odin upper tropospheric
humidity
Ekstr ¨om et al.
Title Page Abstract Introduction Conclusions References Tables Figures J I J I Back Close Full Screen / Esc
Printer-friendly Version Interactive Discussion
EGU
sonal patterns are consistent with what has been seen at 215 hPa by e.g. UARS-MLS (Chen et al.,1999). The regions of high humidity move with the season from the the South side of the Equator during DJF, southern summer, to the North side during JJA, northern summer.
For the 544 GHz band, only the average humidity from December 2001–August
5
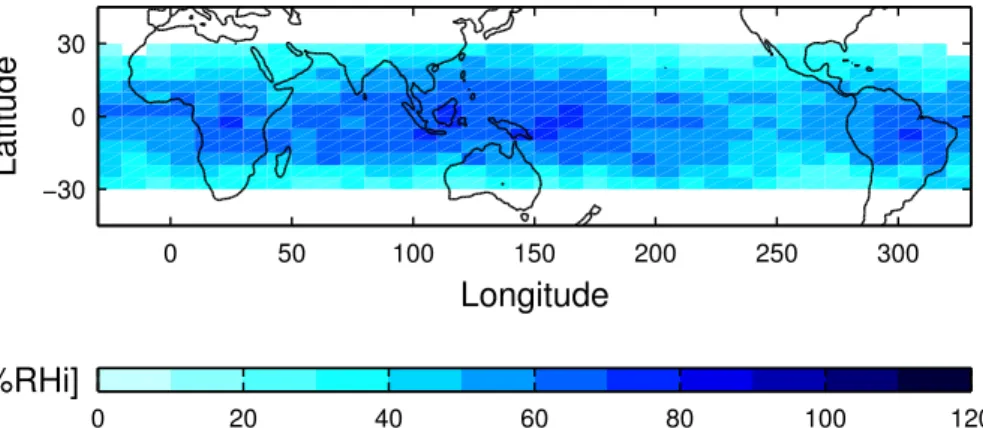
2004 is shown here (Fig.8). At 544 GHz the measured layer is close to the tropical tropopause. In this region high relative humidity and supersaturation is expected. The 130 hPa field measured by Odin shows also a higher mean humidity than at 200 hPa. The meridional structure is also much less pronounced, which is consistent withSassi
et al. (2001). The standard deviation for the 544 GHz multi-year averages is less than
10
8 %RHi.
4.3 Cloud ice signals
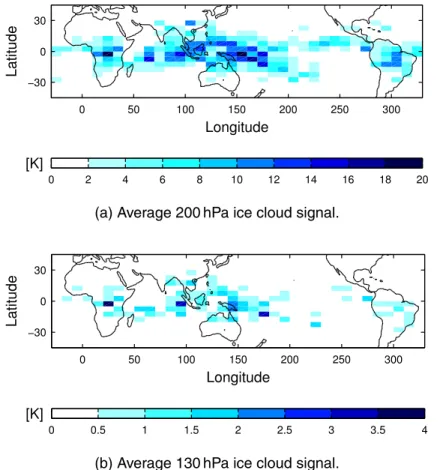
The cloud ice signal is calculated as the brightness temperature depression from the TBcorresponding to retrieved humidity. Figure9shows the averaged TBdepression for the whole time period of measurements. The higher 130 hPa layer shows a much lower
15
mean TB depression than the lower 200 hPa layer. This is probably an effect of that both ice water content and particle size are decreasing with altitude. Relatively thick ice clouds are needed to give a noticeable scattering, and such clouds should mainly be found in the areas of strong convection. The cloud field at 130 hPa follows also the pattern of convection, while for humidity it was found to be more smooth (Fig.8).
20
5 Conclusions
A first method to retrieve UTH from Odin radiances has been developed. Humidity is re-trieved in two altitude layers around 200 and 130 hPa from the 501 and 544 GHz bands, respectively. Scattering signals from the spectra are used to correct the retrieved hu-midities when ice cloud interference is detected. Beside the UTH, the method gives
ACPD
6, 8649–8680, 2006Odin upper tropospheric
humidity
Ekstr ¨om et al.
Title Page Abstract Introduction Conclusions References Tables Figures J I J I Back Close Full Screen / Esc
Printer-friendly Version Interactive Discussion
EGU
also a measure of the strength of the scattering signal, that can be used to retrieve the amount of cloud ice for altitudes above 12 km. The mapping of cloud signals to ice contents is discussed separately.
The main UTH retrieval error source is the calibration uncertainty. The individual retrieval results have large random errors with the present version of the calibration
al-5
gorithm. On the other hand, the systematic retrieval errors were found be low, which is the main concern when investigating seasonal means etc. A comparison with MOZAIC data confirmed the error characterisation performed, and a first investigation of long term averages gave the expected geographical and altitude patterns. The accuracy of such long term Odin-SMR averages should be among the best that can be achieved
10
with present satellite instrumentation, especially when it is considered that “all-weather” UTH is provided. The measurements are not restricted to clear-sky conditions.
A higher precision in the calibration algorithm would be very beneficial for the scien-tific usage of the data and further studies on how to improve the calibration scheme are therefore strongly recommended. In addition, the presented method is just a first step
15
towards making full use of the potential of Odin-SMR in the UTLS region. The standard processing uses data effectively down to about 18 km, while here only spectra with tan-gent altitudes below 8 km were considered. This study has shown that Odin-SMR has a low systematic calibration error and that the impact of scattering can be handled. These are requirements for performing UTLS retrievals and more advanced retrieval
20
schemes can now be considered. This includes the possibility of performing 2-D to-mographic retrievals, that is possible as around the lower turning point of the scanning motion, the successive line of sights of the antenna are overlapping. An initial study of such retrievals has shown a good measurement sensitivity to water vapour between 10 and 25 km.
25
Acknowledgements. The authors acknowledge M. Olberg at Onsala Space Observatory and
U. Frisk at Swedish Space Corporation for their work on the Odin data and calibration. MOZAIC data were provided from the MOZAIC Data Base. This paper has been made possible through the support and previous work of the entire Odin-SMR team. The work has been funded by
ACPD
6, 8649–8680, 2006Odin upper tropospheric
humidity
Ekstr ¨om et al.
Title Page Abstract Introduction Conclusions References Tables Figures J I J I Back Close Full Screen / Esc
Printer-friendly Version Interactive Discussion
EGU
the Swedish National Graduate school of Space Technology and the Swedish National Space Board.
References
Bourassa, A. E., Degenstein, D. A., and Llewellyn, E. J.: Climatology of the subvisual cirrus clouds as seen by OSIRIS on Odin, Adv. Space Res., 36, 807–812, 2005. 8651
5
Chen, M., Rood, R., and Read, W.: Seasonal variations of upper tropospheric water vapour and high clouds observed from satellites, J. Geophys. Res., 104, 6193–6197, 1999. 8664 Davies, C., Emde, C., and Harwood, R.: A 3-D polarized reversed Monte Carlo radiative transfer
model for millimeter and submillimeters passive remote sensing in cloudy atmospheres, IEEE Trans Geosci. Remote Sensing, 43, 1096–1101, 2005. 8654
10
Ekstr ¨om, M. and Eriksson, P.: Calibration accuracy of Odin-SMR tropospheric spectra, Tech. rep., Department of Radio and Space Science, Chalmers University of Technology, 2006. 8659
Emde, C., Buehler, S. A., Davis, C., Eriksson, P., Sreerekha, T. R., and Teichmann, C.: A polarized discrete ordinate scattering model for simulations of limb and nadir
long-15
wave measurements in 1-D/3-D spherical atmospheres, J. Geophys. Res., 109, D24207, doi:10.1029/2004JD005140, 2004. 8654
Eriksson, P., Ekstr ¨om, M., Buehler, S. A., and Melsheimer, C.: Efficient forward modelling by matrix representation of sensor responses, Int. J. Remote Sens., 27, 1793–1808, 2006. 8654
20
Eriksson, P., Ekstr ¨om, M., Rydberg, B., and Murtagh, P.: First Odin sub-mm retrievals in the tropical upper troposphere: ice cloud properties, Atmos. Chem. Phys. Discuss., 6, 8681– 8712, 2006.
Froidevaux, L., Livesey, N. J., Read, W. G., Jiang, Y. B., Jimenez, C., Filipiak, M. J., Schwartz, M. J., Santee, M. L., Pumphrey, H. C., Jiang, J. H., Wu, D. L., Manney, G. L., Drouin, B. J.,
25
Waters, J. W., Fetzer, E. J., Bernath, P. F., Boone, C. D., Walker, K. A., Jucks, K. W., Toon, G. C., Margitan, J. J., Sen, B., Webster, C. R., Christensen, L. E., Elkins, J. W., Atlas, E., Lueb, R. A., and Hendershot, R.: Early validation analyses of atmospheric profiles from EOS MLS on the Aura satellite, IEEE Trans. Geosci. Remote Sensing, 44, 1106–1121, 2006. 8651
ACPD
6, 8649–8680, 2006Odin upper tropospheric
humidity
Ekstr ¨om et al.
Title Page Abstract Introduction Conclusions References Tables Figures J I J I Back Close Full Screen / Esc
Printer-friendly Version Interactive Discussion
EGU
Harries, J. E.: The greenhouse Earth: A view from space, Quart. J. Roy. Meteorol. Soc., 122, 799–818, 1996. 8650
Harries, J. E.: Physics of the Earth’s radiative energy balance, Contemp. Phys., 41, 309–322, 2000. 8651
Helten, M., Smit, H. G. J., Str ¨ater, W., Kley, D., Nedelec, P., Z ¨oger, M., and Busen, R.:
Calibra-5
tion and preformance of automatic compact instrumentation for the measurement of relative humidity from passenger aircraft, J. Geophys. Res., 103, 25 643–25 652, 1998. 8653 Kley, D., Russell III, J. M., and Phillips, C. (Eds.): SPARC Assessment of upper tropospheric
and stratospheric water vapour, WCRP 113, WMO/TD No. 1043, SPARC Report No. 2, 2000. 8651
10
Kuhn, T.: Atmospheric absorption models for the millimeter wave range, Ph.D. thesis, Institute of Environmental Physics, University of Bremen, 2003. 8660,8661
Liebe, H. J., Hufford, G. A., and Cotton, M. G.: Propagation modeling of moist air and sus-pended water/ice particles at frequencies below 1000 GHz, in: NATO/AGARD Wave Propa-gation Panel, 52nd Meeting, 3/1–10, Spain, 1993. 8660
15
Lindzen, R. S., Chou, M.-D., and Hou, A. Y.: Does the Earth have an adaptive infrared iris?, Bull. Amer. Meteorol. Soc., 82, 417–432, 2001. 8650
Marenco, A., Thouret, V., N ´ed ´elec, P., Smit, H., Helten, M., Kley, D., Karcher, F., Simon, P., Law, K., Pyle, J., Poschmann, G., von Wrede, R., Hume, C., and Cook, T.: Measurement of ozone and water vapor by Airbus in-service aircraft: The MOZAIC airborne program, an overwiew,
20
J. Geophys. Res., 103, 25 631–25 642, 1998. 8653
Mergenthaler, J. L., Roche, A. E., Kumer, J. B., and Ely, G. A.: Cryogenic Limb Array Etalon Spectrometer observations of tropical cirrus, J. Geophys. Res., 104, 22 183–22 194, 1999. 8651
Minschwaner, K. and Dessler, A. E.: Water vapor feedback in the tropical upper troposphere:
25
Model results and observations, J. Climate, 17, 1272–1282, 2004. 8650
Moretti, L., Sasso, A., Gianfrani, L., and Ciurylo, R.: Collisional-broadened and Dicke-narrowed lineshapes of H216O and H218O transitions at 1.39 µm, J. Mol. Spectrosc., 20–27, 2001. 8660
Murtagh, D., Frisk, U., Merino, F., Ridal, M., Jonsson, A., Stegman, J., Witt, G., Eriksson, P.,
30
Jim ´enez, C., Megie, G., de La No ¨e, J., Ricaud, P., Baron, P., Pardo, J. R., Hauchcorne, A., Llewellyn, E. J., Degenstein, D. A., Gattinger, R. L., Lloyd, N. D., Evans, W. F. J., Mc-Dade, I. C., Haley, C., Sioris, C., von Savigny, C., Solheim, B. H., McConnell, J. C., Strong,
ACPD
6, 8649–8680, 2006Odin upper tropospheric
humidity
Ekstr ¨om et al.
Title Page Abstract Introduction Conclusions References Tables Figures J I J I Back Close Full Screen / Esc
Printer-friendly Version Interactive Discussion
EGU
K., Richardson, E. H., Leppelmeier, G. W., Kyr ¨ol ¨a, E., Auvinen, H., and Oikarinen, L.: An overview of the Odin atmospheric mission, Can. J. Phys., 80, 309–319, 2002. 8652
Nordh, H. L., von Sch ´eele, F., Frisk, U., Ahola, K., Booth, R. S., Encrenaz, P. J., Hjalmarson, A., Kendall, D., Kyr ¨ol ¨a, E., Kwok, S., Lecacheux, A., Leppelmeier, G., Llewellyn, E. J., Mattila, K., M ´egie, G., Murtagh, D., Rougeron, M., and Witt, G.: The Odin orbital observatory, Astron.
5
Astrophys., 402, L21–L25, 2003. 8652
Ovarlez, J., Gayet, J.-F., Gierens, K., Str ¨om, J., Ovarlez, H., Auriol, F., Busen, R., and Schu-mann, U.: Water vapour measurements inside cirrus clouds in Northern and Southern hemi-spheres during INCA, Geophys. Res. Lett., 29, 60–64, 2002. 8662
Pardo, J. R., Serabyn, E., and Cernicharo, J.: Submillimeter atmospheric transmission
mea-10
surements on Mauna Kea during extremely dry El Ni ˜no conditions: implications for broad-band opacity contributions, J. Quant. Spectrosc. Radiat. Transfer, 68, 419–433, 2001. 8661 Ramanathan, V. and Collins, W.: Thermodynamic regulation of ocean warming by cirrus clouds
deduced from observations of the 1987 El Ni ˜no, Nature, 351, 27–32, 1991. 8650
Read, W. G., Waters, J. W., Wu, D. L., Stone, E. M., Shippony, Z., Smedley, A. C., Smallcomb,
15
C. C., Oltmans, S., Kley, D., Smit, H. G. J., Mergenthaler, J. L., and Karki, M. K.: UARS Mi-crowave Limb Sounder upper tropospheric humidity measurements: Method and validation, J. Geophys. Res., 106, 32 207–32 258, 2001. 8651
Rydberg, B.: Submillimeter-wave radiometric measurements of cirrus cloud ice, Master’s the-sis, Chalmers University of Technology, G ¨oteborg, Sweden, 2004. 8658
20
Sassi, F., Salby, M., and Read, W. G.: Relationship between upper tropospheric humidity and deep convection, J. Geophys. Res., 106, 17 133–17 146, 2001. 8664
Schmetz, J. and Turpeinen, O. M.: Estimation of the upper tropospheric relative humidity field from METEOSAT water vapor image data, J. Appl. Meteorol., 27, 889–899, 1988. 8651, 8654
25
Soden, B. J. and Bretherton, F. P.: Interpolation of TOVS water vapor radiances in terms of layer-average relative humidities: Method and climatology for the upper, middle and lower troposphere, J. Geophys. Res., 101, 9333–9343, 1996. 8651,8654
Urban, J., Lauti ´e, N., Le Flochmo ¨en, E., Jim ´enez, C., Eriksson, P., Dupuy, E., El Amraoui, L., Ekstr ¨om, M., Frisk, U., Murtagh, D., de La No ¨e, J., Olberg, M., and Ricaud, P.: Odin/SMR
30
limb observations of stratospheric trace gases: Level 2 processing of ClO, N2O, O3, and HNO3, J. Geophys. Res., 110, doi:10.1029/2004JD005741, 2005. 8653
ACPD
6, 8649–8680, 2006Odin upper tropospheric
humidity
Ekstr ¨om et al.
Title Page Abstract Introduction Conclusions References Tables Figures J I J I Back Close Full Screen / Esc
Printer-friendly Version Interactive Discussion
EGU
of cloud occurence frequency from Stratospheric Aerosol and Gas Experiment II observa-tions (1985–1990), J. Geophys. Res., 101, 29 407–29 429, 1996. 8651
ACPD
6, 8649–8680, 2006Odin upper tropospheric
humidity
Ekstr ¨om et al.
Title Page Abstract Introduction Conclusions References Tables Figures J I J I Back Close Full Screen / Esc
Printer-friendly Version Interactive Discussion
EGU
Table 1. Estimated upper limit for systematic uncertainties and corresponding retrieval error. Calculated for 100 %RHi and a 8 km tangent altitude.
Error source ∆ ∆RHi[ %RHi] 501.2 GHz 544.4 GHz 557 GHz H2O i0 2 % 1.8 2.5 557 GHz H2O aγ 8 % 4.8 5.2 H2O continua 30 % 3.9 0.6 N2absorption 30 % 8.4 2.4 Calibration 0.2 K 3.2 6.4
ACPD
6, 8649–8680, 2006Odin upper tropospheric
humidity
Ekstr ¨om et al.
Title Page Abstract Introduction Conclusions References Tables Figures J I J I Back Close Full Screen / Esc
Printer-friendly Version Interactive Discussion
EGU
Table 2. Summary of random retrieval errors. Estimates are given at the 1 standard deviation level. Evaluated for 100 %RHi, cloud-free conditions and a 8 km tangent altitude. The random retrieval error is smaller for both lower RHi values and cases of thick ice clouds.
Error source σ σRHi[ %RHi] 501.2 GHz 544.4 GHz Thermal noise, TB 0.5 K 8.0 16 Calibration, TB 2 K 30 50 Pointing 0.01◦ 6.8 3.8 Temperature 1 K 9.7 18 Constant %RHi – 2 2 Scattering – 20 20 Total 39 59 8671
ACPD
6, 8649–8680, 2006Odin upper tropospheric
humidity
Ekstr ¨om et al.
Title Page Abstract Introduction Conclusions References Tables Figures J I J I Back Close Full Screen / Esc
Printer-friendly Version Interactive Discussion EGU 501 501.25 501.5 501.75 502 502.25 502.5 200 210 220 230 240 250 501 T B [K] Frequency [GHz] ClO O3 N2O 544 544.2 544.4 544.6 544.8 545 190 200 210 220 230 240 544 T B [K] Frequency [GHz] O3 O3
Fig. 1. Example of spectra from the troposphere tangent altitudes in the stratospheric observa-tion mode. The solid line represents simulated spectra for the retrieved humidity. The spectra shown correspond to an integration time of 0.875 s with a resolution of 1 MHz, giving a thermal noise of σ=3 K.
ACPD
6, 8649–8680, 2006Odin upper tropospheric
humidity
Ekstr ¨om et al.
Title Page Abstract Introduction Conclusions References Tables Figures J I J I Back Close Full Screen / Esc
Printer-friendly Version Interactive Discussion EGU −1 0 6 8 10 12 14 16 18 20 22
501.2 GHz
Altitude [km]
10 %RHi 50 %RHi 100 %RHi −1 0544.4 GHz
Weighting function [K/1
⋅
km]
Fig. 2. Weighting functions for a doubling of H2O. Three cases of RHi in the troposphere are considered and calculations made for a tangent altitude of 7 km and a tropical atmosphere. The secondary maxima seen at 544.4 GHz for a dry atmosphere is caused by the transition to the H2O climatology.
ACPD
6, 8649–8680, 2006Odin upper tropospheric
humidity
Ekstr ¨om et al.
Title Page Abstract Introduction Conclusions References Tables Figures J I J I Back Close Full Screen / Esc
Printer-friendly Version Interactive Discussion EGU 0 25 50 75 100 125 150 190 195 200 205 210 215 220 225 T B [K] Humidity [%RHi] 501.2 GHz 544.4 GHz
Fig. 3. Typical transfer functions calculated for tangent altitude of 8 km and standard tropical atmosphere. The lines shows the inter- and extrapolation around the simulated RHi levels, shown as circles.
ACPD
6, 8649–8680, 2006Odin upper tropospheric
humidity
Ekstr ¨om et al.
Title Page Abstract Introduction Conclusions References Tables Figures J I J I Back Close Full Screen / Esc
Printer-friendly Version Interactive Discussion EGU 501 501.25 501.5 501.75 502 502.25 502.5 50 100 150 200 250 501 T B [K] Frequency [GHz] ClO O3 N2O 544 544.2 544.4 544.6 544.8 545 50 100 150 200 250 544 T B [K] Frequency [GHz] O3 O3
Fig. 4. Example of tropospheric spectra with strong ice cloud signal. Solid line represents simulated spectra for 100 %RHi. Note the emission lines of N2O in 501 and O3in 544 that has become visible.
ACPD
6, 8649–8680, 2006Odin upper tropospheric
humidity
Ekstr ¨om et al.
Title Page Abstract Introduction Conclusions References Tables Figures J I J I Back Close Full Screen / Esc
Printer-friendly Version Interactive Discussion EGU
Clear−sky RHi
1
0
0
Weight
Cloud signal
Saturation, 100%
Fig. 5. Principle of weighting of clear-sky retrieved humidity with saturation for cloud correction. The∆TBcorresponding to zero cloud signal is determined from statistics. Below that the re-trieved RHi is equal to the clear-sky RHi. For a sufficiently strong ice cloud signal the retrieved RHi is set to 100 %RHi.
ACPD
6, 8649–8680, 2006Odin upper tropospheric
humidity
Ekstr ¨om et al.
Title Page Abstract Introduction Conclusions References Tables Figures J I J I Back Close Full Screen / Esc
Printer-friendly Version Interactive Discussion EGU 0 20 40 60 80 100 120 140 160 180 200 0 0.5 1 1.5 2 Humidity [%RHi] Fraction of occurance [%] MOZAIC Odin 501 GHz
Fig. 6. Histogram of individual measurements of UTH from Odin at 200 hPa and MOZAIC. Odin-SMR cases of strong scattering are here included following a random normal distribution of µ=100 %RHi and σ=20 %RHi (see further the text).
ACPD
6, 8649–8680, 2006Odin upper tropospheric
humidity
Ekstr ¨om et al.
Title Page Abstract Introduction Conclusions References Tables Figures J I J I Back Close Full Screen / Esc
Printer-friendly Version Interactive Discussion EGU DJF Latitude Longitude 0 50 100 150 200 250 300 −30 0 30 MAM Latitude Longitude 0 50 100 150 200 250 300 −30 0 30 JJA Latitude Longitude 0 50 100 150 200 250 300 −30 0 30 SON Latitude Longitude 0 50 100 150 200 250 300 −30 0 30 [%RHi] 0 20 40 60 80 100 120
Fig. 7. Seasonal averaged maps of the 200 hPa cloud corrected retrieved UTH for 2001–2004. The data are averaged over 5◦ in latitude and 10◦ in longitude. White areas are either outside considered latitude range or grid boxes with relatively few data points.
ACPD
6, 8649–8680, 2006Odin upper tropospheric
humidity
Ekstr ¨om et al.
Title Page Abstract Introduction Conclusions References Tables Figures J I J I Back Close Full Screen / Esc
Printer-friendly Version Interactive Discussion EGU Latitude Longitude 0 50 100 150 200 250 300 −30 0 30 [%RHi] 0 20 40 60 80 100 120
Fig. 8. Average 130 hPa cloud corrected retrieved UTH for 2001–2004. Otherwise as Fig.7.
ACPD
6, 8649–8680, 2006Odin upper tropospheric
humidity
Ekstr ¨om et al.
Title Page Abstract Introduction Conclusions References Tables Figures J I J I Back Close Full Screen / Esc
Printer-friendly Version Interactive Discussion EGU Latitude Longitude 0 50 100 150 200 250 300 −30 0 30 [K] 0 2 4 6 8 10 12 14 16 18 20
(a) Average 200 hPa ice cloud signal.
Latitude Longitude 0 50 100 150 200 250 300 −30 0 30 [K] 0 0.5 1 1.5 2 2.5 3 3.5 4
(b) Average 130 hPa ice cloud signal.
Fig. 9. Cloud ice signals averaged for December 2001–August 2004. Gridboxes are 5◦wide in latitude and 10◦in longitude.