HAL Id: hal-00318191
https://hal.archives-ouvertes.fr/hal-00318191
Submitted on 20 Oct 2006
HAL is a multi-disciplinary open access
archive for the deposit and dissemination of
sci-entific research documents, whether they are
pub-lished or not. The documents may come from
teaching and research institutions in France or
abroad, or from public or private research centers.
L’archive ouverte pluridisciplinaire HAL, est
destinée au dépôt et à la diffusion de documents
scientifiques de niveau recherche, publiés ou non,
émanant des établissements d’enseignement et de
recherche français ou étrangers, des laboratoires
publics ou privés.
Evidence of standing waves during a Pi2 pulsation event
observed on Cluster
A. B. Collier, A. R. W. Hughes, L. G. Blomberg, P. R. Sutcliffe
To cite this version:
A. B. Collier, A. R. W. Hughes, L. G. Blomberg, P. R. Sutcliffe. Evidence of standing waves during
a Pi2 pulsation event observed on Cluster. Annales Geophysicae, European Geosciences Union, 2006,
24 (10), pp.2719-2733. �hal-00318191�
Ann. Geophys., 24, 2719–2733, 2006 www.ann-geophys.net/24/2719/2006/ © European Geosciences Union 2006
Annales
Geophysicae
Evidence of standing waves during a Pi2 pulsation event observed
on Cluster
A. B. Collier1,2, A. R. W. Hughes1, L. G. Blomberg2, and P. R. Sutcliffe3
1School of Physics, University of KwaZulu-Natal, Durban, South Africa
2Dept. of Space and Plasma Physics, School of Electrical Engineering, Royal Institute of Technology, Stockholm, Sweden 3Hermanus Magnetic Observatory, Hermanus, South Africa
Received: 11 April 2006 – Revised: 16 August 2006 – Accepted: 31 August 2006 – Published: 20 October 2006
Abstract. Observations of Pi2 pulsations at middle and low
latitudes have been explained in terms of cavity mode reso-nances, whereas transients associated with field-aligned cur-rents appear to be responsible for the high latitude Pi2 signa-ture.
Data from Cluster are used to study a Pi2 event observed at 18:09 UTC on 21 January 2003, when three of the satellites were within the plasmasphere (L=4.7, 4.5 and 4.6) while the fourth was on the plasmapause or in the plasmatrough (L=6.6). Simultaneous pulsations at ground observatories and the injection of particles at geosynchronous orbit cor-roborate the occurrence of a substorm.
Evidence of a cavity mode resonance is established by considering the phase relationship between the orthogonal electric and magnetic field components associated with ra-dial and field-aligned standing waves. The relative phase between satellites located on either side of the geomagnetic equator indicates that the field-aligned oscillation is an odd harmonic. Finite azimuthal Poynting flux suggests that the cavity is effectively open ended and the azimuthal wave num-ber is estimated as m∼13.5.
Keywords. Magnetospheric physics (MHD waves and
in-stabilities; Plasmasphere; Storms and substorms)
1 Introduction
Pi2 pulsations are damped Ultra Low Frequency (ULF) waves generally characterised by an abrupt commencement followed by a decay in amplitude which typically only en-dures for a few cycles. Categorised as irregular pulsations (Jacobs et al., 1964), Pi2 have periods between 40 and 150 s. Some Pi2 are unequivocally the result of the onset or inten-sification of the substorm expansion phase (e.g., Rostoker, Correspondence to: A. B. Collier
1967a), while others have been recorded during periods with-out substorm activity (Sutcliffe, 1998; Kim et al., 2005).
Pi2 are most frequently observed close to the midnight meridian between 20:00 and 24:00 LT (Sutcliffe, 1975). Maximum amplitudes are found in the auroral zone (Aka-sofu, 1968; Saito, 1969), while a secondary amplitude peak has been noted in the vicinity of the plasmapause (Gupta and Stening, 1971; Stuart, 1974; Saito et al., 1976).
The characteristics of Pi2 pulsations observed at high lat-itudes are quite distinct from those at middle and low lati-tudes, and it is thus commonly believed that they are gen-erated by different mechanisms (Gupta and Stening, 1971; Olson, 1999). While the pulsations are well defined at lower latitudes, closer to the poles they are irregular and complex, contaminated by a pronounced level of background noise, particularly in the Pi1 band (Stuart and Booth, 1974; Ros-toker and Olson, 1978; Southwood and Stuart, 1980). Yeo-man et al. (1991) showed that Pi2 are predominantly trans-verse at auroral latitudes and compressional at lower lati-tudes. At high latitudes Pi2 are encountered exclusively in a limited range of local times around magnetic midnight corre-sponding roughly to the extent of the substorm current wedge (Singer et al., 1983). At middle and low latitudes they are found simultaneously, with similar frequency spectra, at es-sentially all local times (Sutcliffe and Yumoto, 1989, 1991). Although Pi2 pulsations on the dayside are often obscured by signals from other sources, numerous observations of day-side Pi2 have been made over a range of latitudes straddling the geomagnetic equator (Stuart and Barsczus, 1980; Sut-cliffe and Yumoto, 1989, 1991). The detection of Pi2 on the dayside, when their source is clearly around midnight, im-plies the involvement of fast mode waves propagating across the ambient magnetic field.
Pi2 are produced during the expansion phase onset by the rapid reconfiguration of the magnetotail (Shiokawa et al., 1998). The induced azimuthal electric field resulting from the dipolarisation of distended magnetic field lines in the tail
2720 A. B. Collier et al.: Pi2 on Cluster causes high-speed earthward E×B flow. The flow is
decel-erated and diverted when it encounters the boundary between dipolar and tail-like magnetic field lines, leading to the for-mation of the substorm current wedge (SCW). The transients associated with the initiation of and subsequent fluctuations in the field-aligned currents may lead to the high-latitude Pi2 signature (Sakurai and McPherron, 1983; Baumjohann and Glaßmeier, 1984). Compressional waves generated by the impact of the injected plasmasheet particles on dipolar mag-netic field lines propagate across the field lines into the inner magnetosphere where they cause Pi2 at lower latitudes.
Observations of Pi2 over a range of middle and low lati-tudes often display one or several discrete frequencies. These uniform spectral features have been attributed to transient surface waves propagating on the plasmapause (Sutcliffe, 1975; Southwood and Stuart, 1980), or temporal fluctuations of bursty bulk flows with similar spectral content (Kepko and Kivelson, 1999). However, the most established explanation invokes cavity or fast mode resonances (FMRs), which are compressional waves trapped in cavities formed within the magnetosphere (Lin et al., 1991; Sutcliffe and Yumoto, 1991; Takahashi et al., 1995; Allan et al., 1996; Pekrides et al., 1997).
In principle the magnetosphere can be represented by a pair of coupled cavities separated by the plasmapause (Al-lan et al., 1986; Zhu and Kivelson, 1989). The inner radial boundary arises from the Alfv´en speed gradient, while the outer boundary occurs at the magnetopause. The substorm plasma injection front may also establish a boundary on the nightside (Lin et al., 1991). Although the source of fast mode waves may be impulsive and broadband, discrete frequencies are selected which match the eigenfrequencies of the cav-ities. The spectrum of resonant cavity mode waves there-fore corresponds to those frequencies for which a standing wave may form between the inner and outer radial bound-aries. Since these resonant frequencies are determined by the geometry of the cavity as a whole, they do not vary with L.
Although the magnetosphere is closed on the dayside, it is elongated in the antisunward direction to form the magne-totail. This asymmetrical azimuthal geometry is more remi-niscent of a waveguide or open-ended cavity (Walker et al., 1992). Waters et al. (2002) observed that the formation of ra-dial resonant structures is more likely on the dayside, where reflection occurs at the magnetopause, whereas on the night-side the lack of a well defined boundary outnight-side the plasma-pause may preclude the occurrence of outer cavity modes, and FMRs may simply be confined within the plasmasphere. The numerical results of Lee (1996) indicate that plasma-spheric cavity modes may exist in the absence of an outer magnetospheric boundary. However, they caution that since the boundary presented by the plasmapause has only finite width, energy can tunnel through it into the outer magneto-sphere. The eigenfrequencies of the fundamental and second harmonic plasmaspheric cavity modes are in the intervals 10 to 15 mHz and 26 to 28 mHz respectively (Lee, 1998).
The high coherence observed between compressional os-cillations in the plasmasphere and at low latitudes on the ground supports the plasmaspheric origin of low latitude Pi2 pulsations (Takahashi et al., 1995, 2003). The observed in-crease of the average Pi2 frequency with geomagnetic activ-ity (Rostoker, 1967b) also substantiates the cavactiv-ity resonance model: during periods of enhanced activity the size of the plasmasphere is reduced and the cavity mode frequencies are thus elevated (Takahashi et al., 2003).
Beyond the limits of the cavity the compressional mode decays exponentially but may still couple to the toroidal mode to form field line resonances (FLRs). Pi2 polarisa-tion displays a pronounced variapolarisa-tion with latitude (Fukun-ishi, 1975). The latitude at which the sense of polarisation reverses coincides with a maximum in the toroidal mode am-plitude (Samson et al., 1971; Lanzerotti et al., 1974). This suggests that the maximum is associated with a FLR. Taka-hashi et al. (1995) failed to find evidence of FLRs during Pi2 at L<5, but Keiling et al. (2001) were able to identify a pair of Pi2 events with FLR signatures.
2 Instrumentation, data and analysis
The Cluster constellation of four satellites (Escoubet et al., 2001) was launched during the year 2000 into a nearly po-lar orbit with inclination ∼88.5◦, apogee 19.4 R
E, perigee
4.2 REand eccentricity 0.64. The orbit has a period of 57.1 h,
of which an average of only 100 min are spent in the inner magnetosphere (L<6). Critically, under moderate geomag-netic conditions, the orbit regularly brings the satellites into the plasmasphere. Around 25% of the forays into the plas-masphere occur between local times of 21:00 and 03:00.
The orientation of the Cluster orbital plane remains fixed in inertial space. Consequently the local time of perigee varies with the season, proceeding from noon on 2 Septem-ber to midnight on 30 April. Since Pi2 are most clearly ob-served at low invariant latitudes around midnight, the most favourable period for identifying these events on Cluster is during the northern hemisphere winter. The search for Pi2 events was therefore focused on intervals during this period when the constellation was at low L on the nightside. Sev-eral events were identified, but too few for a reasonable sta-tistical appraisal. An intriguing instance, during which only three of the satellites were located within the plasmasphere, is presented here as a case study. Three other promising events were also considered in detail and will be discussed in a forthcoming publication.
Pulsation data were obtained from the Electric Field and Wave (EFW) (Gustafsson et al., 1997) and Fluxgate Magnetometer (FGM) (Balogh et al., 1997) instruments on Cluster. The EFW experiment has two pairs of spherical probes, each sensor deployed at the end of a wire boom in the spin plane of the satellite. The FGM instrument is
A. B. Collier et al.: Pi2 on Cluster 2721 a tri-axial fluxgate magnetometer measuring the complete
magnetic field vector.
The Cluster electric and magnetic field data are originally presented in Geocentric Solar Ecliptic (GSE) coordinates. The spin axes of the satellites are perpendicular to the GSE
X−Y plane, and the spin period is 4 s. The spin-averaged data therefore have a nominal sampling rate of 250 mHz. The resulting Nyquist frequency of 125 mHz is quite adequate for the phenomena under consideration. Since the time series from the four satellites are not synchronised, the data were linearly interpolated onto a common time base.
The EFW instrument only supplies data for the two com-ponents of the electric field in the spin plane of the satellite, which is effectively the ecliptic plane. However, the MHD condition which precludes the existence of an electric field parallel to the ambient magnetic field may be applied to es-timate the third component. This procedure is only reliable when the magnetic field does not lie too close to the ecliptic plane, and in practice is only applied when it is inclined at an angle of at least 10◦above or below the ecliptic.
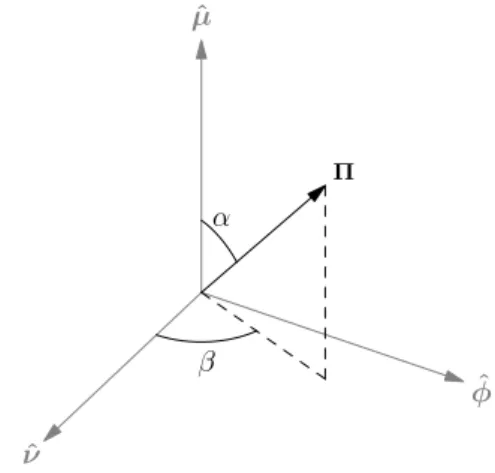
The analysis of ULF pulsation data in space is conve-niently undertaken in the mean field-aligned (MFA) coordi-nate system (ν, φ, µ), for which ˆµ is parallel to the mean
background magnetic field, ˆφ is directed azimuthally
east-ward, and ˆν, which completes the right-handed orthogonal triplet, is perpendicular to the field line pointing outward. The unit vectors are defined as ˆµ=B/|B|, ˆφ= ˆµ×r/| ˆµ×r|,
where r is the geocentric position vector, and ˆν= ˆφ× ˆµ.
The background magnetic field used to effect the transfor-mation to MFA coordinates is calculated as a 20 min run-ning average of the FGM data. Conversion therefore re-moves all perturbations with periods greater than 1200 s. In the MFA coordinate system the magnetic field perturbation consists of the compressional, bµ, radially transverse, bν,
and azimuthally transverse, bφ, components. The bµand bν
components constitute the poloidal mode, while the toroidal mode only involves bφ.
A significant advantage of wave studies carried out with multiple satellites is the ability to discern the spatial and tem-poral components of an oscillation. Such an analysis is con-veniently performed in the frequency domain. In order to obtain a reliable estimate of the phase difference between a wave at two distinct locations, or indeed between two compo-nents of a wave at a single location, one should first establish whether the two waveforms have a stable phase relationship. This may be assessed from the coherence spectrum,
γ2= |Sij|
2
SiiSjj
, (1)
where Sii and Sjj are the power spectral densities of the
two waveforms, and Sij is the cross-power spectral density
(CPSD) (Paschmann and Daly, 1998). The coherence ex-presses the correlation between the two signals as a function of frequency. It can be shown that 0≤γ ≤1, where an
appre-ciable value for γ indicates that the two signals have a con-sistent phase relationship and correspond to an ordered wave rather than simply arising from stochastic noise. A coher-ence threshold of 75% was imposed in this analysis. For fre-quencies where γ exceeds this threshold the phase difference between the waveforms may be reliably determined from the ratio of the imaginary and real parts of Sij,
tan δ = ={Sij}
<{Sij}
. (2)
When the phase difference is averaged over a range of fre-quencies, only those frequencies which surpass the coher-ence threshold are considered and the magnitude of Sij is
used as a weighting factor. The notation δ(· , ·) is used to indicate the phase difference between two waveforms, where the first argument specifies the reference waveform. For ex-ample, δ(Eφ, bµ)designates the phase of bµrelative to Eφ.
The fact that Pi2 pulsations are transient phenomena is not strictly conducive to the application of the spectral tech-niques described above, which present an average over the time interval to which they are applied. A more appropriate technique involves the use of complex demodulation to de-termine the instantaneous amplitude and phase of the signals. The waveforms are first filtered over the Pi2 band before the analytical signal is calculated. This facilitates the estimation of instantaneous cross-spectral parameters (Webb, 1979).
3 Event description
On 21 January 2003 the expansion phase of a substorm com-menced at approximately 18:09 UTC. The beginning of the associated Pi2 pulsation envelope observed on the ground was taken to be the onset time.
3.1 Auxiliary data
Los Alamos National Laboratory (LANL) geostationary electron flux data are presented in Fig. 1. The nominal sub-storm onset time is identified in this and all subsequent plots by a vertical grey line. A dramatic enhancement of the elec-tron flux at the satellite situated closest to midnight, LANL-97A, occurs shortly after substorm onset. The dispersionless injection of plasma into the nightside inner magnetosphere is an acknowledged signature of the substorm expansion phase (McIlwain, 1974). The injected electrons are subsequently detected with progressively greater dispersion by satellites located at later local times. Fluctuations in the flux measured at 1990-095, located near the dusk meridian, occur roughly 30 min after the injection. These oscillations have a period of around 250 s, which places them in the Pc5 range. Their oc-currence corresponds to the arrival of the injected electrons at 1991-080, situated around dawn. It is thus possible that the fluctuations are produced by the drift-bounce resonance instability associated with velocity-dispersed ions injected
2722 A. B. Collier et al.: Pi2 on Cluster
4 A. B. Collier et al.: Pi2 on Cluster
16:00 16:30 17:00 17:30 18:00 18:30 19:00 19:30 20:00 20:30 21:00 UT 102 103 104 105 106 107 1990-095 102 103 104 105 106 107 1991-080 102 103 104 105 106 107 1994-084 102 103 104 105 106 107 LANL-97A fl u x ˆ cm − 2s − 1sr − 1k eV − 1 ˜
Fig. 1: Electron flux data for 21 January 2003 from SOPA instruments on LANL geosynchronous satellites. The four traces in each panel represent different energy chan-nels; from top to bottom they are 50–75, 75–105, 105– 150 and 150–225 keV. In the upper right corner of each
panel is an inset indicating the local time of the satellite at the event epoch (the arrow points sunward).
sured at 1990-095, located near the dusk meridian, oc-cur roughly30 min after the injection. These oscillations
have a period of around250 s, which places them in the
Pc5 range. Their occurrence corresponds to the arrival of the injected electrons at 1991-080, situated around dawn. It is thus possible that the fluctuations are produced by the drift-bounce resonance instability associated with velocity-dispersed ions injected during the substorm on-set, and which would have reached 1990-095 at about this time (Glassmeier et al., 1999). Unfortunately no pro-ton flux data are available for this period on 1990-095 to confirm or refute this proposition.
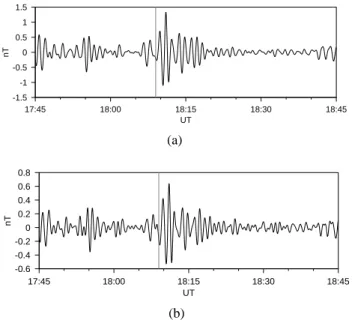
The magnetic perturbations at two northern hemisphere ground stations, Yinchuan (38.5◦N 106.3◦E GEO,L =
1.43) and Kakioka (36.2◦N 140.2◦E GEO,L = 1.32),
are plotted in Figure 2. At the time of the event the local times at these two stations were 01:14 and 03:29 respec-tively. They were thus well situated for the observation of Pi2 pulsations. At both locations Pi2 activity was initiated by a strong impulse at 18:09 UTC.
3.2 Cluster Data
At the moment of substorm onset Cluster’s centroid was below the geomagnetic equatorial plane in the midnight-dawn quadrant (02:40 MLT) at a geocentric distance of
4.4 RE. Table 1 presents the GSE coordinates,
McIl-wain’s (1961)L parameter, magnetic latitude, magnetic
local time and relationship to the plasmasphere for each of the satellites during the event. The constellation as-sumed a sparse configuration with a mean separation of
9900 km. Whereas C1, C2 and C4 were situated at L < 5,
C3 was atL = 6.6. C3 was moving towards lower L,
while the rest were close to perigee. Furthermore, while C3 was at a relatively high magnetic latitude, the remain-ing satellites were at lowerλ, with C1 and C2 closely
bracketing the magnetic equatorial plane. The entire con-stellation was moving northward.
Entry into the plasmasphere may be gauged by refer-ence to the EFW probe potential, as well as by consulting the RAPID omnidirectional electron flux and CIS proton density, although the latter instruments are saturated in the radiation belts and the data are thus contaminated (H. R`eme, personal communication, 2006). EFW probe po-tential, plotted in Figure 3, provides an indication of the plasma density in the vicinity of the satellites. Prior to around 12:00 UTC the constellation was located outside the magnetosphere on the dayside, which accounts for the elevated potential produced by the heightened density of the solar wind plasma. At the time of the event all satel-lites except C3 had already entered the plasmasphere. The potential on C3 was still growing during the event, indi-cating that it was likely to have been in the plasmatrough or in the process of traversing the plasmapause. Entry and exit from the plasmasphere are most apparent on C1 and C2. The Active Spacecraft Potential Control (ASPOC) was activated at 20:00 and 19:30 UTC on C3 and C4 re-spectively, which conceals their exit from the plasmas-phere.
The filtered Cluster electric and magnetic field wave-form data are plotted in Figure 4. The data were bandpass filtered over the Pi2 period range. The filter was applied in both the forward and reverse directions to remediate phase distortion. The interval used later for spectral anal-ysis is delimited by vertical dashed lines. Electric field
Table 1: Location of the Cluster satellites during the event on 21 January 2003, given in Cartesian GSE coordi-nates [distances measured in Earth radii,RE], McIlwain’s
(1961) parameter, magnetic latitude (λ) and magnetic
lo-cal time (MLT). Positions were transformed from GSE to SM coordinates and a centred dipole magnetic field was assumed when calculatingL, λ and MLT. The position
of each satellite with respect to the plasmasphere is in-dicated symbolically (× = inside plasmasphere; | = on
plasmapause;◦ = outside plasmasphere).
X Y Z L P/S λ MLT C1 -3.606 -3.023 0.371 4.7 × 1.9◦ 02:38
C2 -3.318 -2.932 -0.253 4.5 × -5.9◦ 02:34
C3 -2.475 -3.305 -2.168 6.6 ◦ -32.7◦ 02:44
C4 -2.759 -2.991 -0.944 4.6 × -17.0◦ 02:43 Fig. 1. Electron flux data for 21 January 2003 from Synchronous
Orbit Particle Analyzer (SOPA) instruments on LANL geosyn-chronous satellites. The four traces in each panel represent different energy channels; from top to bottom they are 50–75, 75–105, 105– 150 and 150–225 keV. In the upper right corner of each panel is an inset indicating the local time of the satellite at the event epoch (the arrow points sunward).
during the substorm onset, and which would have reached 1990-095 at about this time (Glassmeier et al., 1999). Un-fortunately no proton flux data are available for this period on 1990-095 to confirm or refute this proposition.
The magnetic perturbations at two northern hemisphere ground stations, Yinchuan (38.5◦N 106.3◦E GEO, L=1.43) and Kakioka (36.2◦N 140.2◦E GEO, L=1.32), are plotted in Fig. 2. At the time of the event the local times at these two stations were 01:14 and 03:29 respectively. They were thus well situated for the observation of Pi2 pulsations. At both locations Pi2 activity was initiated by a strong impulse at 18:09 UTC.
3.2 Cluster data
At the moment of substorm onset Cluster’s centroid was be-low the geomagnetic equatorial plane in the midnight-dawn quadrant (02:40 MLT) at a geocentric distance of 4.4 RE.
Table 1 presents the GSE coordinates, McIlwain’s (1961) L parameter, magnetic latitude, magnetic local time and rela-tionship to the plasmasphere for each of the satellites during the event. The constellation assumed a sparse configuration with a mean separation of 9900 km. Whereas C1, C2 and C4 were situated at L<5, C3 was at L=6.6. C3 was mov-ing towards lower L, while the rest were close to perigee.
A. B. Collier et al.: Pi2 on Cluster 5
17:45 18:00 18:15 18:30 18:45 UT -1.5 -1 -0.5 0 0.5 1 1.5 nT (a) 17:45 18:00 18:15 18:30 18:45 UT -0.6 -0.4 -0.2 0 0.2 0.4 0.6 0.8 nT (b)
Fig. 2: Perturbations in theH component of the magnetic field at ground stations (a) Yinchuan [YCB] and (b) Kakioka
[KAK]. The waveforms are bandpass filtered over the Pi2 frequency range.
0 2 4 6 8 10 12 14 16 18 20 22 24 UT -30 -20 -10 0 C1 -30 -20 -10 0 C2 -30 -20 -10 0 C3 -30 -20 -10 0 C4 V
Fig. 3: EFW probe potential on 21 January 2003.
data are not available in MFA coordinates for C3 during the event since the background magnetic field direction was passing through the spin plane of the satellite. Clear Pi2 pulsations with comparable amplitudes are evident on C1, C2 and C4. The pulsations appear to be divided into two distinct packets, the first of which has both larger am-plitude and longer duration. These packets are also appar-ent in the ground data presappar-ented in Figure 2. This struc-ture suggests either two distinct Pi2 events or the beating of two closely spaced frequencies. On C1 the magnetic perturbation is confined to the compressional component, with peak amplitude 0.2 nT, while C2 and C4
experi-ence significant toroidal oscillations, with peaks inbφof
0.5 nT and 1.1 nT respectively. The variation of the
elec-tric field is predominantly inEν, with a peak amplitude of around2.2 mV/m on all three satellites within the
plas-masphere. The dominance ofEν implies either a com-pressional mode propagating azimuthally or a transverse mode propagating along the magnetic field. The wave-forms represent a transition between poloidal and toroidal modes: whereas at C1 the wave is principally compres-sional, at C4 the azimuthal component is prevalent; at C2 waves of comparable amplitude are present in both toroidal and poloidal components.
Although pulsation activity certainly exists at C3, its
onset precedes the activity at the other satellites and its form is highly irregular, quite distinct from the symmet-ric envelopes on the remaining satellites. It is reasonable to conclude that the dynamics of the Pi2, if observed on C3, differ significantly from those on the other spacecraft. One cannot, however, exclude the possibility that other waves with similar spectral content mask the event at C3. During the15 min prior to the start of the event C3
tra-versed an earthward field-aligned current system, which produced a characteristic dipolar signature in the absolute FGM data. The perturbations reflected in Figure 4c may in part be due to these field-aligned currents.
Despite the dominance of the toroidal component at C3, some level of coupling to the poloidal mode must oc-cur since such high latitude pulsations should havem 6= 0
in order to be confined to the longitudinal extent of the SCW. Consideration of the instantaneous cross-power spectral density data for the Pi2 band plotted in Figure 5 indicates that there is a high degree of correlation between the meridional and azimuthal magnetic field oscillations during the event, while there is less coherent activity ei-ther before or after this period. This suggests that some pulsation activity at C3 is indeed associated with the sub-storm. The coherent oscillations inbφ andbν, where the former has a substantially larger amplitude, is suggestive of a FLR, where the compressional oscillation excites a resonant response and feeds power into the transverse os-cillation (Chen and Hasegawa, 1974). Moreover, since C3 is located atL = 6.6, it lies on a field line which maps
down to the auroral zone, where the elevated ionospheric conductivity is conducive to the formation of a FLR. The relative phase is somewhat erratic during the event, sug-gestive of a bursty process with numerous phase skips. This irregularity is also reflected in the amplitude of the CPSD.
The observations described above are similar to the measurements of Kim et al. (2001), who found Pi2 events identified by compressional oscillations within the plas-masphere and transverse oscillations at geosynchronous orbit. Osaki et al. (1998) contended that the compres-sional component of Pi2 within the plasmasphere may be limited to magnetic latitudes|λ| . 20◦, however, the lo-cations of the Cluster satellites during the event on 21
Jan-A. B. Collier et al.: Pi2 on Cluster 5
17:45 18:00 18:15 18:30 18:45 UT -1.5 -1 -0.5 0 0.5 1 1.5 nT (a) 17:45 18:00 18:15 18:30 18:45 UT -0.6 -0.4 -0.2 0 0.2 0.4 0.6 0.8 nT (b)
Fig. 2: Perturbations in theH component of the magnetic field at ground stations (a) Yinchuan [YCB] and (b) Kakioka
[KAK]. The waveforms are bandpass filtered over the Pi2 frequency range.
0 2 4 6 8 10 12 14 16 18 20 22 24 UT -30 -20 -10 0 C1 -30 -20 -10 0 C2 -30 -20 -10 0 C3 -30 -20 -10 0 C4 V
Fig. 3: EFW probe potential on 21 January 2003.
data are not available in MFA coordinates for C3 during the event since the background magnetic field direction was passing through the spin plane of the satellite. Clear Pi2 pulsations with comparable amplitudes are evident on C1, C2 and C4. The pulsations appear to be divided into two distinct packets, the first of which has both larger am-plitude and longer duration. These packets are also appar-ent in the ground data presappar-ented in Figure 2. This struc-ture suggests either two distinct Pi2 events or the beating of two closely spaced frequencies. On C1 the magnetic perturbation is confined to the compressional component, with peak amplitude 0.2 nT, while C2 and C4
experi-ence significant toroidal oscillations, with peaks inbφof
0.5 nT and 1.1 nT respectively. The variation of the
elec-tric field is predominantly inEν, with a peak amplitude of around2.2 mV/m on all three satellites within the
plas-masphere. The dominance of Eν implies either a com-pressional mode propagating azimuthally or a transverse mode propagating along the magnetic field. The wave-forms represent a transition between poloidal and toroidal modes: whereas at C1 the wave is principally compres-sional, at C4 the azimuthal component is prevalent; at C2 waves of comparable amplitude are present in both toroidal and poloidal components.
Although pulsation activity certainly exists at C3, its
onset precedes the activity at the other satellites and its form is highly irregular, quite distinct from the symmet-ric envelopes on the remaining satellites. It is reasonable to conclude that the dynamics of the Pi2, if observed on C3, differ significantly from those on the other spacecraft. One cannot, however, exclude the possibility that other waves with similar spectral content mask the event at C3. During the15 min prior to the start of the event C3
tra-versed an earthward field-aligned current system, which produced a characteristic dipolar signature in the absolute FGM data. The perturbations reflected in Figure 4c may in part be due to these field-aligned currents.
Despite the dominance of the toroidal component at C3, some level of coupling to the poloidal mode must oc-cur since such high latitude pulsations should havem 6= 0
in order to be confined to the longitudinal extent of the SCW. Consideration of the instantaneous cross-power spectral density data for the Pi2 band plotted in Figure 5 indicates that there is a high degree of correlation between the meridional and azimuthal magnetic field oscillations during the event, while there is less coherent activity ei-ther before or after this period. This suggests that some pulsation activity at C3 is indeed associated with the sub-storm. The coherent oscillations inbφ andbν, where the former has a substantially larger amplitude, is suggestive of a FLR, where the compressional oscillation excites a resonant response and feeds power into the transverse os-cillation (Chen and Hasegawa, 1974). Moreover, since C3 is located atL = 6.6, it lies on a field line which maps
down to the auroral zone, where the elevated ionospheric conductivity is conducive to the formation of a FLR. The relative phase is somewhat erratic during the event, sug-gestive of a bursty process with numerous phase skips. This irregularity is also reflected in the amplitude of the CPSD.
The observations described above are similar to the measurements of Kim et al. (2001), who found Pi2 events identified by compressional oscillations within the plas-masphere and transverse oscillations at geosynchronous orbit. Osaki et al. (1998) contended that the compres-sional component of Pi2 within the plasmasphere may be limited to magnetic latitudes|λ| . 20◦, however, the lo-cations of the Cluster satellites during the event on 21
Jan-Fig. 2. Perturbations in the H component of the magnetic field at
ground stations (a) Yinchuan [YCB] and (b) Kakioka [KAK]. The waveforms are bandpass filtered over the Pi2 frequency range.
Table 1. Location of the Cluster satellites during the event on
21 January 2003, given in Cartesian GSE coordinates [distances measured in Earth radii, RE], McIlwain’s (1961) parameter,
mag-netic latitude (λ) and magmag-netic local time (MLT). Positions were transformed from GSE to Solar Magnetic (SM) coordinates and a centred dipole magnetic field was assumed when calculating L, λ and MLT. The position of each satellite with respect to the plas-masphere is indicated symbolically (×= inside plasplas-masphere; |= on plasmapause; ◦= outside plasmasphere).
X Y Z L P/S λ MLT C1 –3.606 –3.023 0.371 4.7 × 1.9◦ 02:38 C2 –3.318 –2.932 –0.253 4.5 × –5.9◦ 02:34 C3 –2.475 –3.305 –2.168 6.6 ◦ –32.7◦ 02:44 C4 –2.759 –2.991 –0.944 4.6 × –17.0◦ 02:43
Furthermore, while C3 was at a relatively high magnetic lati-tude, the remaining satellites were at lower λ, with C1 and C2 closely bracketing the magnetic equatorial plane. The entire constellation was moving northward.
Entry into the plasmasphere may be gauged by reference to the EFW probe potential, as well as by consulting the RAPID omnidirectional electron flux and CIS proton den-sity, although the latter instruments are saturated in the ra-diation belts and the data are thus contaminated (H. R`eme, personal communication, 2006). EFW probe potential, plot-ted in Fig. 3, provides an indication of the plasma density in the vicinity of the satellites. Prior to around 12:00 UTC the
A. B. Collier et al.: Pi2 on Cluster 2723 constellation was located outside the magnetosphere on the
dayside, which accounts for the elevated potential produced by the heightened density of the solar wind plasma. At the time of the event all satellites except C3 had already entered the plasmasphere. The potential on C3 was still growing dur-ing the event, indicatdur-ing that it was likely to have been in the plasmatrough or in the process of traversing the plasma-pause. Entry and exit from the plasmasphere are most appar-ent on C1 and C2. The Active Spacecraft Potappar-ential Control (ASPOC) was activated at 20:00 and 19:30 UTC on C3 and C4 respectively, which conceals their exit from the plasmas-phere.
The filtered Cluster electric and magnetic field waveform data are plotted in Fig. 4. The data were bandpass filtered over the Pi2 period range. The filter was applied in both the forward and reverse directions to remediate phase distor-tion. The interval used later for spectral analysis is delimited by vertical dashed lines. Electric field data are not available in MFA coordinates for C3 during the event since the back-ground magnetic field direction was passing through the spin plane of the satellite. Clear Pi2 pulsations with comparable amplitudes are evident on C1, C2 and C4. The pulsations ap-pear to be divided into two distinct packets, the first of which has both larger amplitude and longer duration. These pack-ets are also apparent in the ground data presented in Fig. 2. This structure suggests either two distinct Pi2 events or the beating of two closely spaced frequencies. On C1 the mag-netic perturbation is confined to the compressional compo-nent, with peak amplitude 0.2 nT, while C2 and C4 expe-rience significant toroidal oscillations, with peaks in bφ of
0.5 nT and 1.1 nT, respectively. The variation of the elec-tric field is predominantly in Eν, with a peak amplitude of
around 2.2 mV/m on all three satellites within the plasmas-phere. The dominance of Eν implies either a compressional
mode propagating azimuthally or a transverse mode propa-gating along the magnetic field. The waveforms represent a transition between poloidal and toroidal modes: whereas at C1 the wave is principally compressional, at C4 the az-imuthal component is prevalent; at C2 waves of comparable amplitude are present in both toroidal and poloidal compo-nents.
Although pulsation activity certainly exists at C3, its on-set precedes the activity at the other satellites and its form is highly irregular, quite distinct from the symmetric en-velopes on the remaining satellites. It is reasonable to con-clude that the dynamics of the Pi2, if observed on C3, differ significantly from those on the other spacecraft. One can-not, however, exclude the possibility that other waves with similar spectral content mask the event at C3. During the 15 min prior to the start of the event C3 traversed an earth-ward field-aligned current system, which produced a char-acteristic dipolar signature in the absolute FGM data. The perturbations reflected in Fig. 4c may in part be due to these field-aligned currents.
A. B. Collier et al.: Pi2 on Cluster 5
17:45 18:00 18:15 18:30 18:45 UT -1.5 -1 -0.5 0 0.5 1 1.5 nT (a) 17:45 18:00 18:15 18:30 18:45 UT -0.6 -0.4 -0.2 0 0.2 0.4 0.6 0.8 nT (b)
Fig. 2: Perturbations in theH component of the magnetic field at ground stations (a) Yinchuan [YCB] and (b) Kakioka
[KAK]. The waveforms are bandpass filtered over the Pi2 frequency range.
0 2 4 6 8 10 12 14 16 18 20 22 24 UT -30 -20 -10 0 C1 -30 -20 -10 0 C2 -30 -20 -10 0 C3 -30 -20 -10 0 C4 V
Fig. 3: EFW probe potential on 21 January 2003.
data are not available in MFA coordinates for C3 during the event since the background magnetic field direction was passing through the spin plane of the satellite. Clear Pi2 pulsations with comparable amplitudes are evident on C1, C2 and C4. The pulsations appear to be divided into two distinct packets, the first of which has both larger am-plitude and longer duration. These packets are also appar-ent in the ground data presappar-ented in Figure 2. This struc-ture suggests either two distinct Pi2 events or the beating of two closely spaced frequencies. On C1 the magnetic perturbation is confined to the compressional component, with peak amplitude 0.2 nT, while C2 and C4
experi-ence significant toroidal oscillations, with peaks inbφof
0.5 nT and 1.1 nT respectively. The variation of the
elec-tric field is predominantly inEν, with a peak amplitude of around2.2 mV/m on all three satellites within the
plas-masphere. The dominance ofEν implies either a com-pressional mode propagating azimuthally or a transverse mode propagating along the magnetic field. The wave-forms represent a transition between poloidal and toroidal modes: whereas at C1 the wave is principally compres-sional, at C4 the azimuthal component is prevalent; at C2 waves of comparable amplitude are present in both toroidal and poloidal components.
Although pulsation activity certainly exists at C3, its
onset precedes the activity at the other satellites and its form is highly irregular, quite distinct from the symmet-ric envelopes on the remaining satellites. It is reasonable to conclude that the dynamics of the Pi2, if observed on C3, differ significantly from those on the other spacecraft. One cannot, however, exclude the possibility that other waves with similar spectral content mask the event at C3. During the15 min prior to the start of the event C3
tra-versed an earthward field-aligned current system, which produced a characteristic dipolar signature in the absolute FGM data. The perturbations reflected in Figure 4c may in part be due to these field-aligned currents.
Despite the dominance of the toroidal component at C3, some level of coupling to the poloidal mode must oc-cur since such high latitude pulsations should havem 6= 0
in order to be confined to the longitudinal extent of the SCW. Consideration of the instantaneous cross-power spectral density data for the Pi2 band plotted in Figure 5 indicates that there is a high degree of correlation between the meridional and azimuthal magnetic field oscillations during the event, while there is less coherent activity ei-ther before or after this period. This suggests that some pulsation activity at C3 is indeed associated with the sub-storm. The coherent oscillations inbφandbν, where the former has a substantially larger amplitude, is suggestive of a FLR, where the compressional oscillation excites a resonant response and feeds power into the transverse os-cillation (Chen and Hasegawa, 1974). Moreover, since C3 is located atL = 6.6, it lies on a field line which maps
down to the auroral zone, where the elevated ionospheric conductivity is conducive to the formation of a FLR. The relative phase is somewhat erratic during the event, sug-gestive of a bursty process with numerous phase skips. This irregularity is also reflected in the amplitude of the CPSD.
The observations described above are similar to the measurements of Kim et al. (2001), who found Pi2 events identified by compressional oscillations within the plas-masphere and transverse oscillations at geosynchronous orbit. Osaki et al. (1998) contended that the compres-sional component of Pi2 within the plasmasphere may be limited to magnetic latitudes|λ| . 20◦, however, the lo-cations of the Cluster satellites during the event on 21
Jan-Fig. 3. EFW probe potential on 21 January 2003.
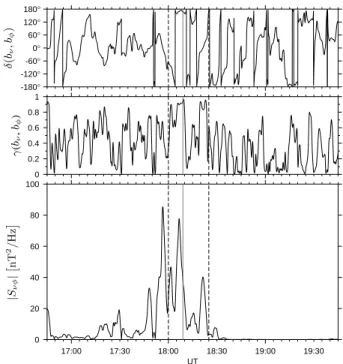
Despite the dominance of the toroidal component at C3, some level of coupling to the poloidal mode must occur since such high latitude pulsations should have m6=0 in order to be confined to the longitudinal extent of the SCW. Consider-ation of the instantaneous cross-power spectral density data for the Pi2 band plotted in Fig. 5 indicates that there is a high degree of correlation between the meridional and azimuthal magnetic field oscillations during the event, while there is less coherent activity either before or after this period. This suggests that some pulsation activity at C3 is indeed associ-ated with the substorm. The coherent oscillations in bφ and bν, where the former has a substantially larger amplitude, is
suggestive of a FLR, where the compressional oscillation ex-cites a resonant response and feeds power into the transverse oscillation (Chen and Hasegawa, 1974). Moreover, since C3 is located at L=6.6, it lies on a field line which maps down to the auroral zone, where the elevated ionospheric conduc-tivity is conducive to the formation of a FLR. The relative phase is somewhat erratic during the event, suggestive of a bursty process with numerous phase skips. This irregularity is also reflected in the amplitude of the CPSD.
The observations described above are similar to the mea-surements of Kim et al. (2001), who found Pi2 events iden-tified by compressional oscillations within the plasmasphere and transverse oscillations at geosynchronous orbit. Osaki et al. (1998) contended that the compressional component of Pi2 within the plasmasphere may be limited to magnetic lat-itudes |λ|. 20◦, however, the locations of the Cluster satel-lites during the event on 21 January 2003 preclude the eval-uation of this hypothesis.
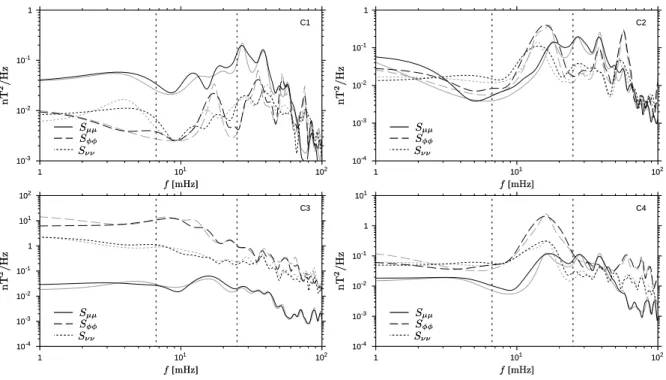
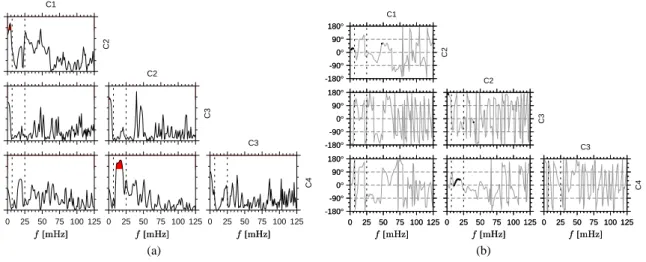
Figure 6 shows the magnetic field power spectral density (PSD) at each of the satellites. The PSD estimates were com-puted using Welch’s (1967) method. Data from the maxi-mum entropy method (MEM) are also included since these provide improved frequency resolution for a sample of fixed duration (Sutcliffe, 1974), and are used to determine the peak
2724 A. B. Collier et al.: Pi2 on Cluster
6 A. B. Collier et al.: Pi2 on Cluster
17:45 18:00 18:15 18:30 18:45 UT -0.5 0.0 0.5 17:45 18:00 18:15 18:30 18:45 UT -0.5 0.0 0.5 -0.5 0.0 0.5 -0.5 0.0 0.5 -0.5 0.0 0.5 -0.5 0.0 0.5 -4.0 0.0 4.0 -4.0 0.0 4.0 -4.0 0.0 4.0 -4.0 0.0 4.0 Eφ [mV / m] Eφ [mV / m] Eφ [mV / m] Eν [mV / m] Eν [mV / m] Eν [mV / m] bφ [n T ] bφ [n T ] bφ [n T ] bν [n T ] bν [n T ] bν [n T ] bµ [n T ] bµ [n T ] bµ [n T ] (a) 17:45 18:00 18:15 18:30 18:45 UT -1.0 0.0 1.0 17:45 18:00 18:15 18:30 18:45 UT -1.0 0.0 1.0 -1.0 0.0 1.0 -1.0 0.0 1.0 -1.0 0.0 1.0 -1.0 0.0 1.0 -4.0 0.0 4.0 -4.0 0.0 4.0 -4.0 0.0 4.0 -4.0 0.0 4.0 Eφ [mV / m] Eφ [mV / m] Eφ [mV / m] Eν [mV / m] Eν [mV / m] Eν [mV / m] bφ [n T ] bφ [n T ] bφ [n T ] bν [n T ] bν [n T ] bν [n T ] bµ [n T ] bµ [n T ] bµ [n T ] (b) 17:45 18:00 18:15 18:30 18:45 UT -5.0 0.0 5.0 17:45 18:00 18:15 18:30 18:45 UT -5.0 0.0 5.0 -5.0 0.0 5.0 -5.0 0.0 5.0 -5.0 0.0 5.0 -5.0 0.0 5.0 -4.0 0.0 4.0 -4.0 0.0 4.0 -4.0 0.0 4.0 -4.0 0.0 4.0 Eφ [mV / m] Eφ [mV / m] Eφ [mV / m] Eν [mV / m] Eν [mV / m] Eν [mV / m] bφ [n T ] bφ [n T ] bφ [n T ] bν [n T ] bν [n T ] bν [n T ] bµ [n T ] bµ [n T ] bµ [n T ] (c) 17:45 18:00 18:15 18:30 18:45 UT -1.5 0.0 1.5 17:45 18:00 18:15 18:30 18:45 UT -1.5 0.0 1.5 -1.5 0.0 1.5 -1.5 0.0 1.5 -1.5 0.0 1.5 -1.5 0.0 1.5 -4.0 0.0 4.0 -4.0 0.0 4.0 -4.0 0.0 4.0 -4.0 0.0 4.0 Eφ [mV / m] Eφ [mV / m] Eφ [mV / m] Eν [mV / m] Eν [mV / m] Eν [mV / m] bφ [n T ] bφ [n T ] bφ [n T ] bν [n T ] bν [n T ] bν [n T ] bµ [n T ] bµ [n T ] bµ [n T ] (d)
Fig. 4: EFW and FGM waveforms for 21 January 2003 on (a) C1 [Rumba], (b) C2 [Salsa], (c) C3 [Samba] and (d) C4 [Tango]. The signals have been bandpass filtered to extract periods in the range 40–150 s. The gaps in the EFW data
for C3 and C4 occur where it was not feasible to apply E · B = 0, and transformation of the electric field to MFA
coordinates was thus impossible.
uary 2003 preclude the evaluation of this hypothesis. Figure 6 shows the magnetic field power spectral density (PSD) at each of the satellites. The PSD estimates were computed using Welch’s (1967) method. Data from
the maximum entropy method (MEM) are also included since these provide improved frequency resolution for a sample of fixed duration (Sutcliffe, 1974), and are used to determine the peak frequencies. Since the spectral power
Fig. 4. EFW and FGM waveforms for 21 January 2003 on (a) C1 [Rumba], (b) C2 [Salsa], (c) C3 [Samba] and (d) C4 [Tango]. The signals
have been bandpass filtered to extract periods in the range 40–150 s. The gaps in the EFW data for C3 and C4 occur where it was not feasible to apply E·B=0, and transformation of the electric field to MFA coordinates was thus impossible.
A. B. Collier et al.: Pi2 on Cluster 2725 frequencies. Since the spectral power decreases rapidly with
frequency, the data have been pre-whitened by taking the first difference of the waveform. The spectral peaks for the azimuthal magnetic field on C1, C2 and C4 are at 17.2, 17.0 and 16.0 mHz respectively. The small differences in the fre-quencies of these peaks are probably not significant in view of the brief duration and damped form of the pulsations. The azimuthal spectrum at C3 is broadband with little evidence of preferred frequencies. This might appear to contradict the suggestion of a FLR at C3, but since the satellite is located near to the plasmapause it is exposed to a broad range of FLR frequencies, any or all of which may be excited. Olson and Rostoker (1975) found that spectra near the auroral electrojet were spread over a wide range of frequencies.
The compressional spectrum on C3 contains a peak at 15.5 mHz, but it is both wide and of low amplitude. On the other three satellites there is clear evidence of enhancement in Sµµat a sequence of discrete frequencies which are likely
to correspond to the fundamental and higher harmonics of a cavity mode resonance.
4 Discussion
Various aspects of the event are now examined in greater de-tail. Specifically, evidence for cavity mode and field line resonances is considered, the azimuthal wave number is es-timated, and the magnitude and orientation of the Poynting vector are discussed.
The normal modes of the magnetospheric cavity have both the meridional and field-aligned components of the wave vector quantised such that the total phase change along a re-turn path across the cavity in either the ν or µ direction is an integral multiple of 2π . Depending on whether the cavity is open or closed in the azimuthal direction (in the former case the waveguide description applies), the azimuthal wave number may either assume arbitrary values or be restricted to discrete allowed values. The existence of a waveguide mode may be verified by establishing that the waves are standing in both the radial and field-aligned directions. If, in addition, it can be shown that there is no azimuthal propagation, then the conditions for a closed cavity mode have been satisfied.
A wave propagating in the radial direction involves the azimuthal electric field and compressional magnetic field. A standing wave should be identified by δ(Eφ, bµ)=±90◦
(Chi and Russell, 1998; Takahashi et al., 2001; Waters et al., 2002), while δ(Eφ, bµ)=0◦ or ±180◦are consistent with a
travelling wave. Equivalently, the cosine of the phase differ-ence may be used, where cos δ=0 corresponds to a standing wave, while cos δ=±1 indicates a propagating wave. Fur-thermore, the parameter cos δ may also be used to estimate reflection coefficients (Potemra et al., 1989). Keiling et al. (2001) successfully applied these criteria to data from the Polar satellite.
A. B. Collier et al.: Pi2 on Cluster 7
17:00 17:30 18:00 18:30 19:00 19:30 UT 0 20 40 60 80 100 0 0.2 0.4 0.6 0.8 1 -180° -120° -60° 0° 60° 120° 180° |Sν φ | ˆ n T 2/ H z ˜ γ (bν , bφ ) δ( bν ,bφ )
Fig. 5: Instantaneous amplitude and phase of the(bν, bφ)
cross-power spectral density averaged over the Pi2 band on C3.
decreases rapidly with frequency, the data have been pre-whitened by taking the first difference of the waveform. The spectral peaks for the azimuthal magnetic field on C1, C2 and C4 are at 17.2, 17.0 and16.0 mHz respectively.
The small differences in the frequencies of these peaks are probably not significant in view of the brief duration and damped form of the pulsations. The azimuthal spec-trum at C3 is broadband with little evidence of preferred frequencies. This might appear to contradict the sugges-tion of a FLR at C3, but since the satellite is located near to the plasmapause it is exposed to a broad range of FLR frequencies, any or all of which may be excited. Olson and Rostoker (1975) found that spectra near the auroral electrojet were spread over a wide range of frequencies.
The compressional spectrum on C3 contains a peak at
15.5 mHz, but it is both wide and of low amplitude. On
the other three satellites there is clear evidence of en-hancement in Sµµ at a sequence of discrete frequencies
which are likely to correspond to the fundamental and higher harmonics of a cavity mode resonance.
4 Discussion
Various aspects of the event are now examined in greater detail. Specifically, evidence for cavity mode and field line resonances is considered, the azimuthal wave num-ber is estimated, and the magnitude and orientation of the Poynting vector are discussed.
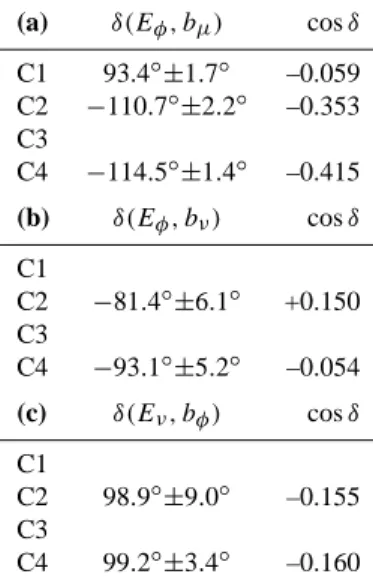
Table 2: Average phase differences between orthogonal electric and magnetic field components.
(a)bµversusEφ δ(Eφ, bµ) cos δ C1 93.4◦± 1.7◦ -0.059 C2 −110.7◦± 2.2◦ -0.353 C3 C4 −114.5◦± 1.4◦ -0.415 (b)bνversusEφ δ(Eφ, bν) cos δ C1 C2 −81.4◦± 6.1◦ +0.150 C3 C4 −93.1◦± 5.2◦ -0.054 (c)bφversusEν δ(Eν, bφ) cos δ C1 C2 98.9◦± 9.0◦ -0.155 C3 C4 99.2◦± 3.4◦ -0.160
The normal modes of the magnetospheric cavity have both the meridional and field-aligned components of the wave vector quantised such that the total phase change along a return path across the cavity in either the ν or µ direction is an integral multiple of 2π. Depending on
whether the cavity is open or closed in the azimuthal di-rection (in the former case the waveguide description ap-plies), the azimuthal wave number may either assume ar-bitrary values or be restricted to discrete allowed values. The existence of a waveguide mode may be verified by establishing that the waves are standing in both the ra-dial and field-aligned directions. If, in addition, it can be shown that there is no azimuthal propagation, then the conditions for a closed cavity mode have been satisfied.
A wave propagating in the radial direction involves the azimuthal electric field and compressional magnetic field. A standing wave should be identified by δ(Eφ, bµ) =
±90◦(Chi and Russell, 1998; Takahashi et al., 2001;
Wa-ters et al., 2002), whileδ(Eφ, bµ) = 0◦or ± 180◦ are
consistent with a travelling wave. Equivalently, the cosine of the phase difference may be used, wherecos δ = 0
cor-responds to a standing wave, whilecos δ = ±1 indicates a
propagating wave. Furthermore, the parametercos δ may
also be used to estimate reflection coefficients (Potemra et al., 1989). Keiling et al. (2001) successfully applied these criteria to data from the Polar satellite.
For the event on 21 January 2003 thebµandEφ
oscilla-tions were coherent at each of the satellites located within the plasmasphere. Table 2a reflects the mean phase differ-ences calculated by averaging over those frequencies for which the coherence threshold was exceeded. The val-ues ofδ(Eφ, bµ) are all close to ±90◦. To illustrate the
source of the data in Table 2a, the coherence and phase
Fig. 5. Instantaneous amplitude and phase of the (bν, bφ)
cross-power spectral density averaged over the Pi2 band on C3.
For the event on 21 January 2003 the bµand Eφ
oscilla-tions were coherent at each of the satellites located within the plasmasphere. Table 2a reflects the mean phase differences calculated by averaging over those frequencies for which the coherence threshold was exceeded. The values of δ(Eφ, bµ)
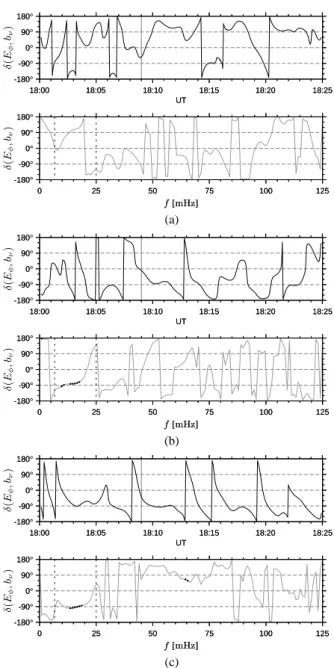
are all close to ±90◦. To illustrate the source of the data in Table 2a, the coherence and phase at each of the satellites are plotted in Fig. 7. The coherence exceeds the threshold within the Pi2 band at all satellites, but whereas the coherent range of frequencies is consistent between C2 and C4, it dif-fers at C1. The phase difference of 93.4◦±1.7◦at C1 appears to provide the most compelling evidence of a radial standing wave. At the remaining satellites the phase differences in-dicate that the compressional magnetic field and azimuthal electric field are not quite in quadrature (the absolute phase differences are within ∼25◦of 90◦), and imply a superposi-tion of standing and propagating waves, indicating imperfect reflection at the radial boundaries.
The plots of phase versus time in Fig. 7 correspond to the phase difference between the analytical signals, which are bandpass filtered over the Pi2 range. An examination of the instantaneous phase illustrates that the averaged data in Ta-ble 2a should be treated with caution. Although the phase at C4 fluctuates somewhat erratically during the event, its mean is around −90◦with a transitory departure at approx-imately 18:15 UTC induced by the transition between the two wave packets. The phase at C2 exhibits a greater degree of variability: periods of around ±180◦are interspersed be-tween intervals of roughly −45◦. The data at C1, however,
2726 A. B. Collier et al.: Pi2 on Cluster
8 A. B. Collier et al.: Pi2 on Cluster
1 101 102 10-3 10-2 10-1 1 C1 1 101 102 10-3 10-2 10-1 1 C1 n T 2/ H z n T 2/ H z Sνν Sνν Sφφ Sφφ Sµµ Sµµ f [mHz] f [mHz] 1 101 102 10-4 10-3 10-2 10-1 1 C2 1 101 102 10-4 10-3 10-2 10-1 1 C2 n T 2/ H z n T 2/ H z Sνν Sνν Sφφ Sφφ Sµµ Sµµ f [mHz] f [mHz] 1 101 102 10-4 10-3 10-2 10-1 1 101 102 C3 1 101 102 10-4 10-3 10-2 10-1 1 101 102 C3 n T 2/ H z n T 2/ H z Sνν Sνν Sφφ Sφφ Sµµ Sµµ f [mHz] f [mHz] 1 101 102 10-4 10-3 10-2 10-1 1 101 C4 1 101 102 10-4 10-3 10-2 10-1 1 101 C4 n T 2/ H z n T 2/ H z Sνν Sνν Sφφ Sφφ Sµµ Sµµ f [mHz] f [mHz]
Fig. 6: Power spectral densities of the magnetic field components for the interval 18:00 to 18:25 UTC on 21 January 2003. The black curves correspond to the PSD calculated using Welch’s method, while the grey curves were obtained using the MEM. The Pi2 band (6.7–25.0 mHz) is enclosed between the vertical dashed lines.
at each of the satellites are plotted in Figure 7. The co-herence exceeds the threshold within the Pi2 band at all satellites, but whereas the coherent range of frequencies is consistent between C2 and C4, it differs at C1. The phase difference of93.4◦± 1.7◦at C1 appears to provide the
most compelling evidence of a radial standing wave. At the remaining satellites the phase differences indicate that the compressional magnetic field and azimuthal electric field are not quite in quadrature (the absolute phase differ-ences are within∼25◦of 90◦), and imply a superposition
of standing and propagating waves, indicating imperfect reflection at the radial boundaries.
The plots of phase versus time in Figure 7 correspond to the phase difference between the analytical signals, which are bandpass filtered over the Pi2 range. An ex-amination of the instantaneous phase illustrates that the averaged data in Table 2a should be treated with caution. Although the phase at C4 fluctuates somewhat erratically during the event, its mean is around−90◦with a
transi-tory departure at approximately 18:15 UTC induced by the transition between the two wave packets. The phase at C2 exhibits a greater degree of variability: periods of around±180◦ are interspersed between intervals of
roughly−45◦. The data at C1, however, display a wide
range of phase, progressing from 90◦to−90◦. Thus,
al-though C1 presented the most convincing argument for a cavity resonance on the basis of cross-spectral anal-ysis, closer examination reveals that the average cross-phase does not provide an adequate reflection of the true
phase relationship. The misleading results for C1 may be attributed to the various phase skips inbµ evident in
Figure 4a, which account for the deficient coherence in the upper portion of the Pi2 band. Those frequencies which are sufficiently coherent correspond to the lower frequency peak evident at C1 in Figure 6, but which does not appear at the other two satellites.
In a simplistic model of the plasmasphere, where the magnetic field and plasma density are assumed to be uni-form, the fundamental cavity resonance has a compres-sional magnetic field node located midway between the plasmapause and the inner boundary (Takahashi et al., 1995). In a more realistic model the compressional node is shifted outward, and may lie close to the plasmapause (Takahashi et al., 2003). The relative phase ofEφandbµ
is reversed across the compressional node, withEφ
lead-ingbµoutside the node. The credible phase differences at
C2 and C4 are consistent with locations outside the com-pressional node. Nodes also exist in the azimuthal elec-tric field on the radial boundaries. The relatively weak
Eφ amplitude at C1, which is located at the largestL of
those satellites within the plasmasphere, conforms to a fast mode standing wave with an azimuthal electric field node in the vicinity of the satellite.
The case for a cavity mode resonance may be rein-forced by considering the radially transverse magnetic perturbation. The field-aligned portion of the poloidal mode is comprised of the meridional magnetic and az-imuthal electric fields. Their mean relative phase is given
Fig. 6. Power spectral densities of the magnetic field components for the interval 18:00 to 18:25 UTC on 21 January 2003. The black curves
correspond to the PSD calculated using Welch’s method, while the grey curves were obtained using the MEM. The Pi2 band (6.7–25.0 mHz) is enclosed between the vertical dashed lines.
display a wide range of phase, progressing from 90◦to −90◦. Thus, although C1 presented the most convincing argument for a cavity resonance on the basis of cross-spectral analysis, closer examination reveals that the average cross-phase does not provide an adequate reflection of the true phase relation-ship. The misleading results for C1 may be attributed to the various phase skips in bµevident in Fig. 4a , which account
for the deficient coherence in the upper portion of the Pi2 band. Those frequencies which are sufficiently coherent cor-respond to the lower frequency peak evident at C1 in Fig. 6, but which does not appear at the other two satellites.
In a simplistic model of the plasmasphere, where the mag-netic field and plasma density are assumed to be uniform, the fundamental cavity resonance has a compressional magnetic field node located midway between the plasmapause and the inner boundary (Takahashi et al., 1995). In a more realis-tic model the compressional node is shifted outward, and may lie close to the plasmapause (Takahashi et al., 2003). The relative phase of Eφand bµis reversed across the
com-pressional node, with Eφleading bµoutside the node. The
credible phase differences at C2 and C4 are consistent with locations outside the compressional node. Nodes also ex-ist in the azimuthal electric field on the radial boundaries. The relatively weak Eφ amplitude at C1, which is located
at the largest L of those satellites within the plasmasphere, conforms to a fast mode standing wave with an azimuthal electric field node in the vicinity of the satellite.
The case for a cavity mode resonance may be reinforced by considering the radially transverse magnetic perturbation. The field-aligned portion of the poloidal mode is comprised of the meridional magnetic and azimuthal electric fields. Their mean relative phase is given in Table 2b, where it is apparent that at both C2 and C4 the phase difference is ap-proximately −90◦. The variation of the phase as a function of time and frequency is displayed in Fig. 8. At C2 and C4 the waveforms are coherent over a significant portion of the Pi2 range and, in addition, the phase difference at frequencies for which the coherence exceeds the threshold is consistently around −90◦. Although several phase skips are evident in the phase-time plots, these correlate well with the packet struc-ture of the waveforms plotted in Figs. 4b and d. During the body of the Pi2 event the field components in question are thus in quadrature.
The poloidal mode therefore appears to be standing in both the radial and field-aligned directions, establishing the exis-tence of at least a waveguide mode. The issue of azimuthal propagation will be addressed shortly.
Table 2c reflects the phase of bφ relative to Eν
aver-aged over the Pi2 band. At both C2 and C4 the condition
δ(Eν, bφ)=90◦ lies close to the calculated range of
uncer-tainty. The origin of the data in Table 2c is plotted in Fig. 9. It is apparent that Eν and bφ are coherent with a consistent
phase difference over an appreciable portion of the Pi2 range. Furthermore, the phase difference is stable at approximately
A. B. Collier et al.: Pi2 on Cluster 2727
Table 2. Average phase differences between orthogonal electric and
magnetic field components: (a) bµversus Eφ, (b) bν versus Eφ, (c) bφversus Eν.
(a) δ(Eφ, bµ) cos δ
C1 93.4◦±1.7◦ –0.059 C2 −110.7◦±2.2◦ –0.353 C3 C4 −114.5◦±1.4◦ –0.415 (b) δ(Eφ, bν) cos δ C1 C2 −81.4◦±6.1◦ +0.150 C3 C4 −93.1◦±5.2◦ –0.054 (c) δ(Eν, bφ) cos δ C1 C2 98.9◦±9.0◦ –0.155 C3 C4 99.2◦±3.4◦ –0.160
90◦for the entire duration of the event. In this case the in-stantaneous and cross-spectral phase are in accord, providing a persuasive argument for a toroidal mode standing wave.
A discussion of the field-aligned phase relationships at C1 has been deferred until now since the proximity of the satel-lite to the magnetic equatorial plane results in small ampli-tudes for the transverse magnetic field components. The am-plitude of the electric field, however, is not inconsequential. A field-aligned standing wave at C1 cannot be discounted since these observations are consistent with an odd harmonic standing wave, which has a node in the transverse magnetic field and an antinode in the electric field on the equatorial plane. However, there is additional evidence in support of odd harmonic structure.
Scant coherence at C1 renders the evaluation of δ(Eφ, bν)
and δ(Eν, bφ) using cross-spectral techniques rather
unreli-able. No estimates are thus given in Table 2. Inspection of the instantaneous phase differences in Figs. 8a and 9a is illu-minating. Admitting that there is certainly a degree of mu-tability in these curves, it is evident that relatively consistent phase relationships δ(Eφ, bν)∼90◦and δ(Eν, bφ)∼−90◦are
maintained during the event, the most significant departures being due to a node in the wave packet structure at around 18:15 UTC.
The symmetry of a field-aligned standing wave may be determined from the phase of pairs of orthogonal transverse magnetic and electric field perturbations. For an odd harmonic toroidal oscillation a satellite somewhat above the geomagnetic equatorial plane should observe
δ(Eν, bφ)∼−90◦, that is, Eν leading in phase, while at the
same position an even harmonic would have bφ leading in
A. B. Collier et al.: Pi2 on Cluster 9
0 25 50 75 100 125 0 1 -180° -90° 0° 90° 180° -180° -90° 0° 90° 180° 18:00 18:05 18:10 18:15 18:20 18:25 UT -180° -90° 0° 90° 180° 18:00 18:05 18:10 18:15 18:20 18:25 UT -180° -90° 0° 90° 180° δ( Eφ ,b µ ) δ( Eφ ,bµ ) γ f [mHz] f [mHz] (a) 0 25 50 75 100 125 0 1 -180° -90° 0° 90° 180° -180° -90° 0° 90° 180° 18:00 18:05 18:10 18:15 18:20 18:25 UT -180° -90° 0° 90° 180° 18:00 18:05 18:10 18:15 18:20 18:25 UT -180° -90° 0° 90° 180° δ( Eφ ,bµ ) δ( Eφ ,b µ ) γ f [mHz] f [mHz] (b) 0 25 50 75 100 125 0 1 -180° -90° 0° 90° 180° -180° -90° 0° 90° 180° 18:00 18:05 18:10 18:15 18:20 18:25 UT -180° -90° 0° 90° 180° 18:00 18:05 18:10 18:15 18:20 18:25 UT -180° -90° 0° 90° 180° δ( Eφ ,bµ ) δ( Eφ ,bµ ) γ f [mHz] f [mHz] (c)
Fig. 7: Coherence and phase difference betweenbµand
Eφat (a) C1, (b) C2 and (c) C4. The shaded portions
of the coherence curves indicate frequencies for whichγ exceeds the threshold of 75%, and at these frequencies solid points are plotted for the phase difference.
0 25 50 75 100 125 -180° -90° 0° 90° 180° 0 25 50 75 100 125 -180° -90° 0° 90° 180° 18:00 18:05 18:10 18:15 18:20 18:25 UT -180° -90° 0° 90° 180° 18:00 18:05 18:10 18:15 18:20 18:25 UT -180° -90° 0° 90° 180° δ( Eφ ,b ν ) δ( Eφ ,b ν ) f [mHz] f [mHz] (a) 0 25 50 75 100 125 -180° -90° 0° 90° 180° 0 25 50 75 100 125 -180° -90° 0° 90° 180° 18:00 18:05 18:10 18:15 18:20 18:25 UT -180° -90° 0° 90° 180° 18:00 18:05 18:10 18:15 18:20 18:25 UT -180° -90° 0° 90° 180° δ( Eφ ,bν ) δ( Eφ ,bν ) f [mHz] f [mHz] (b) 0 25 50 75 100 125 -180° -90° 0° 90° 180° 0 25 50 75 100 125 -180° -90° 0° 90° 180° 18:00 18:05 18:10 18:15 18:20 18:25 UT -180° -90° 0° 90° 180° 18:00 18:05 18:10 18:15 18:20 18:25 UT -180° -90° 0° 90° 180° δ( Eφ ,bν ) δ( Eφ ,bν ) f [mHz] f [mHz] (c)
Fig. 8: Phase difference betweenEφandbνat (a) C1, (b)
C2 and (c) C4. Solid points are only plotted at frequencies for whichγ exceeds the threshold of 75%.
in Table 2b, where it is apparent that at both C2 and C4 the phase difference is approximately−90◦. The
vari-ation of the phase as a function of time and frequency is displayed in Figure 8. At C2 and C4 the waveforms are coherent over a significant portion of the Pi2 range and, in addition, the phase difference at frequencies for which the coherence exceeds the threshold is consistently around−90◦. Although several phase skips are evident in
the phase-time plots, these correlate well with the packet structure of the waveforms plotted in Figures 4b and 4d. During the body of the Pi2 event the field components in question are thus in quadrature.
Fig. 7. Coherence and phase difference between bµand Eφat (a)
C1, (b) C2, and (c) C4. The shaded portions of the coherence curves indicate frequencies for which γ exceeds the threshold of 75%, and at these frequencies solid points are plotted for the phase difference.
![Fig. 2: Perturbations in the H component of the magnetic field at ground stations (a) Yinchuan [YCB] and (b) Kakioka [KAK]](https://thumb-eu.123doks.com/thumbv2/123doknet/14773862.592657/6.892.465.818.91.350/perturbations-component-magnetic-field-ground-stations-yinchuan-kakioka.webp)
![Fig. 4: EFW and FGM waveforms for 21 January 2003 on (a) C1 [Rumba], (b) C2 [Salsa], (c) C3 [Samba] and (d) C4 [Tango]](https://thumb-eu.123doks.com/thumbv2/123doknet/14773862.592657/7.892.112.779.149.949/fig-efw-waveforms-january-rumba-salsa-samba-tango.webp)