HAL Id: hal-01264191
https://hal.archives-ouvertes.fr/hal-01264191
Submitted on 1 Feb 2016
HAL is a multi-disciplinary open access
archive for the deposit and dissemination of
sci-entific research documents, whether they are
pub-lished or not. The documents may come from
teaching and research institutions in France or
abroad, or from public or private research centers.
L’archive ouverte pluridisciplinaire HAL, est
destinée au dépôt et à la diffusion de documents
scientifiques de niveau recherche, publiés ou non,
émanant des établissements d’enseignement et de
recherche français ou étrangers, des laboratoires
publics ou privés.
3-D crustal structure in the Agadir region (SW High
Atlas, Morocco)
Youssef Timoulali, Mustapha Meghraoui
To cite this version:
Youssef Timoulali, Mustapha Meghraoui. 3-D crustal structure in the Agadir region (SW High Atlas,
Morocco). Journal of Seismology, Springer Verlag, 2011, 15 (4), pp.625. �10.1007/s10950-011-9240-0�.
�hal-01264191�
ORIGINAL ARTICLE
3-D crustal structure in the Agadir region
(SW High Atlas, Morocco)
Youssef Timoulali&Mustapha Meghraoui
Received: 14 December 2010 / Accepted: 9 June 2011 # Springer Science+Business Media B.V. 2011
Abstract The 1960 Agadir earthquake (Mw 6.0) constitutes the most damaging earthquake event in Morocco. With the expansion of seismic networks during the last decade in Morocco, new seismic data have been collected in this region. The P and S arrivals at 19 stations located in Southern Morocco are used to investigate the lithosphere in the Agadir region. In this study, we use a linearized inversion procedure comprising two steps: (1) finding the minimal 1-D model and simultaneous relocation of hypocentres and (2) determination of local velocity structure using linearized inversion. The model parameterization in this method assumes a continuous velocity field. The resolution tests indicate that the calculated images give near true structure for the studied region from 0- to 45-km depth. The results show that the total crust thickness varies from 30 to 40 km in SW High Atlas and confirm the modest crustal tectonic shortening and thickening in the Atlas Moun-tains of Morocco. The inferred geological structure reconstructed from the calculated image illustrates the existence of fault-related folding. The evidence for
coseismic ruptures in 1960 on the Kasbah anticline combined with the 1960 earthquake hypocentre located in the tomographic image determines the seismic potential of the active fault and related fold. The resulting tomographic image shows a high-velocity anomalies that could be associated with the location of deep active fault (10–30 km) associated with the fold structure. In the South Atlas, theses anomalies could be associated with the South atlas thrust front structure.
Keywords Agadir. Earthquakes . Seismic tomography. Crustal velocity
1 Introduction
The 1960 Agadir earthquake is the most damaging earthquake in Morocco. Although the Richter magni-tude was moderate (Ms 5.7), the main shock caused the loss of about 12,000 lives and destroyed 75% of building stock probably due to a shallow hypocentre depth (2.0 to 3.0 km according to Duffaud et al.
1962). The damage distribution (isoseismals) and surface breaks indicate a maximum intensity IX (MSK, Medvedev–Sponheuer–Karnik scale) located immediately south of the city (Rothé et al. 1962). Recent investigations on the coseismic surface defor-mation suggest that the earthquake can be associated with the coastal Ait lamine Kasbah fault-related fold (Meghraoui et al. 1998). Medina and Cherkaoui (1988) determined a strike-slip focal mechanism with DOI 10.1007/s10950-011-9240-0
Y. Timoulali (*)
Centre National pour la Recherche Scientifique et Technique (CNRST), Rabat, Morocco
e-mail: [email protected]
M. Meghraoui EOST–IPG UMR 7516, Strasbourg, France
thrust component while Wickens and Hodgson (1967) (in Udias et al. 1989) provided a thrust mechanism with an ENE-WSW trending fault. Using seismic profiles and a detailed bathymetry, Mridekh et al. (2000) identified the offshore continuation of the active Kasbah anticline and its asymmetric southern transport. The relationships between the seismogenic structure at depth and the fault-related folding at the sub-surface are, however, poorly constrained, and very little is actually known on the seismic structure below a depth of 4 km.
Tomographic studies in region with large and destructive earthquakes often provide some con-straints on the identification of active tectonic structures (Eberhart-Philips 1993). The local earth-quake tomography using absolute and relative P- and S-wave travel time data applied to regions with active tectonics improves the hypocentre location and gives access to a 3-D crustal velocity model (Zhang and Thurber2003). A high-angle reverse fault (interpreted as an inverted normal fault) was identified from a tomography analysis of aftershocks of the 1980 El Asnam earthquake (Ms 7.3) in the Tell Atlas (Chiarabba et al. 1997,2010). The local tomography of the 2003 Zemmouri (Mw 6.8) earthquake after-shocks images with accuracy (0.5 km resolution) the
thrust-related faulting in the Tell Atlas of Algeria (Ayadi et al. 2008). The recent development of seismic networks in Morocco allows the record of new seismic data that can be used to investigate the lithospheric structure in the Agadir region.
In this paper, we first present the tectonic context, seismic data selection and methods necessary for the 3-D structure velocity. Since no 1-D velocity model of the Agadir region exists, we used the European PM2 model (Spakman et al. 1993) to perform relocation secondly. After the database preparation, we use tomography to accurately obtain the velocity map and crustal structure of the Agadir region and infer the active fault geometry. The interpretation of images is discussed and compared to the inferred seismogenic and tectonic structures.
2 Tectonic setting
The Agadir region is located on the South Atlas thrust front which is the structural boundary between the active Atlas Mountains and the relatively stable Sahara platform (Fig. 1). The earthquake area is bounded to the North and Northeast by the High Atlas fold and thrust belt, and to the south by the weakly
Fig. 1 Seismotectonic map of Morocco. The seismicity is from 1901 to 2010 (catalogue of CNRST, Rabat), and focal mechanisms are Harvard CMT solutions. The 1960 Agadir earthquake epicentre is shown in blue circle (see also Fig.2a for detailed epicentre location). The black line marks the South Atlas Thrust front that includes the coastal region of Agadir. The arrows indicate the shortening direction across the thrust front and High Atlas as predicted from focal mechanism solutions. The background topography is from GEBCO (Becker et al.2009)
deformed Souss foreland basin. The contrast between the topography (∼2,000 m) and the deformed Neo-gene and Quaternary deposits visible across the thrust front show the long term of tectonics activity. Uplifted late Quaternary marine and alluvial terraces and progressive unconformities within the Plio-Quaternary deposits imply 0.1 to 0.2 mm/year of uplift rate in the Agadir region (Fig.2a; Ambroggi 1963; Meghraoui et al. 1998). On the basis of a kinematic analysis of Neogene and Quaternary faults, El Maamar (1988)
determines a NNW-SSE shortening component across the South Atlas thrust Front, consistent with P axes of focal mechanisms of recent earthquakes (Fig.1). Major compressional structures in the High Atlas consist of a large-scale folding system which affects Mesozoic and Cenozoic formations generally showing E-W to NE-SW trending fold axes and thus nearly orthogonal to the Atlantic coastline. The thickness of the crustal structure beneath the Atlas Mountains is estimated between 33 and 40 km and relies mainly on gravity
Fig. 2 a Fault-related folding in the Agadir region (black line is thrust fault; see also Meghraoui et al.
1998). The epicentre location is according to Rothé et al. (1962). b Location of permanent stations (triangle) in the Agadir study region (in square) south of Morocco. The epicentral distribution is determined by Hypocenter 3.2 and includes all events from 1901 to 2010 (catalogue of CNRST, Rabat). The background topography is SRTM 3-arc-second digital elevation model (Farr and Kobrick1998)
and seismic refraction data (Makris et al.1985; Tadili et al.1986; Wigger et al.1992; Ayarza et al.2005).
3 Tomography study
3.1 Data selection and methodology
The arrival time data used in this study were obtained by the Moroccan network from 1988–2010. In order to determine hypocentral parameters and find the local velocity structure of epicentral area located in Southern Morocco, the P and S arrivals at 19 stations located at south of Morocco are used (Fig. 2b). The preliminary estimate of origin times and hypocentral coordinates is determined by the Hypocenter 3.2 program (Lienert 1994)
We use in this study the linearized inversion procedure that includes the following two steps: (1) finding the minimal 1-D model using VELEST (Kissling et al.1994), and (2) simultaneous relocation of hypocentres and determination of local velocity structure using linearized inversion (Thurber 1983; Eberhart-Phillips 1990). The minimum 1-D model estimation by VELEST: Kissling et al. (1994) defines the minimum 1-D model. The 1-D velocity represents the least squares solution of the related equation to the coupled hypocentre velocity model. In this model, the layer velocities are approximately equal to the average velocity in the 3-D tomographic solution within the same range. In the linearized approach, we use the SIMULPS program originally developed by Thurber (1983) using approximate ray tracing (ART) and pseudo-bending algorithms. This method was further improved by Eberhart-Phillips (1990) for forward modelling of P- and S-wave arrival times in iterative, damped, least squares inversion for hypo-centres and 3-D velocity structure. In this approach, the model parameterization assumes a continuous velocity field by linearly interpolating between veloc-ity values defined at the nodes of a 3-D grid (Toomey and Foulger1989). Nodal locations are fixed prior to an inversion. The earth structure is represented in three dimensions by velocity at discrete points, and the velocity at any intervening point is determined by linear interpolation among the surrounding eight grid points. Values at the velocity nodes are systematically perturbed during the inversion. Except for the outermost nodes, which are always fixed, every node
can either be kept fixed or included in the inversion. The ART algorithm selects the path with the least travel time from a suite of circular arcs connecting the source and the receiver. The iterative pseudo-bending method fine-tunes the ray path obtained by ART to better approximate the true path dictated by the local velocity gradients (Um and Thurber1987)
3.2 Resolution analysis and synthetic tests
It is commonly recognized that the tomography inversion result must be assessed with a certain resolution. By the concept of resolution, we wish to know how the true structure is reconstructed in the calculated image (Zhao and Negishi1998; Zhao et al.
2001). In this study, the resolution and checkboard tests are used as additional techniques to improve resolution. For the resolution tests, we use the spread function (SF) of the averaging vector for the assessment parameter resolution and derivative weight sum (DWS, Foulger and Toomey 1989). A small value of spread function and a high value of DWS indicate localized averaging of velocity.
In the checkboard test, we first proceed with a variation of the order of ±10% for the P wave in the original 1-D model velocity; then, the estimated synthetics of arrival time for the P waves are calculated by forward problem. The synthetic data are used for the inversion for the 1-D model with propose to produce a final model which is close to the synthetic one. The quality of this test is verified by knowing at what level the nearly true velocity structure is present in the calculated image.
3.3 Relocation of local events
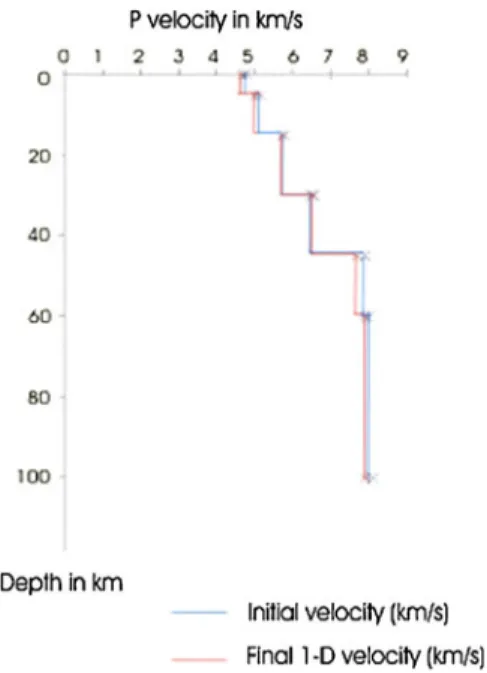
An initial 1-D velocity model was constructed from a reference model (PM2) determined for Europe (Spakman et al. 1993). Each event was relocated using the same starting epicentral location and origin time, but using multiple starting hypocentral depths of 0, 5, 15, 30, 45, 60 and 100 km. Some criteria are used to remove poorly constrained events: the location with the high weighted RMS residual (>1.0 s) and any event that has a horizontal or vertical shift more than 10 km is discarded. The final 1-D model velocity is shown in Fig. 3, and the final relocation when the two processes are performed (3-D model) is shown in Fig. 4.
The crustal seismicity is scattered in the High Atlas and in the Agadir region. In the Souss basin (South of Agadir), the seismicity is weak. In the Agadir seismic zone, the seismic activity is present at both shallow and intermediate depths (0 to 70 km).
The P velocities (VP) are assigned in a grid point at each layer of the crust and in the upper mantle. The initial
velocity calculated for grid is assigned to be +15% faster or−15% slower at the same depth. The resolution test result shows that the calculated images give a nearly true velocity structure from 0- to 45-km depth in the Agadir region. SF test and DWS analysis for our study region are shown in Fig.5 and the checkboard test in Fig.6.
4 Results and discussion
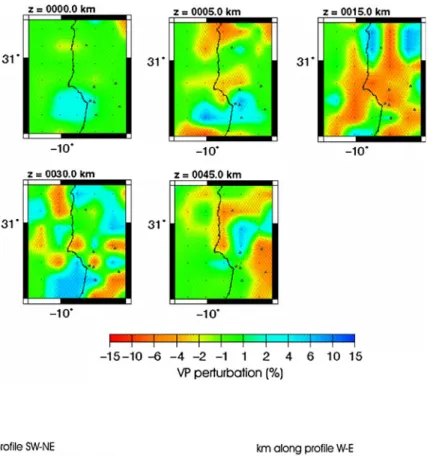
The resulting tomography image in Fig. 7 has a prominent high-velocity anomaly that shows a maximum increase in P wave velocity of approximately 10% (blue colour) and prominent low velocity anomaly that shows a maximum decrease in P wave velocity of approximately 10% (red colour).
The most efficient and peculiar zone in the Agadir crustal structure displays a high velocity located from 0- to 5-km depth with P velocity variation from 6.0 to 6.5 km/s (Fig.7). This crustal anomaly is interpreted as an upper crustal brittle body that marks the limit between the Atlas block to the north from the Sahara Platform to the south (see also Fig. 1 and profiles 1 and 3 in Fig.8). This body seems to be limited to the south by the frontal Atlas thrust fault. At 15-km depth, the P velocity varies from 7.0 to 7.3 km/s which correspond to a high-velocity layer located North and South of the Agadir region. This positive Fig. 3 1-D model velocity P as obtained from the analysis of
seismic records at stations of Fig.2b
Fig. 4 Final relocation for the period 01 December 1988 to 18 March 2010 using 3-D model. The crustal seismicity is scattered in the High Atlas and in the Agadir region, and the seismic activity is present at both shallow and intermediate depths (0 to 70 km). The error range for the estimated depth is ±1 km
anomaly can be interpreted as a cooling asthenospheric material making the limit between the brittle seismo-genic layer above and the ductile viscous zone below. At 30 and 45 km, the P velocity varies from 7.5 to 8.0 km/s showing a high velocity located across the Agadir region. These positives anomalies are associat-ed to lithospheric bodies that may have descendassociat-ed into the upper mantle.
The most inefficient zone is located at 15-, 30- and 45-km depth. At 15-km depth, the P velocity varies from 6.0 to 6.5 km/s showing a low velocity level which can be associated with the heat flow (Rimi
1999). At 30- and 45-km depth, the P velocity varies from 7.0 to 7.5 showing a low velocity zones in North and East of Agadir. This low velocity suggests the
presence of a hot ductile intrusive material possibly coming from asthenosphere.
The upper mantle P velocities have relative low values of 7.8–8.0 km/s (Fig.9). This value suggests the presence of the Moho boundary at 30 km below Agadir region and 30- to 40–50-km deep in the Southern High Atlas.
A crustal thrust at the lithospheric scale The velocity anomalies in the Agadir region can be explained by the tectonic processes associated with the conver-gence and collision between Africa and Eurasia. The collision should have resulted in thickening of the Atlas lithosphere, but such thickening is not observed (Ramdani 1998). The crust in the regions adjacent to Fig. 5 Test of resolution
spread function and derivative weight sum at depths of 0, 5, 15, 30, 45, 60 and 100 km. The depth of the layer is shown in the top left corner of each map. See Fig.4for seismicity distribution
the High and Middle Atlas is 33–36-km thick (Makris et al. 1985; Wigger et al.1992). For the High Atlas, the calculated thicknesses are somewhat greater and in the range of 35–38 km. Localized maxima of up to 40 km are based only on gravity analyses (Tadili et al.
1986; Ayarza et al.2005). Ramdani (1998) suggested that the lithosphere beneath the Southern High Atlas is thinned to 50 km.
Based on our analysis of local P waves velocities and profiles, the crustal thickness beneath the South-western region of the High Atlas varies from 40– 50 km (Fig. 9). In the Agadir region, the crustal thickness varies from 30 to 40 km (Fig.9). Although the geological structure reconstructed from the to-mography images is complex, we may infer a folding structure associated with North and South dipping faults (Fig.9). These antithetic style faults and related folding are consistent with the Kasbah anticline structure that revealed coseismic ruptures in 1960
that probably correspond to flexural-slip folding (Rothé et al.1962; Meghraoui et al.1998) determin-ing the seismic potential of an active fault. The inferred 1960 Agadir earthquake location and hypo-centre beneath the Kasbah fold combined with the tomographic images imply the existence of North-dipping reverse fault geometry represented at the crustal scale by the South Atlas front. This high-angle reverse fault (dip>50°) extends to a 30-km depth (Fig. 9). The spatial variations of velocity anomalies in the crust and related lithospheric properties (deep-seated upper and lower crustal lithospheric bodies) attest that the fault that contributes to the active deformation is visible at depth. Furthermore, the spatial coverage of the calculated tomography images indicates that the Kasbah reverse fault is accompanied to the East by antithetic or tear faults (Fig. 9, profiles 1 and 2); this Eastern extension is shown by the Tildi tear fault and Anoun Feg flexure (Fig. 2b). High Fig. 6 The synthetic model
test for VP (a) and the synthetic model test results for VP (b) at depths of 0, 5, 15, 30, 45, 60 and 100 km. The depth of the layer is shown in the top left corner of each map. See Fig.4for seismicity distribution
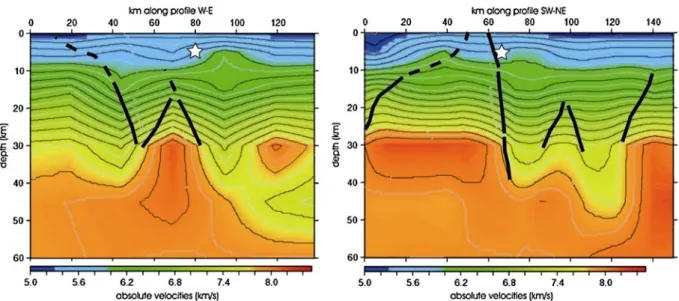
Fig. 8 High-velocity perturbation along profiles 1, 2 and 3 in the Agadir region. The star indicates the 1960 earthquake hypocentre Fig. 7 VP perturbation
relative to 1-D model. Note the large contrast of VP percent between 5- and 15-km depth that may correspond to the limit of the seismogenic (brittle) layer
velocity values obtained from the tomography in the upper crust brittle zone illustrate the main active Agadir high-angle reverse fault that may sustain compression stresses along the South Atlas tectonic front. Indeed, the deep-seated basement rocks from the African platform outcropping immediately South of the Agadir fault suggest the presence of a superficial seismogenic layer and related asperities that may explain the 1960 shallow earthquake hypocentre.
5 Conclusion
Based on the seismic records of 19 seismic stations, and analysis of the local P wave velocities structures and profiles, we found that the crustal thickness beneath Agadir region varies from 30 to 40 km. In the calculated tomography image, the 1960 Agadir earthquake hypo-centre is located on the Kasbah fault associated with the fold structure. The tomography results show:
1. The high velocity located from 0- to 5-km depth interpreted as upper crust brittle body. The high velocity located at 15-km depth is interpreted as a cooling asthenospheric material. From 30- to 45-km depth, as well as the 70-km-deep seismicity, the high velocity can be associated to lithospheric bodies that may have descended into the upper mantle.
2. A low velocity at 15 km interpreted as heat flow. At 30 km, the low velocity suggests the presence of a hot ductile intrusive material possibly coming from the asthenosphere.
The evidence of rapid uplift in addition to localized high heat flows in the Agadir region (SW of high Atlas) can be explained in terms of a delamination event like in the High Atlas (Ramdani 1998).
3. The folding structures and related synthetic and antithetic faults affect the lower and upper crust. High velocity values reaching 30-km depth indicate the existence of a deep-seated high-angle reverse fault along the Southern border of the Atlas Mountains. The Agadir Kasbah (Santa Cruz for the Portuguese settlers) was severely damaged by the AD 1731 seismic event (the date of the earthquake is still visible in the remaining doorstep of the fortress; the assigned intensity> IX in the Moroccan historical seismicity cata-logue). Taking into account the damage area, both the 1731 and 1960 may be related to the same seismogenic fault located inshore and offshore the Agadir region. The tomography study shows the structural characteristics beneath the Kasbah fault associated with the fold structure and indicates the main faults depth. This fault can be the origin of the damaging historical earthquakes.
Fig. 9 Lithosphere structure and detailed folding structures with faults (black line) along left profile (W-E) and right profile (SW-NE, see profile location in Fig.8). The star indicates the 1960 earthquake hypocentre. The Moho determined at around
30-km depth (see text for explanation) shows an irregular pattern which is visible in all profiles; this irregular shape of the basement structure at about 75 km (distance) in the right profile may correspond to the major south Atlas fault zone at depth
The upper crustal section of the Agadir region illustrates the main active Agadir high-angle reverse fault that may represent a brittle layer with asperities and oppose more resistance to the seismogenic stresses interacting directly with the compression along the South Atlas thrust front. This major tectonic boundary in North Africa and its superficial brittle section of the crust may include other asperities and generate larger earthquakes with Mw>7.
Acknowledgements This study was supported by the CNRST, PROTARS D15/41. Some of the figures were prepared using the public domain GMT software (Wessel and Smith 1998). Topography in figures is from GEBCO_nc8 and SRTM 3-arc-second (∼90 m) digital elevation model (Farr and Kobrick1998).
References
Ambroggi R (1963) Etude géologique du versant méridional du haut Atlas occidental et de la plaine du Souss. Notes et mémoire du service Géologique du Maroc, 157
Ayadi A, Dorbath C, Ousadou F, Chikh M, Bounif A, Meghraoui M (2008) The Zemmouri earthquake rupture zone (Mw 6.8, Algeria): aftershocks sequence relocation, seismic tomography and 3D velocity model. J Geophys Res 113:B09301, doi:10.1029/2007JB005257
Ayarza P, Alvarez-Lobato F, Teixell A, Arboleya ML, Teson E, Julivert M, Charroud M (2005) Crustal structure under the central High Atlas Mountains (Morocco) from Geological and gravity data. Tectonophysics 400:67–84
Becker JJ et al (2009) Global bathymetry and elevation data at 30 Arc Seconds Resolution: SRTM30_PLUS. Marine Geodesy 32(4):355–371, doi:10.1080/01490410903297766
Chiarabba C, Amato A, Meghraoui M (1997) Tomographic images of the El Asnam fault zone, and the evolution of a seismogenic thrust-related fold. J Geophys Res 102 (24):485–24498
Chiarabba C, Bagh S, Bianchi I, De Gori P, Barch M (2010) Deep structural heterogeneities and the tectonic evolution of the Abruzzi region (Central Apennines, Italy) revealed by microseismicity, seismic tomography, and teleseismic receiver functions. Earth Planet Sci Lett 462–476.
doi:10.1016/j.epsl.2010.4.028
Duffaud F, Rothé JP, Debrache J, Erimesco P, Choubert G, Faure Muret A (1962) Le séisme d’Agadir du 29 février 1960. Notes & Mém Serv Géol Maroc 154:68
Eberhart-Phillips D (1990) Three-dimensional P and S velocity structure in the Coalinga region, California. J Geophys Res 95:15343–15363
Eberhart-Philips D (1993) Local earthquake tomography: earthquake source regions. In: Iyer HM, Hirahara K (eds) Seismic tomography: theory and practice. Chapman & Hall, London
El Maamar K (1988) Etude tectonique de la bordure sud du Haut Atlas occidental (région d’Agadir, Maroc). Thèse d’Université, Montpellier II, pp 152
Farr TG, Kobrick M (1998) The shuttle radar topography mission: a global DEM. In: Geological Society of America (ed) 1998 annual meeting. Boulder: Geological Society of America (GSA), p 359
Foulger GR, Toomey DR (1989) Structure and evolution of the Hengill-Grensdalur central volcano complex, Iceland: geology, geophysics and seismic tomography. J Geophys Res 94:17511–17522
Kissling E, Ellsworth WL, Eberhart-Phillips D, Kradolfer U (1994) Initial reference models in local earthquake tomography. J Geophys Res 99:19635–19646
Lienert BR (1994) A computer program for locating earth-quakes locally, regionally and globally. Honolulu: Hawaii Institute of Geophysics/SOEST
Makris J, Demnati A, Klussman J (1985) Deep seismic soundings in Morocco and a crust and upper mantle model deduced from seismic and gravity data. Ann Geophys 3:369–380
Medina F, Cherkaoui TD (1988) Precision sur le mecanisme au foyer du seisme d’Agadir (Maroc) du 29 Fevireier 1960. Place dans le cadre sismotectonique du Maroc. Geophysica 24(1–2):57–66
Meghraoui M, Outtani F, Choukri A, Frizon de lamote D (1998) Coastal tectonics across the south Atlas thrust front and the Agadir active zone, Morocco. In: Stewart IS, Vita-Finzi C (eds) Coastal tectonics. Geology Society, London, pp 239–253, Special publication 146
Mridekh A, Toto EA, Hafid M, El OA (2000) Structure de la plate forme Atlantique au large d’agadir (Maroc sud-occidental). Earth Plan Sci Lett 331:387–392
Ramdani F (1998) Geodynamic implications of intermediate-depth earthquakes and volcanism in the intraplate Atlas mountains (Morocco). Phys Earth Plan Int 108:245– 260
Rimi A (1999) Mantle heat flow and geotherms for the main geologic domains in Morocco. Int J Earth Sci 99:458– 466
Rothé et al (1962) Le séisme d’Agadir et la séismicité du Maroc. Notes & Mém Serv Géol Maroc 154(68) Spakman WS, der Lee V, der Hilst V (1993) Travel-time
tomography of the European–Mediterranean mantle down to 1400 km. Phys Earth Plan Int 79:3–74
Tadili B, Ramdani M, Ben Sari D, Chapochnikov K, Bellot A (1986) Structure de la croute dans le nord du Maroc. Ann Geophys 4:99–104
Thurber CH (1983) Earthquake locations and three-dimensional crustal structure in the Coyote Lake area, central California. J Geophys Res 88:8226–8236
Toomey DR, Foulger GR (1989) Tomographic inversion of local earthquake data from the Hengill-Grensdalur Central Volcano Complex, Iceland. J Geophys Res 94 (B12):17,497– 917,510
Udias A, Buforn E, Ruiz de Gauna J (1989) Catalogue of focal mechanisms of European earthquakes. Madrid, Department of Geophysics, Universidad Complutense, p 274
Um J, Thurber C (1987) A fast algorithm for two-point seismic ray tracing. Bull Seism Soc Am 77:972–986
Wessel P, Smith HF (1998) New improved version of the generic mapping tools released. Eos Trans AGU 79:579
Wigger P, Asch G, Giese P, Heinsohn W-D, El Alami SO, Ramdani F (1992) Crustal structure along a traverse across the Middle and High Atlas mountains derived from seismic refraction studies. Geol Rundsch 81:237–248 Zhang H, Thurber CH (2003) Double-difference tomography:
the method and its application to the Hayward fault, California. Bull Seismol Soc Am 93(5):1875–1889
Zhao D, Negishi H (1998) The 1995 Kobe Earthquake: seismic of the source zone and its implication for the rupture nucleation. J Geophys Res 103:9967–9985
Zhao D, Wang K, Rogers GC, Peacock SM (2001) Tomographic image of low P velocity anomalies above slab in northern Cascadia subduction zone. Earth Planets Space 53:285–293