HAL Id: hal-00297080
https://hal.archives-ouvertes.fr/hal-00297080
Submitted on 9 Apr 2008
HAL is a multi-disciplinary open access
archive for the deposit and dissemination of
sci-entific research documents, whether they are
pub-lished or not. The documents may come from
teaching and research institutions in France or
abroad, or from public or private research centers.
L’archive ouverte pluridisciplinaire HAL, est
destinée au dépôt et à la diffusion de documents
scientifiques de niveau recherche, publiés ou non,
émanant des établissements d’enseignement et de
recherche français ou étrangers, des laboratoires
publics ou privés.
Precipitation classification at mid-latitudes in terms of
drop size distribution parameters
C. Caracciolo, F. Porcù, F. Prodi
To cite this version:
C. Caracciolo, F. Porcù, F. Prodi. Precipitation classification at mid-latitudes in terms of drop size
distribution parameters. Advances in Geosciences, European Geosciences Union, 2008, 16, pp.11-17.
�hal-00297080�
© Author(s) 2008. This work is distributed under the Creative Commons Attribution 3.0 License.
Geosciences
Precipitation classification at mid-latitudes in terms of drop size
distribution parameters
C. Caracciolo1, F. Porc `u1, and F. Prodi1,2
1Department of Physics, University of Ferrara, Italy
2Institute of Atmospheric Sciences and Climate of the Italian National Research Council (ISAC-CNR), Bologna, Italy
Received: 2 August 2007 – Revised: 14 January 2008 – Accepted: 29 January 2008 – Published: 9 April 2008
Abstract. The drop size distribution (DSD) is a fundamental property of rainfall because the shape of the distribution re-flects the physics of rain formation processes. Given the lack of studies on the DSD at mid-latitudes, the present work fo-cuses on the microphysical characterization of precipitation events occurring in Italy, using two different types of dis-drometer. A large number of different rain events was col-lected: they underwent microphysical analysis by computing the Z-R relationships, observing the average DSDs and DSD parameters, fitting the real distribution for different rainfall rate categories and applying convective (C) – stratiform (S) discrimination algorithms. A general agreement with past works at mid-latitudes is found both in the Z-R relationship and in DSD parameters. The rain distribution is well de-scribed by a gamma DSD and only in some cases (especially the light rain events) by an exponential DSD. Marked differ-ences are observed in DSD parameters and Z-R relationships between C and S episodes. The use of disdrometers for ar-eas covered by multiparametric radar is suggested and will be performed in the near future.
1 Introduction
One of the most complete descriptions of rain is given by its DSD. The spatial and temporal variability of DSD reflects variations in the relative importance of the microphysical processes inside clouds (e.g. coalescence, break-up, evapo-ration), which may be related to differences in the observed ground rainfall integral variables and DSD parameters.
The problem of estimating precipitation dimensional pa-rameters has attracted renewed interest over recent years for two main reasons. One the one hand, more complete
infor-Correspondence to: C. Caracciolo
mation on the precipitation characteristics (than the simple instantaneous rainfall rate) is needed for radar calibration or satellite sensor interpretation, in the frame of super-sites de-signed for ground validation and calibration (Wolff et al., 2005). On the other hand, new instruments have been pro-posed (based on a wide variety of physical principles, e.g. electromechanical impact, Doppler effect, optical extinction) for more accurate measurements and disdrometer compar-isons have been performed during experimental campaigns (e.g. Krajewski et al., 2006).
The discrimination between C and S precipitation is of particular relevance, even if only a few works have focused on mid-latitude continental rain (e.g. Waldvogel, 1974; Ul-brich, 1983; Zawadski et al., 1994), while more recently many authors have analyzed tropical oceanic case studies (e.g. Tokay and Short, 1996; Testud et al., 2001). There is also a lack of studies performed in the Mediterranean area. To deal with the specific characteristics of continental mid-latitude rain, Caracciolo et al. (2006a) have proposed a new C/S discrimination algorithm, that is more suitable than the tropical ones.
Classically, DSD is measured by an electromechanical impact disdrometer called Joss-Waldvogel (hereinafter JW) (Joss and Waldvogel, 1967). A new device named Pludix (Prodi et al., 2000), an X-band rain-gauge/disdrometer, has recently shown good performances, complementing optical and impact devices (Caracciolo et al., 2006b).
The present work reports on the analysis of the drop size characteristics of precipitation in Italy, using JW and Pludix. Disdrometric data measured during rainfall measuring cam-paigns are collected and analyzed, allowing a rain classifi-cation and characterization in terms of dimensional parame-ters. The work brings together the most extensive database in Italy up to now, representing regions with different rain-fall regimes: Alpine foothills (Turin), Po Valley (Bologna and Ferrara), central Italy (Florence) and southern Italy and Islands.
12 C. Caracciolo et al.: Precipitation classification at mid-latitudes
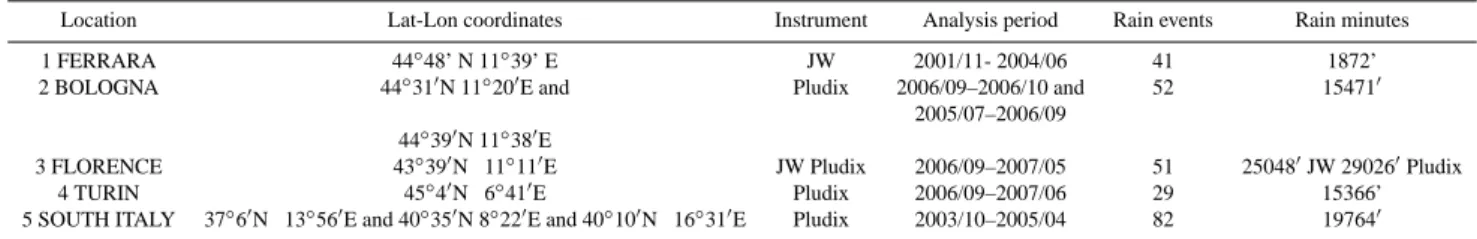
Table 1. The Italian databases used in the analysis.
Location Lat-Lon coordinates Instrument Analysis period Rain events Rain minutes 1 FERRARA 44◦48’ N 11◦39’ E JW 2001/11- 2004/06 41 1872’
2 BOLOGNA 44◦31′N 11◦20′E and Pludix 2006/09–2006/10 and 52 15471′
2005/07–2006/09 44◦39′N 11◦38′E
3 FLORENCE 43◦39′N 11◦11′E JW Pludix 2006/09–2007/05 51 25048′JW 29026′Pludix
4 TURIN 45◦4′N 6◦41′E Pludix 2006/09–2007/06 29 15366’
5 SOUTH ITALY 37◦6′N 13◦56′E and 40◦35′N 8◦22′E and 40◦10′N 16◦31′E Pludix 2003/10–2005/04 82 19764′
1: Department of Physics – University of Ferrara – Ferrara
2: Institute of Atmospheric Sciences and Climate – National Research Council (ISAC-CNR) and S. Pietro Capofiume – Bologna 3: Montepaldi (San Casciano in Val di Pesa) – Florence
4: Bardonecchia – Turin
5: South Italy: Licata (Agrigento), Surigheddu (Sassari), Rotondella (Matera)
2 Data and experimental set up
Experimental sites in southern and northern Italy have been established (see Table 1). They are equipped with a clas-sical JW disdrometer and/or an X-band pluvio-disdrometer (Pludix), all with sampling time of one minute.
There are three different sources of error affecting the measurement of small drops with the JW disdrometer: wind, acoustic noise from the surroundings, and the ringing of the styrofoam cone when hit by large drops (known as disdrom-eter dead time). The influences of the first two sources are reduced to a minimum by a proper installation of the trans-ducer; no correction is here applied to the DSD to account for the dead time problem. No on-site calibration is performed on the disdrometer, as the sensor head used was new and cal-ibrated by the manufacturer.
The JW data consist of number of raindrops niof diameter
Diin 20 size categories from 0.31 mm to 5.6 mm. The
com-putation of the DSD (mm−1m−3) and of the rainfall rate R
(mm h−1) from these data involves a simple summation over
drop size classes.
Pludix is a low-power X-band (9.5 GHz), continuous wave (CW) radar, detecting the electromagnetic radiation backscattered by falling hydrometeors (Prodi et al., 2000; Caracciolo et al., 2006b). The instrument suffers from some problems, also common to small CW bi-static Doppler radars, including the following (Doviak and Zrnic, 1993): run-off and vibration of raindrops on the radome; variable absorption losses due to water on the radome; effect of hori-zontal winds on DSD retrieval; sampling errors caused by the non-uniform response from different locations in the mea-surement volume. For Pludix, these problems are attenuated or corrected as follows: a microwave transparent sponge is set on the elliptical base radome to avoid vibrations; the bell-shaped form of the Pludix radome avoids water deposition of the radome; no correction for wind effects is carried out on the Pludix; the Pludix measurement volume is defined by an average antenna gain.
The data collected here are contaminated by ground noise signals that are present at the lowest frequencies (<50 Hz), due to interferences of a physical nature. The noise removal is accomplished by detecting a characteristic noise spectrum during a non-rainy day and subtracting it from the measured spectrum when precipitation is detected.
The power signal is inverted to generate the DSD
(mm−1m−3). The actual rainfall rate R (mm h−1) is an
indi-rect product. The drops are classified in constant size inter-vals (0.3 mm); the diameter range varies in 21 size categories from 0.8 to 7.0 mm.
The two disdrometers provide, during the different exper-imental campaigns in a wide sample of Italian climate areas (see Table 1), a wide and unique dataset of DSD for various rainfall events, allowing a classification of the precipitation (into C and S) and a microphysical characterization of the rain episodes.
3 Methodology
To parameterize the DSD, each observed 1-minute spectrum of each event is fitted by an exponential and a gamma DSD.
The parameters of an exponential distribution of type:
N (D) = N0exp(−3D)(mm−1m−3) (1)
where N0(mm−1m−3) is the intercept and 3 (mm−1) the
slope parameter, are computed following Waldvogel (1974). Marshall and Palmer (1948), hereinafter MP, have found a constant value of N0=8000 mm−1m−3 for widespread
mid-latitude rain.
The parameters of a gamma distribution of type:
N (D) = N0Dmexp(−3D)(mm−1m−3) (2)
where m is the shape, N0the intercept (mm−1−mm−3) and
3 the slope parameter (mm−1) (Ulbrich, 1983), are
com-puted following the classical method of moments of Tokay and Short (1996), hereinafter TS.
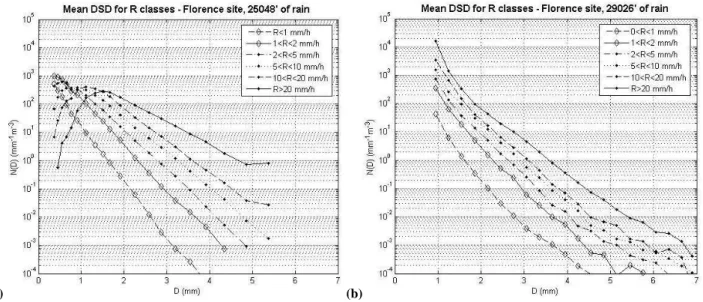
(a) (b)
Fig. 1. Average observed DSDs for the Florence database: JW disdrometer (a) and Pludix disdrometer (b), for six rainfall rate categories.
The disdrometer data are first used to detect (threshold in rainfall rate >0.2 mm/h with at least 10 min of continuous rain) the rain episodes. A global microphysical analysis (re-sults shown in Sect. 4) is successively performed by:
1. analyzing the average DSDs and DSD parameters from the 1-min spectra, classified into six categories of dif-ferent rainfall rate intensities for each database; 2. applying two C/S discrimination algorithms. The first
is a refinement of the gamma DSD-based method pro-posed by Caracciolo et al. (2006a) on JW data in Fer-rara, while the second is implemented observing the Pludix 1-minute exponential DSD parameters for each rain event. The two methods are described in Section 4.2. A complete statistical study is presented, apply-ing the algorithms to each database, to detect the S and C minutes and identify their peculiar characteristics in terms of DSD parameters;
3. computing the Z-R relationship by a linear regression method for each 1-minute spectrum in each database.
4 Experimental results
4.1 Shape and parameters of the drop size distribution for rain categories
Figure 1 shows the observed DSDs for the Florence database, taken as representative, for the two instruments, averaged for six rainfall rate categories: very light (R<1 mm h−1),
light (1≤R<2 mm h−1), moderate (2≤R<5 mm h−1), heavy
(5≤R<10 mm h−1), very heavy (10≤R<20 mm h−1),
ex-treme (R≥20 mm h−1). Each 1-min DSD is classified into
one of the six categories, and subsequently the average is performed for each category over all events in each database. Looking at Fig. 1a (JW disdrometer), the DSDs are al-ways concave downward. This behavior is partly derived from the lack of small drops due to the JW disdrometer dead time problem, highlighted by the sharp decrease in the num-ber of raindrops for diameters lower than 0.6 mm. In ad-dition, for heavy rainfall-rates, the cone water coating may play a role. As the rainfall rate threshold increases, the DSD shifts toward large diameters and is very flat. In the light-precipitation categories, the DSDs have an almost exponen-tial shape and the N0 values are not far from the value of
8000 mm−1m−3, in agreement with the MP findings.
Oth-erwise, the heavy rain events are better parameterized by a gamma DSD. The heavy rain events are, therefore, charac-terized by large m values, caused by the strong downward concavity, while the gamma 3 and N0values generally have
small values (see Table 2). Furthermore, as the rain thresh-old increases, the exponential N0and 3 parameters generally
tend to decrease.
Looking at Fig. 1b, it is noted that, when using the Pludix, the DSDs are always exponential or slightly concave upward. Therefore, instrumental effects (e.g. the lower Pludix drop diameter threshold of 0.8 mm) may affect the rainfall charac-terization of the events. The rise in the number of drops as the rain threshold increases involves all the diameter classes considered by the instrument (the 3 parameter it is quite constant, while N0 increases by about 2-3 orders of
mag-nitudes, here not shown). Such findings are used to provide the new C/S discrimination algorithm described in Section 4.2. The exponential fit works better, especially for the light and very light rain categories. The upper Pludix drop di-ameter threshold of 7.0 mm provides more significant DSD values for heavy rains, even if at mid-latitudes drops larger
14 C. Caracciolo et al.: Precipitation classification at mid-latitudes
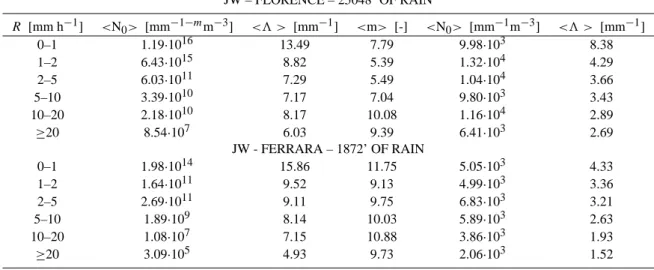
Table 2. Averaged gamma (shape m, intercept N0, slope 3) DSD parameters and exponential (intercept N0and slope 3) DSD parameters
computed with the method of moments (TS) and with the Waldvogel (1974) method, respectively, for six rainfall rate categories for the Florence and Ferrara databases (JW disdrometer).
JW – FLORENCE – 25048’ OF RAIN R [mm h−1] <N0> [mm−1−mm−3] <3 > [mm−1] <m> [-] <N0> [mm−1m−3] <3 > [mm−1] 0–1 1.19·1016 13.49 7.79 9.98·103 8.38 1–2 6.43·1015 8.82 5.39 1.32·104 4.29 2–5 6.03·1011 7.29 5.49 1.04·104 3.66 5–10 3.39·1010 7.17 7.04 9.80·103 3.43 10–20 2.18·1010 8.17 10.08 1.16·104 2.89 ≥20 8.54·107 6.03 9.39 6.41·103 2.69 JW - FERRARA – 1872’ OF RAIN 0–1 1.98·1014 15.86 11.75 5.05·103 4.33 1–2 1.64·1011 9.52 9.13 4.99·103 3.36 2–5 2.69·1011 9.11 9.75 6.83·103 3.21 5–10 1.89·109 8.14 10.03 5.89·103 2.63 10–20 1.08·107 7.15 10.88 3.86·103 1.93 ≥20 3.09·105 4.93 9.73 2.06·103 1.52
than 5–6 mm diameter do not contribute significantly to the rainfall rate.
4.2 Convective – stratiform discrimination
The classical C/S discrimination algorithms fail at these lat-itudes (see e.g. Caracciolo et al., 2006a). Two C/S discrim-ination algorithms are applied. The first is a refinement of the C/S discrimination algorithm proposed by Caracciolo et al. (2006a) using a JW installed in Ferrara. This method con-sists of two classification steps. In Caracciolo et al. (2006a) the classification into C or S precipitation was first performed by considering a threshold in both rain and radar reflectivity: if R is greater than 10 mm h−1, the spectra are considered C.
When R<10 mm h−1, a threshold in reflectivity is imposed
to discriminate between the two categories: Z>38 dBZ C and Z<38 dBZ S. However, these criteria are more suitable to detect with greater accuracy heavy convection and light-moderate S rains; they do not take into account the weak con-vection as well as the strong aggregation (Waldvogel, 1974) often characteristic of S spectra.
Subsequently, the investigation moved on to the behav-ior of a key parameter derived from the knowledge of two gamma DSD parameters (m and 3), the peak (or modal) di-ameter Dpdefined as:
Dp=m/3(mm) (3)
The peak diameter was used to discriminate the two pre-cipitation types. Analyzing the 1-minute time evolution of the peak diameter it was found that in a (3, m) diagram the line (1.6353 – m=1) allows discrimination into the two dif-ferent regimes, with S spectra characterized by lower Dp
val-ues with respect to the C ones.
Using the Florence JW data, the method is refined. Only the first classification step is refined, which has implications for the second step. The new C/S discrimination is based on four criteria, to take into account also shallow C and heavy S rains:
– if R<10 mm h−1and Z<38 dBZ: S rain
– if R>10 mm h−1and Z<38 dBZ: heavy S
– if R≥10 mm h−1and Z≥ 38 dBZ: C
– if R<10 mm h−1and Z>38 dBZ: shallow C
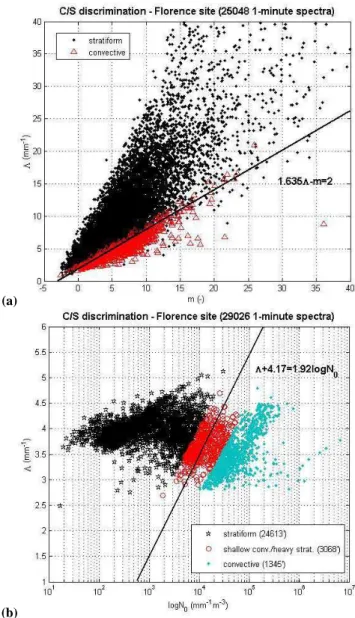
Applying these criteria, a new discrimination (between C/shallowC and S/heavyS spectra) line (1.6353 – m=2) is identified in the (3, m) diagram (see Fig. 2a). Keeping m constant, the S spectra have 3 values greater than the C ones, meaning that the S spectra are characterized by many small drops compared to C spectra. Moreover, keeping 3 constant, the C spectra have m values greater than the S ones, indi-cating a more marked downward concavity, confirming the trend found in Fig. 1a.
Taking into account the results found in Sect. 4.1 (Fig. 1b), a second C/S discrimination algorithm is proposed, using Pludix data.
TS have found that values of R<2.0 mm h−1 are
repre-sentative of S spectra (which lead to significant rain accumu-lation), while values of R>10 mm h−1are representative of
C ones (relatively short in duration and highly fluctuating). The range 2–10 mm h−1is difficult to interprete: this range
can witness the occurrence of spectra of shallow convection as well as heavy S spectra characterized at the ground by the
presence of large drops, formed from strong mechanisms of aggregation in clouds.
From the analysis of Pludix exponential DSD parameters for all Italian databases, it is found that changing from S (with R<2 mm h−1) to C (with R>10 mm h−1)
precipita-tion, 3 is quite constant (it is slightly lower), while N0
in-creases by 2–3 orders of magnitude. Therefore, it is sug-gested that a N0−3 plot can be used as a C/S discrimination,
in which the shallow C and heavy S spectra (with R between 2–10 mm h−1) fall in the middle of the other two categories.
A good discriminator between C/S spectra it is found to be the line:
3 + 4.17 = 1.92 log N0 (4)
which works well for all the Italian databases. Here, only the results for the Florence site, taken as representative (Fig. 2b), are considered.
4.3 Z−R relationship
The relationship between Z and R is generally a power law of the form: Z=ARb, with R in mm h−1and Z in mm6m−3.
This relationship is very important in radar meteorology, the two coefficients A and b reflecting the type of rainfall (e.g. S or C). Generally high A values associated with low b val-ues are representative of C mid-latitude precipitation (F: Fu-jiwara, 1956; J: Jones, 1956; Joss and Waldvogel, 1969). Moreover, the coefficient A is proportional to the average mean equivolumetric diameter D0for the considered period,
while high b values reflect a greater variation of D0.
Table 3 summarizes the Z−R relationships for each database, computed by a linear regression method of 10logZ versus logR (logZ=A + blogR).
Generally, a good agreement is found between theory and past works on mid-latitude continental precipitation (e.g. the ones cited above: JW, J and F reporting A=250,310,200 – b=1.5,1.25,1.45 respectively for widespread/stratiform rain and A=500,480,450 – b=1.5,1.35,1.45 for thunder-storm/convective rain), while marked differences are found when comparing the Z−R relationships with the tropi-cal ones found by TS, reporting Z=139R1.43 for C cases,
Z=367R1.30for S cases and Z=315R1.20for all cases. For
all the Italian databases ACONV>ASTRAT(e.g. for the Ferrara
cases Z=704R1.29is found for the C cases, Z=281R1.35for the S ones). In addition, the Z−R relationships found here are generally not far from the MP one Z=200R1.6found for widespread mid-latitude rain. It can also be noted that there are no significant variations passing from one Italian station to another.
5 Conclusions and future work
The analysis that was performed has allowed the microphys-ical characterization of precipitation occurring in Italy and
(a)
(b)
Fig. 2. Relationship between 3 (mm−1) and m (–) for the
Flo-rence database using the JW disdrometer. The triangles are C 1-minute spectra, the dots S 1-1-minute spectra. The solid line repre-sents the proposed C/S discrimination (a); relationship between N0
(mm−1m−3) and 3 (mm−1) for the Florence database using the
Pludix disdrometer. The dots are C 1-minute spectra, the stars S 1-minute spectra, circles 1-minute shallowC/heavyS spectra. The solid line represents the proposed C/S discrimination (b). The dif-ferent spectra are discriminated by using thresholds in rainfall rate and/or reflectivity values.
the discrimination between C and S rain, given an almost to-tal lack of studies at mid-latitudes. Two different types of disdrometers were used: the classical JW disdrometer and a recent device called Pludix. A high number of different rain episodes were collected, allowing the creation of the most comprehensive database collected in Italy. A global mi-crophysical analysis was performed by computing the Z−R
16 C. Caracciolo et al.: Precipitation classification at mid-latitudes
Table 3. The A and b parameters of the Z=ARbrelationships (Z in mm6m−3and R in mmh−1) for each database computed by a linear
regression method.
Location Intercept A Exponent b
Ferrara (JW) 273 1.48
Bologna (Pludix) 316 0.95
Florence (JW and Pludix) 234 263 1.34 1.02
Turin (Pludix) 277 1.01
South Italy Licata Surigheddu Rotondella (Pludix) 259 257 269 206 0.90 1.02 1.50 0.84
relationships, observing the average DSDs and DSD parame-ters for rain categories, and applying two C/S discrimination algorithms.
The results can be summarized as follows:
1. the rain distribution in Italy is well described by a gamma DSD (a better fit when using the JW disdrom-eter), and only in some cases (especially light rains) by an exponential DSD (a better fit when using Pludix data). The average DSD parameters for rain classes are in agreement with classical values and there are no marked differences passing form one station to another in Italy;
2. the classical C/S discrimination algorithms fail at these latitudes (e.g. the tropical TS). A new C/S discrimi-nation algorithm using Pludix data was implemented, based on parameters of an exponential DSD fitting the observed DSD. The previous C/S discrimination algo-rithm based on a gamma DSD using JW data (Carac-ciolo et al., 2006a) was refined. It is important to note that the C/S discrimination methods based on dis-drometric data are useful for discriminating between weak S and strong C rains. However, they have to be used in combination with polarimetric radar data in the 2<R<10 mm/h range (of difficult interpretation, as sug-gested by many authors, e.g. TS), in which shallow C and heavy S rain can occur.
3. agreement with past works at mid-latitudes in Z-R re-lationships. There are no significant variations passing from one Italian station to another;
4. strong differences are observed in DSD parameters and Z-R relationships on passing from C to S episodes. The use of the disdrometers in the area covered by a mul-tiparametric radar for calibration purposes is suggested and will be implemented in the near future, while radar data might systematically help in C/S discrimination.
Acknowledgements. We acknowledge S. Orlandini, A. Dalla Marta,
and M. Napoli of the Department of Agronomy and Land Manage-ment, University of Florence, for their help in the JW and Pludix
disdrometer installation and data management at the Montepaldi (Florence) site. We also acknowledge A. Piano of the University of Turin for providing the Pludix data.
A part of this work was carried out in the frame of the RIADE (Ricerca Integrata per l’Applicazione di tecnologie e processi innovativi per la lotta alla DEsertificazione) project and of the PRIN 2005 (“Indici di impatto idrometeorico e vulnerabilit`a del terreno”) project.
Edited by: S. C. Michaelides
Reviewed by: two anonymous referees
References
Caracciolo C., Prodi, F., Battaglia, A., and Porc`u, F.: Analysis of the moments and parameters of a gamma DSD to infer precipita-tion properties: a convective stratiform discriminaprecipita-tion algorithm, Atm. Res., 80(2–3), 165–186, 2006a.
Caracciolo C., Prodi, F., and Uijlenhoet, R.: Comparison between Pludix and impact/optical disdrometers during rainfall measure-ment campaigns, Atm. Res., 82(1–4), 137–163, 2006b.
Caracciolo C., Prodi, F., and Casazza, M.: Atmospheric precipita-tion analysis using both disdrometric and satellite data for de-sertification studies, Proc. ERAD Conference 2006, 191–194, 2006c.
Doviak, R. J. and Zrnic, D. S.: Doppler radar and weather observa-tions, Academic Press, California, 1993.
Fujiwara, M.: Raindrop size distribution from individual storms, J. Atmos. Sci., 22, 585–591, 1965.
Jones, D. M. A.: Rainfall drop size distribution and radar reflectiv-ity, Rep. No. 6, Illinois State Water Survey, Urbana, IL, 20 pp., 1956.
Joss, J. and Waldvogel, A.: Ein Spektrograph fuer Nieder-schlagstropfen mit automatischer Auswertung, Pure Appl. Geo-phys., 68, 240–246, 1967.
Joss, J. and Waldvogel, A.: Raindrop size distribution and sampling size errors, J. Atmos. Sci., 26, 566–569, 1969.
Krajewski W. F., Kruger, A., Caracciolo, C., Gol´e, P., Barthes, L., Creutin, J.-D., Delahaye, J.-Y., Nikolopoulos, E. I., Ogden, F., Vinson, J.-P.: DEVEX-Disdrometer Evaluation Experiment: Ba-sic results and implications for hydrologic studies, Adv. in Water Res., 29, 311–325, 2006.
Marshall, J. S. and Palmer, W. M.: The distribution of raindrops with size, J. Meteor., 5, 165–166, 1948.
Prodi, F., A. Tagliavini, F. Pasqualucci: Time variability in rainfall events observed by Pludix, Phys. Chem. Earth (B), 25(10–12), 959–963, 2000.
Testud J., Oury, S., Blank, R. A., Amayenc, P., Dou, X.: The con-cept of “Normalized” distribution to describe raindrop spectra: a tool for cloud physics and cloud remote sensing, J. Appl. Met., 40, 1118–1140, 2001.
Tokay, A. and Short, D.: Evidence from tropical raindrop spectra of the origin of rain from stratiform versus convective, J. Appl. Meteor., 35, 355–371, 1996.
Ulbrich, C.: Natural Variations in the analytical form of the raindrop size distribution, J. Clim. and Appl. Meterol., 22, 1764–1775, 1983.
Waldvogel, A.: The N0jump of raindrop spectra, J. Atmos. Sci., 31, 1067–1078, 1974.
Wolff D. B., Marks, D. A., Amitai, E., Silberstein, D. S., Fisher, B. L., Tokay, A., Wang, J., and Pippitt, J. L.: Ground validation for the Tropical Rainfall Measuring Mission (TRMM), J. Atmos. Ocean. Technol., 22, 365–380, 2005.
Zawadski I., Monteiro, E., and Fabry, F.: The development of drop size distributions in light rain, J. Atm. Sci., 51, 1100–1113, 1994.