HAL Id: hal-00317458
https://hal.archives-ouvertes.fr/hal-00317458
Submitted on 1 Jan 2002
HAL is a multi-disciplinary open access
archive for the deposit and dissemination of
sci-entific research documents, whether they are
pub-lished or not. The documents may come from
teaching and research institutions in France or
abroad, or from public or private research centers.
L’archive ouverte pluridisciplinaire HAL, est
destinée au dépôt et à la diffusion de documents
scientifiques de niveau recherche, publiés ou non,
émanant des établissements d’enseignement et de
recherche français ou étrangers, des laboratoires
publics ou privés.
Effects of temperature dependence of reaction N2(A3
S+u) + O ongreenline dayglow emission
A. K. Upadhayaya, V. Singh
To cite this version:
A. K. Upadhayaya, V. Singh. Effects of temperature dependence of reaction N2(A3 S+u) + O
ongreenline dayglow emission. Annales Geophysicae, European Geosciences Union, 2002, 20 (12),
pp.2039-2045. �hal-00317458�
Annales
Geophysicae
Effects of temperature dependence of reaction N
2
(A
3
P
+
u
)+
O on
greenline dayglow emission
A. K. Upadhayaya and V. Singh
Department of Physics, IIT Roorkee 247667, India
Received: 7 February 2002 – Revised: 3 July 2002 – Accepted: 4 July 2002
Abstract. The greenline dayglow emission profiles
mea-sured by the Wind Imaging Interferometer (WINDII) on the Upper Atmosphere Research Satellite (UARS) are modelled using recently proposed revisions to the temperature depen-dent rate coefficient of the reaction N2(A3P+u)+O in the glow model. The volume emission rates of greenline day-glow emissions are calculated using the Hinteregger et al. (1981) and Tobiska (1991) solar flux models. It is found that the average modelled profiles obtained using the Hinteregger et al. (1981) solar flux model with the temperature depen-dent rate coefficient and a quantum yield of 0.36 for the re-action N2(A3P+u)+O agree to within 8% of the observed profiles in the thermospheric peak region, which shows sig-nificant improvement over the earlier results (20% smaller than WINDII results) obtained using the temperature inde-pendent reaction rate coefficient. On the other hand, the av-erage modelled profiles obtained with a temperature depen-dent rate coefficient in the Tobiska (1991) solar flux model are about 12% higher than the WINDII results, whereas with the temperature independent rate coefficient the results are about 10% smaller than the WINDII results in the thermo-spheric peak region. The present study reveals that the emis-sion profiles obtained using the Hinteregger et al. (1981) so-lar flux model, along with the temperature dependent rate coefficient and a quantum yield of 0.36 for the reaction N2
(A3P+u)+O in glow model, reproduce the thermospheric emission peak as observed by WINDII, a capability which eluded earlier models. These findings support the newly dis-covered temperature dependence of the rate coefficient of re-action N2(A3P+u)with O.
Key words. Ionosphere (ionization mechanisms; modeling
and forecasting; general or miscellaneous)
1 Introduction
In recent years, a number of studies have been done to ex-amine the greenline dayglow emission (Wittase et al., 1999;
Correspondence to: V. Singh (virphfph@iitr.ernet.in)
Singh and Tyagi, 1997; Singh et al., 1996; Torr et al., 1993; Bates 1990; Akmaev and Shved, 1980; Frederick et al., 1976; Feldman et al., 1971; Wallace and Mc Elory, 1966). These studies have given the theoretical models, as well as the ex-perimental data for this important atomic oxygen emission at 5577 ˚A. Though the theoretical models have taken into ac-count all the well-known sources of greenline dayglow emis-sion, along with the latest atmospheric parameters such as collision cross sections, reaction rate coefficients and quan-tum yields, these models are still unable to explain the mea-surements. These models need further refinement so that a better agreement may be achieved between the model results and the experimental observations. Further, the global mea-surements of dayglow greenline are needed for comparison purposes. The available database on the greenline dayglow emission has recently been expanded as a result of observa-tions made with the Wind Imaging Interferometer (WINDII) on board the Upper Atmosphere Research Satellite (Shep-herd et al., 1993). In the thermospheric emission peak region, photoelectron impact excitation of O, dissociative recombi-nation of O+2 and the reaction of N2(A3P+u)with O are the
major sources of O(1S). The cross sections, quantum yields and reaction rate coefficients for the first two processes have been found consistent with the dayglow emissions. On the other hand, the quantum yield of O(1S) production due to the reaction N2(A3P+u)with O has been the subject of consid-erable discussion in the literature (Frederick et al., 1976; Torr et al., 1993; Bucsela et al., 1998). In their analysis, Singh et al. (1996) and Tyagi and Singh (1998) used the value of 0.36 for the quantum yield, since it gave the best global fit to all of the measured profiles. However, with this value the model was found to underestimate the measured profiles in the ma-jority of the cases in the thermospheric emission peak region. In the model calculations of Singh et al. (1996) and Tyagi and Singh (1998), the reaction rate coefficient for the reaction N2(A3P+u) + O was used from Piper et al. (1981). Recently, Hill et al. (2000) have proposed revisions to this rate coef-ficient based on their analysis of middle-ultraviolet (MUV) measurements from the rocket-borne MUSTANG spectrom-eter and the shuttle-borne GLO spectromspectrom-eter. The major
2040 A. K. Upadhayaya and V. Singh: Effects of temperature dependence finding of Hill et al. (2000) is that the rate coefficient for the
reaction N2(A3P+u)with O is temperature dependent. This new finding is very important as it has a major impact on earlier dayglow model results, in particular on the greenline dayglow emission.
Recently, Witasse et al. (1999) have modelled O(1S) ther-mospheric dayglow at higher latitudes and higher solar zenith angles (76◦−84◦) using the TRANSCAR model. This model also underestimated the emission rate in the vicinity of the thermospheric peak in two out of the three cases they con-sidered. For solar zenith angles greater than 70◦, the thermo-spheric peak is found above 180 km, where the impact of the N2(A3P+u)reaction is minimal. The authors suggest that the cause of the discrepancy above 180 km might be due to the underestimation of superthermal electron impact (photo-electron flux).
A key problem in the modelling of the dayglow is the ap-propriate use of solar EUV flux. These solar EUV fluxes are involved in direct and indirect processes of excitation of at-mospheric species which result in the production of airglow emissions. Hinteregger et al. (1981) and Tobiska (1991) are the two respective models which provide the solar fluxes un-der different solar activity conditions. Though these models take into account the variation of solar activity, they have dif-ferent scaling techniques. Consequently, both of these mod-els provide quite different solar EUV fluxes. One should ex-ercise more care in using the solar EUV flux models.
In this paper, we present a re-analysis of the greenline day-glow emission profiles between 120–250 km measured by WINDII on board the Upper Atmosphere Research Satellite (UARS) in light of the proposed temperature dependence of the rate coefficient for the reaction N2(A3P+u)with O. The glow model is updated using the temperature dependent rate coefficient of the reaction N2(A3P+u)+O, and the volume emission rates (VER) of the greenline dayglow emission are calculated using the Hinteregger et al. (1981) and Tobiska (1991) solar EUV flux models.
2 Model
Mechanisms for the production of the O(1S) dayglow emis-sions have been discussed by Tyagi and Singh (1998). In the lower thermosphere the four major sources for these emis-sions are the photoelectron impact excitation of atomic oxy-gen, dissociative recombination of O+2, energy transfer to atomic oxygen from N2 (A3P+u)and photodissociation of molecular oxygen. In the model calculations presented be-low, the same parameters as used by Tyagi and Singh (1998) are being used, with the exception that the temperature de-pendence of the rate coefficient of the reaction N2(A3P+u)+ O, as proposed by Hill et al. (2000), is now included. The new rate coefficients for the v′=0, 1 and 2 vibrational lev-els are (3.4±0.8) × 10−11(T/298)0.5, (5.6 ±1.3) × 10 − 11 (T/298)0.5 and (4.8 ± 1.2)−11(T/298)0.5, respectively. In the present calculations we have only used the rate coefficient for v′ = 0, because for higher vibrational levels the branching
ratio is not known. The branching ratio can only be known if the photoelectron impact excitation cross sections for the N2(A3P+u)state are known separately for vibrational lev-els v′ = 0, 1 and 2. Unfortunately, these individual cross sections are not available in the literature. However, the to-tal photoelectron impact excitation cross section for the N2
(A3P+u)state is known, which includes all the possible vi-brational levels. Consequently, we have assumed that the N2
(A3P+u)state is produced in the v′ = 0 vibrational state. The density of N2(A3P+u)for v′ = 0 level is obtained un-der a photochemical equilibrium condition. This assumption may be of some error. However, it was the conclusion of Hill et al. (2000) that the higher vibrational levels contribute less to the production of O(1S), and this finding has been supported in the theoretical work of Kirillov (1997). It has been pointed out in the Introduction that the quantum yield of O(1S) production due to the reaction of N2(A3P+u)with O has been the subject of considerable discussion in recent years. Hill et al. (2000) have given a very detailed history of the quantum yield. The various values of the quantum yield, which range from 0.36 to 0.75, have been obtained using air-glow and auroral studies by various workers (Frederick et al., 1976; DeSouza et al., 1985; Singh et al., 1996; Bucsela et al., 1998; Strickland et al., 2000). Hill et al. (2000) pro-posed a value of 0.47 ± 0.17 of the quantum yield for the reaction N2(A3P+u)+O. Consequently, we have used the
values of 0.36, 0.47 and 0.75 for the quantum yield of O(1S) production due to the reaction N2(A3P+u)+O, to obtain the O(1S) emission profiles. These three values are used in the model to compare the O(1S) emission rates with the WINDII observations and to find out the suitable value which would give better agreement with the WINDII measurements. The O(1S) emission profiles are obtained using the production rates from the various sources discussed above and by tak-ing into account the appropriate loss processes (Stak-ingh et al., 1996) under photochemical equilibrium conditions. The so-lar EUV flux plays a very important role in the production of dayglow emissions. The results are quite sensitive to the values of solar irradiance. Consequently, one should exer-cise care in using the solar EUV flux model. Hinteregger et al. (1981) and Tobiska (1991) are the two respective models which provide the solar EUV fluxes under different solar ac-tivity conditions. Though these models take into account the variation of solar activity, they have different scaling tech-niques. Consequently, both of these models provide quite different solar EUV fluxes. Therefore, it would be more ap-propriate to make use of both of these models in the calcu-lations and to find out which model gives a better agreement with the measurements.
In the Hinteregger et al. (1981) model the solar EUV flux is scaled using a parameterization method based on daily 10.7 cm solar radio flux and its 81-day average flux. The ref-erence solar spectrum is chosen from SC# 21 REF. For ioniz-ing EUV, Hinteregger et al. (1981) have used a contrast ratio method which is based on the bin structure very similar to Torr and Torr (1985). The Lyman α and Fe XVI (335 ˚A) en-hancement ratios are used to account for solar activity. The
following equations are used for the scaling of solar flux: SFLUX = [RFLUX + {(R1−1)S1+ (R2−1) × S2}/1000] ,
Where SFLUX is scaled solar Flux, and RFLUX is refer-ence solar Flux. S1are scaling factosr for Fe (XVI) coronal
emission (335 ˚A), R1= 1+ 0.0138 × (F10.7A–71.5) + 0.005
×(F10.7–F10.7A + 3.9), and R2= 1+ 0.59425 × (F10.7A–
71.5) + 0.3811 × (F10.7–F10.7A + 3.9). There are 59 values for each S1 and S2, which corresponds to 59 bins of solar
spectrum (the values of S1and S2are given in the subroutine
SSFLUX of the glow model).
In the Tobiska (1991) model the solar EUV flux is scaled using a parameterization method based on the Lyman α slope for chromospheric fluxes and an He I 10830 ˚A equivalent width. This model also takes into account the daily 10.7 cm solar radio flux and its 81-day average flux. The following equations have been used by Tobiska (1991) for scaling the solar flux:
SFLUX = TCHRO + TCHR1 × HLYMOD + TCHR2
×HEIMOD + TCORO + TCOR1 × F10.7 + TCOR2 × F10.7A.
where
TCHRO = Intercept of chromospheric fluxes, EUV 91 model.
TCHR1 = H Lyman ∝ slope for chromospheric fluxes.
TCHR2 = He Fluxes 10 830 ˚A equivalent width slope for chromospheric fluxes.
TCOR0 = Intercept for coronal fluxes. TCOR1 = F10.7 slope for coronal fluxes. TCOR2 = F10.7A slope for coronal fluxes.
HLYMOD = HEIEW ×3.77847 × 10⁹+8.40317 × 10¹⁰ (for HEIEW > 0.001).
HLYMOD = 8.70E8 × F10.7 + 1.90 ×10¹¹ (for HEIEW ≤ 0.001). HLYMOD = HLYA (for HLYA > 0.001).
HEIMOD = HEIEW ×3.77847 × 10⁹+8.40317 × 10¹⁰ (for HEIEW > 0.001).
HEIMOD = HLYMOD (for HEIW ≤ 0.001).
where HEIEW = He I 10830 ˚A equivalent width HLYA = H Lyman ∝ flux. The values of the above parameters are listed in the subroutine SSFLUX of glow model.
3 Results and discussion
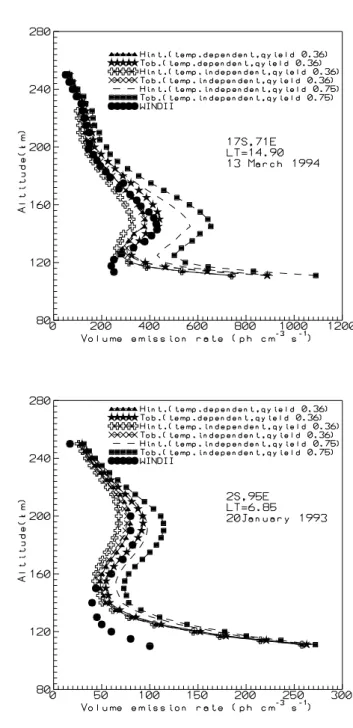
The 5577 ˚A dayglow volume emission rates (VER) are calcu-lated at several latitudes and local times for which WINDII data is available in both hemispheres. For illustration pur-poses, we have chosen eight cases at various latitudes and local times in both hemispheres. The measured and mod-elled VER for these cases are shown in Figs. 1–5. The VER are calculated using Hinteregger et al. (1981) and Tobiska (1991) solar EUV flux models. In Fig. 1 we have shown the comparison between the emission profiles obtained us-ing the quantum yield of 0.36 and 0.75, along with WINDII
Fig. 1. Comparison between the observed and modelled O(1S) VER profiles. The darkened triangles and darkened asterisks are for the Hinteregger et al. (1981) and Tobiska (1991) solar EUV flux mod-els with the temperature dependent rate coefficient of reaction N2
(A3P+u)+O and a quantum yield of 0.36. The plus and the mul-tiplication signs are for the Hinteregger et al. (1981) and Tobiska (1991) solar EUV flux models with the temperature independent rate coefficient of reaction N2(A3P+u)+O and a quantum yield
of 0.36. The dashed line and the darkened squares are for the Hin-teregger et al. (1981) and Tobiska (1991) solar EUV flux models with the temperature independent rate coefficient of reaction N2
(A3P+u)+O and a quantum yield of 0.75. The darkened circles are the observed VER from WINDII.
observations for both the solar EUV flux models. It is quite clear from the profiles shown in Fig. 1 that the results
ob-2042 A. K. Upadhayaya and V. Singh: Effects of temperature dependence
Fig. 2. Comparison between the observed and modelled O(1S) VER profiles. The darkened triangles and darkened asterisks are for the Hinteregger et al. (1981) and Tobiska (1991) solar EUV flux mod-els with the temperature dependent rate coefficient of reaction N2
(A3P+u)+O and a quantum yield of 0.36. The plus and the mul-tiplication signs are for the Hinteregger et al. (1981) and Tobiska (1991) solar EUV flux models with the temperature independent rate coefficient of N2(A3P+u)+O and a quantum yield of 0.36.
The dashed line and the darkened squares are for the Hinteregger et al. (1981) and Tobiska (1991) solar EUV flux models with the temperature dependent rate coefficient of reaction N2(A3P+u)+
O and a quantum yield of 0.47. The darkened circles are the ob-served VER from WINDII.
tained using the temperature dependent rate coefficient (Hill et al., 2000) and the Hinteregger et al. (1981) solar EUV flux model (with quantum yield 0.36) are in very good agreement with the WINDII observations, and they reproduce the
ther-Fig. 3. Same as in ther-Fig. 2 but at different latitudes and local times.
mospheric peak as observed from WINDII within an error of 8%. It is also quite clear from the Fig. 1 that the VER la-belled as Hint. (temp. independent, qyield 0.36), obtained using Hinteregger et al. (1981) solar EUV flux model with temperature independent rate coefficient (Piper et al., 1981), are significantly smaller than the measured emission rates in the thermospheric peak region. Further, it is noticeable from Fig. 1 that the emission profiles obtained using the quantum yield of 0.75, along with the temperature independent rate coefficient taken from the Piper et al. (1981), are significantly higher than the WINDII observations for both the solar EUV flux models. These results indicate that the quantum yield of 0.75, which was proposed by Piper et al. (1981), is not suitable to explain the WINDII observations.
Fig. 4. Modelled and measured greenline dayglow emission profiles for selected observing (WINDII) conditions along with the various contributions of the O(1S) production processes.
the emission profiles obtained using the quantum yield of 0.36 and 0.47 (Hill et al., 2000). It is quite evident from Figs. 2 and 3 that the results obtained using the temperature dependent rate coefficient (Hill et al., 2000) and the Hintereg-ger et al. (1981) solar EUV flux model (with quantum yield 0.36) are in very good agreement with the WINDII observa-tions, and they reproduce the thermospheric peak as observed from WINDII within an error of 8%. It is also quite evident from Figs. 2 and 3 that the emission profiles obtained using the quantum yield of 0.47, as proposed by Hill et al. (2000), are about 20% and 40% higher than the WINDII observations for Hinteregger et al. (1981) and Tobiska (1991) solar EUV flux models, respectively, in the thermospheric peak region.
Fig. 5. Same as in Fig. 4. but at different latitudes and local times.
The individual components of O(1S) production due to various sources are shown in Figs. 4 and 5 for both solar EUV flux models. Two representative cases, one at local noontime and other in the afternoon, have been chosen. A value of 0.47 is used for the quantum yield of reaction N2(A3P+u) with O. It is noticeable from these figures that the reaction of N2 (A3P+u)with O is the dominating source of O(1S) between 130 and 170 km. In the earlier studies of Singh et al. (1996) and Tyagi and Singh (1998), which were based on the temperature independent rate coefficient of the reaction N2 (A3P+u)+O and a quantum yield of 0.36, the contri-bution of this reaction was comparable with that of the dis-sociative recombination reaction O+2 + e between 130 and 170 km. Further, it is quite evident from Figs. 4 and 5 that the photodissociation of O2becomes the major source of O(1S)
2044 A. K. Upadhayaya and V. Singh: Effects of temperature dependence
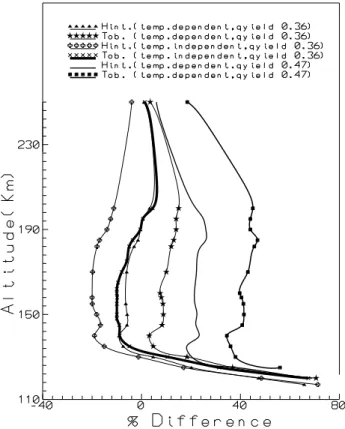
Fig. 6. The mean % difference in the VER between the observa-tions (WINDII) and modelled results. The darkened triangles and darkened asterisks are for the Hinteregger et al. (1981) and Tobiska (1991) solar EUV flux models with the temperature dependent rate coefficient of reaction N2 (A3P+u)+ O and a quantum yield of
0.36. The plus and the multiplication signs are for the Hinteregger et al. (1981) and Tobiska (1991) solar EUV flux models with the temperature independent rate coefficient of reaction N2(A3P+u)+
O and a quantum yield of 0.36. The dashed line and the darkened squares are for the Hinteregger et al. (1981) and Tobiska (1991) so-lar EUV flux models with the temperature dependent rate coefficient of reaction N2(A3P+u)+O and a quantum yield of 0.47.
below 120 km. The O(1S) emission profiles obtained in the present model are significantly higher than the WINDII ob-servations below 120 km. The main problem for this discrep-ancy arises from the scaling of solar fluxes between 900 ˚A and 1350 ˚A. This problem can only be resolved if the simul-taneous measurements of solar flux are available for the day on which measurements have been taken for O(1S) dayglow emission.
Further, it is quite evident from Figs. 1–3 that the emis-sion rates obtained using the Tobiska (1991) solar EUV flux model (with quantum yield 0.36) and the temperature inde-pendent reaction rate coefficient of N2(A3P+u)+O are also in good agreement (with in 10%) with the measured emission rates, whereas the emission rates obtained with the tempera-ture dependent rate coefficient are marginally higher (about 12%) than the measured emission rates. One may also no-tice that the emission rates obtained from the Tobiska (1991) solar EUV flux model are about 20–30% higher than those
emission rates obtained from the Hinteregger et al. (1981) solar EUV flux model in all the corresponding cases. The main reason of this difference is due to the fact that the To-biska flux model provides about 20–30% higher values of EUV flux than that of the Hinteregger et al. (1981) solar EUV flux model below the 300 ˚A wavelength. The energy associated with solar radiation below 300 ˚A is responsible mainly for the production of greenline dayglow emission in the thermosphere (above 120 km). Consequently, the Tobiska (1991) solar EUV flux model would provide higher values of emission rates than those obtained from the Hinteregger et al. (1981) solar EUV flux model.
The mean percentage difference of the unrevised and the revised results with the WINDII results are shown in Fig. 6, for both the solar EUV flux models. The mean VER is ob-tained from the analysis of several greenline dayglow pro-files (twenty in numbers) at various latitudes and local times in both hemispheres. The percentage difference between the modelled and WINDII results is calculated at a partic-ular altitude for each profile. After obtaining the percent-age difference at a particular altitude, the simple averpercent-age is obtained for all the emission profiles. One can notice from Fig. 6 that the revised results obtained from the Hinteregger et al. (1981) solar EUV flux model are within 8% agreement with the WINDII results between 120 and 200 km, which shows significant improvement over the corresponding un-revised results. In case of the Tobiska (1991) solar EUV flux model, the VER with the temperature independent rate coef-ficient are 10% smaller than the WINDII results between 120 to 200 km. It is also evident from Fig. 6 that the VER ob-tained with the temperature dependent rate coefficient in the Tobiska (1991) solar EUV flux model are about 12% higher than the WINDII results between 120 and 200 km. One can also notice in Fig. 6 that the VER obtained using a quantum yield of 0.47 with the temperature dependent rate coefficient are about 20% and 40% higher than the WINDII results for the Hintergger et al. (1981) and Tobsika (1991) solar EUV flux models, respectively, in the thermospheric peak region (120–200 km).
The following points have emerged from the above discus-sion:
1. The VER obtained using the Hinteregger et al. (1981) solar EUV flux model, along with the temperature de-pendent rate coefficient and a quantum yield of 0.36 for the reaction N2 (A3P+u)+O, are in very good agree-ment with the WINDII results in the thermospheric peak region.
2. The VER obtained using the Tobiska (1991) solar EUV flux model, along with the temperature dependent rate coefficient and a quantum yield of 0.36 for the reac-tion N2 (A3P+u)+ O, are about 12% higher than the WINDII results in the thermospheric peak region. 3. The VER obtained using the temperature dependent rate
and 40% higher than the WINDII results for the Hin-tergger et al. (1981) and Tobsika (1991) solar EUV flux models, respectively, in the thermospheric peak region.
4 Conclusions
The temperature dependence of the rate coefficient of re-action N2 (A3P+u)+O proposed by Hill et al. (2000) has been incorporated in the glow model. The VER profiles are obtained using the Hinteregger et al. (1981) and the Tob-sika (1991) solar EUV flux models. A comparative study of VER has been done at various latitudes and local times in both hemispheres. This study reveals that the emission pro-files obtained using the Hinteregger et al. (1981) solar EUV flux model, along with the temperature dependent rate co-efficient and a quantum yield of 0.36 for the reaction N2
(A3P+u)+O, reproduce the thermospheric peak (within 8%) as observed by WINDII. These findings support the newly discovered temperature dependence of the rate coefficient of reaction N2(A3P+u)with O. However, based on the discus-sion as given above in the text, it is extremely difficult to have any firm conclusion regarding the temperature dependence of rate coefficient of the reaction N2(A3P+u)+O in the case of the Tobiska (1991) solar EUV flux model.
Acknowledgements. The authors thank G. G. Shepherd and I. C.
McDade, York University, Canada for providing the WINDII data. One of us (AKU) thanks I.S.R.O. Banglore for the financial support. This work is financially supported by the RESPOND programme of I.S.R.O.
Topical Editor D. Murtagh thanks T. Slanger and D. Gattinger for their help in evaluating this paper.
References
Akmaev, R. A. and Shved, G. M.: Modelling of the composition of the lower thermosphere taking accounts of the dynamics with application of tidal variation of the (OI) 5577 ˚A airglow, J. Atmos. Terr. Phys., 42, 705, 1980.
Bates, D. R.: Oxygen green and red line emission and O+2 dissocia-tive recombination, Planet. Space Sci., 38, 889, 1992.
Bucsela, E. J., Dymond, K. F., McCoy, R. P., and Cleary, D. D.: Atomic and molecular emissions in the MUV dayglow, J. Geo-phys. Res., 103, 29 215, 1998.
DeSouza, A. R., Gousset, G., Touzeau, M., and Kheit, T.: Note on the determination of the efficiency of the reaction N2(A3P+u)
+ O(3P) → N2+ O(1S), J. Phys. B At. Mol. Phys., 18, L661, 1985.
Feldman, P. D., Doering, J. P., and Zipf, E. C.: Excitation of O(1S) atoms in the day airglow, J. Geophys. Res., 76, 3087, 1971. Frederick J. E., Rusch, D. W., Victor, G. A., Sharp,W. E., Haya,
P. B., and Brinton, H. C.: The OI (15500 ˚A) airglow: obser-vations and excitation mechanism, J. Geophys. Res., 81, 3923, 1976.
Hinteregger, H. E., Fukui, K., and Gilson, B. R.: Observational references and model data on solar EUV from measurements on AE-E, Geophys. Res. Lett., 8, 1147, 1981.
Hill, S. M.,Solomon, S. C., Cleary, D. D., and Broadfoot, A. L.: Temperature dependence of the reaction N2(A3P+u)+ O in the
terrestrial thermosphere, J. Geophys. Res., 105, 10 615, 2000. Kirillov, A.: Application of Landau-Zener approximation in the
cal-culation of rate coefficients of reaction N2(A3P+u)+ O(3P)→
N2(X1P+g) + O(3P,1D,1S), paper presented at the 24th Annual European Meeting on Atmospheric studies by Optical methods, Andenes, Norway, 1997.
Piper, L. G., Caledonia, G. E., and Kennealy, J. P.: Rate constants for deactivation of N2(A3P+u), v′= 0,1) by O, J. Chem. Phys.,
75, 2847,1981.
Shepherd, G. G, Thuiller, G., and Gault, W. A. et al.: WINDII, the Wind Imaging Interferometer on the Upper Atmosphere Re-search Satellite, J. Geophys. Res., 98, 10 725, 1993.
Strickland, D. J., Hecht, J. H., Christensen, A. B., and McEwen, D. J.: Thermospheric disturbance recorded by photometers on-board the ARIA II rocket, J. Geophys. Res., 105, 2461, 2000. Singh, V., Mcdade, I. C., Shepherd, G. G., Solheim, B. H., and
Ward, W. E.: The O(1S) dayglow emissions as observed by the WIND imaging interferometer on the UARS, Ann. Geophysicae, 14, 637, 1996.
Singh, V. and Tyagi, S.: Study of O(1S) dayglow emission near equatorial latitude, Indian J. Radio Space Phys., 26, 36, 1997. Tobiska, W. K.: Revised solar extreme ultraviolet flux model, J.
Atmos. Terr. Phys., 53, 1005, 1991.
Torr, M. R. and Torr, D. G.: Ionization frequences for solar cycle 21, revised, J. Geophys. Res., 90, 665, 1985.
Torr, D. G., Torr, M. R., and Richard, P. G.: Thermospheric air-glow emissions: A comparision of measurements from Atlas I and theory, Geophys. Res. Let., 20, 519, 1993.
Tyagi, S. and Vir Singh: The morphology of oxygen green line day-glow emission, Ann. Geophysicae, 16, 1599, 1998.
Wallace, L. and McElroy, M. B.: The visual dayglow, Planet Space Sci., 14, 667, 1966.
Witasse, O., Lilensten, J., Lathuilere, C., and Blelly, P. L.: Mod-eling the OI630.0 and 557.7 nm thermospheric dayglow during EISCAT-WINDII coordinated measurements, J. Geophys. Res., 104, 24 639, 1999.