Formal meeting of Member States to conclude the work on the comprehensive global monitoring framework, including indicators, and a set of voluntary global targets for the prevention and control of noncommunicable diseases
Geneva, 5–7 November 2012
A/NCD/INF./1 31 October 2012
Provisional agenda item 4
A draft comprehensive global monitoring
framework, including indicators, and a set of
voluntary global targets for the prevention and
control of noncommunicable diseases
INTRODUCTION1. Noncommunicable diseases (NCDs) are currently the leading global cause of death. In 2008, of the 57 million deaths that occurred globally, 36 million – almost two thirds – were due to NCDs, comprising mainly cardiovascular diseases, cancers, diabetes and chronic lung diseases. The combined burden of these diseases is rapidly increasing in lower-income countries. About one fourth of the global NCD-related deaths occur before the age of 60 years.
2. A large proportion of NCDs are preventable. They share modifiable behavioural risk factors such as tobacco use, unhealthy diet, lack of physical activity, and the harmful use of alcohol. These risk factors lead to overweight and obesity, raised blood pressure and raised cholesterol. If no action is taken, over the next three decades, the cost of the NCD burden will amount to trillions of dollars of lost resources. Feasible and cost-effective interventions to reduce the burden and impact of NCDs exist, and sustained action to prevent risk factors and improve health care can avert millions of preventable premature deaths.
3. The action plan for the global strategy for the prevention and control of noncommunicable diseases addresses key components: surveillance, prevention, and health care. Surveillance aims to monitor NCDs, and to analyse their social, economic, behavioural and political determinants in order to provide guidance for policy, legislative and financial measures.
4. The importance of surveillance and monitoring of progress made in the prevention and control of NCDs was emphasized during the High-level Meeting of the General Assembly on the Prevention and Control of Non-Communicable Diseases, which was held on 19 and 20 September 2011 in New York. Resolution 66/2 on the Political Declaration of the High-level Meeting of the General Assembly on the Prevention and Control of Non-Communicable Diseases was adopted by the General Assembly on 19 September 2011. It calls upon the World Health Organization, before the end of 2012, to:
• develop a comprehensive global monitoring framework, including a set of indicators, capable of application across regional and country settings, including through multisectoral process, to monitor trends and to assess progress made in the implementation of national strategies and plans on NCDs;
• prepare recommendations for a set of voluntary global targets for the prevention and control of NCDs.
5. The Political Declaration also urges Member States to consider the development of national targets and indicators, based on national situations, building on guidance provided by WHO.
6. The World Health Assembly in decision WHA65(8), inter alia, recognized the significant progress made in close collaboration with Member States pursuant to paragraphs 61 and 62 of the Political Declaration of the High-level Meeting of the General Assembly on the Prevention and Control of Non-communicable Diseases; decided to adopt a global target of a 25% reduction in premature mortality from noncommunicable diseases by 2025; expressed strong support for additional work aimed at reaching consensus on targets relating to the four main risk factors, namely tobacco use, unhealthy diet, physical inactivity and harmful use of alcohol; noted the wide support expressed by Member States and other stakeholders around global voluntary targets considered so far including those relating to raised blood pressure, tobacco use, salt/sodium and physical inactivity, and indicated support from Member States and other stakeholders for the development of targets relating to obesity, fat intake, alcohol, cholesterol and health system responses such as availability of essential medicines for noncommunicable diseases.
7. This revised discussion paper, requested by the Health Assembly of the Director-General in decision WHA65(8), outlines a draft comprehensive monitoring framework, including a set of indicators and examples of voluntary global targets, and takes into account measurability, feasibility, achievability and WHO’s existing strategies in this area. It builds on earlier discussion papers that were published in 2011 and 2012.1
PART 1: A DRAFT GLOBAL MONITORING FRAMEWORK FOR NCDS, INCLUDING A SET OF INDICATORS
8. Global monitoring serves to raise awareness and reinforce political commitment for stronger and coordinated global action on NCD prevention and control.
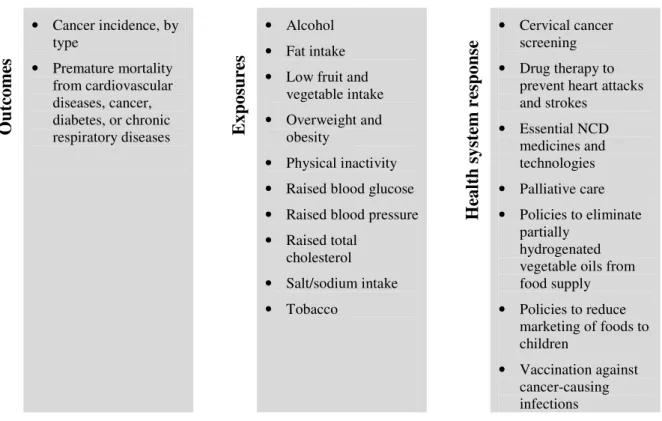
9. A comprehensive monitoring framework (see Figure 1) should include relevant outcomes (mortality and morbidity), exposures (risk factors), and health system capacity and response – with emphasis on priorities contained in the Political Declaration. The global monitoring framework, including the proposed set of indicators, will provide internationally comparable assessments of the status of NCD trends over time, and help to benchmark the situation in individual countries against others in the same region, or in the same development category.
10. In addition to the indicators outlined in this global monitoring framework, countries may include other indicators to monitor progress of national strategies for the prevention and control of NCDs, taking into account country-specific situations.
1 As published on the WHO web site on 25 July. Available at:
Figure 1. Draft global monitoring framework for NCDs O u tc o m es • Cancer incidence, by type • Premature mortality from cardiovascular diseases, cancer, diabetes, or chronic respiratory diseases E x p o su re s • Alcohol • Fat intake • Low fruit and
vegetable intake • Overweight and
obesity
• Physical inactivity • Raised blood glucose • Raised blood pressure • Raised total cholesterol • Salt/sodium intake • Tobacco H ea lt h s y st em r es p o n se • Cervical cancer screening • Drug therapy to
prevent heart attacks and strokes • Essential NCD medicines and technologies • Palliative care • Policies to eliminate partially hydrogenated vegetable oils from food supply • Policies to reduce marketing of foods to children • Vaccination against cancer-causing infections
Indicators for NCD surveillance within the global monitoring framework
11. Table 1 presents a set of indicators for global monitoring of progress towards reducing the impact of NCDs. The indicators, covering the three components of the global monitoring framework (outcomes, exposures and health system response), are listed in alphabetical order within each component.
Table 1. Indicators for NCD surveillance
Outcomes:
• Cancer incidence, by type of cancer per 100 000 population.
• Unconditional probability of dying between ages 30 and 70 years from cardiovascular diseases, cancer, diabetes, or chronic respiratory diseases.
Exposure to risk factors:
• Total (recorded and unrecorded) alcohol per capita (15+ years old) consumption within a calendar year in litres of pure alcohol.
• Age-standardized mean proportion of total energy intake from saturated fatty acids (SFA) and polyunsaturated fatty acids in adults aged 18+ years.
• Age-standardized prevalence of adult (aged 18+ years) population consuming less than five total servings (400 grams) of fruit and vegetables per day.
• Age-standardized prevalence of overweight and obesity in adults aged 18+ years and adolescents (defined as body mass index greater than 25 kg/m² for overweight or 30 kg/m² for obesity for adolescents according to the WHO Growth Reference).
• Age-standardized prevalence of insufficiently active adults aged 18+ years (defined as less than 150 minutes of moderate-intensity activity per week, or equivalent).
• Age-standardized prevalence of raised blood glucose/diabetes among adults aged 18+ years (defined as fasting plasma glucose value ≥7.0 mmol/L (126 mg/dl) or on medication for raised blood glucose).
• Age-standardized prevalence of raised blood pressure among adults aged 18+ years (defined as systolic blood pressure ≥140 mmHg and/or diastolic blood pressure ≥90 mmHg.
• Age-standardized prevalence of raised total cholesterol among adults aged 18+ years (defined as total cholesterol ≥5.0 mmol/L or 190 mg/dl).
• Age-standardized mean population intake of salt (sodium chloride) per day in grams in adults aged 18+ years.
• Age-standardized prevalence of current tobacco smoking among persons aged 15+ years. Health system response:
• Prevalence of women between ages 30–49 years screened for cervical cancer at least once. • Drug therapy to prevent heart attacks and strokes (includes glycemic control), and counselling
for people aged 40 years and over with a 10-year cardiovascular risk greater than or equal to 30% (includes those with existing cardiovascular disease).
• Availability of generic essential NCD medicines and basic technologies in both public and private facilities.
• Access to palliative care assessed by morphine-equivalent consumption of strong opioid analgesics (excluding methadone) per death from cancer.
• Adoption of national policies that virtually eliminate partially hydrogenated vegetable oils (PHVO) in the food supply and replace with polyunsaturated fatty acids (PUFA).
• Policies to reduce the impact on children of marketing of foods high in saturated fats,
trans-fatty acids, free sugars, or salt.
• Vaccination against cancer-causing infections: human papillomavirus (HPV) and hepatitis B virus (HBV).
Details on indicators Outcome indicators
Cancer incidence
12. Indicator: Cancer incidence, by type of cancer per 100 000 population.
13. Public health relevance: Cancer is the second leading cause of NCD deaths globally, responsible for 7.6 million deaths in 2008. More than two thirds of all cancer deaths occur in low- and middle-income countries. Cancer is predicted to become an increasingly important cause of morbidity and mortality in the next few decades in all regions of the world. Data on cancer incidence and type of cancer are essential for planning cancer control programmes. The diversity of cancer types in different countries highlights the need for cancer control activities to fully consider cancer patterns, given that different cancers may be variably amendable to primary prevention, early detection, screening and treatment.
14. Indicator selection: Cancer incidence tracks the number of new cancers of a specific site/type occurring in the population per year, usually expressed as the number of new cancers per 100 000 population.
15. Baseline data availability, measurement issues and requirements: Data on cancer incidence is
obtained from population based cancer registries, which collect and classify information on all new cases of cancer in a defined population, providing incidence and survival statistics for the purposes of assessing and controlling the impact of cancer. However, there remains a notable lack of high-quality population based cancer registries in Africa, Asia and Latin America, with these regions having approximately 1%, 4% and 6% respectively of their populations monitored.
Premature mortality from NCDs
16. Indicator: Unconditional probability of dying between ages 30–70 years from cardiovascular diseases, cancer, diabetes, or chronic respiratory diseases.
17. Public health relevance: Of the 57 million global deaths in 2008, 36 million (63%) of these were due to NCDs. Nearly 80% of these NCD deaths occurred in low- and middle-income countries (29 million deaths). The leading causes of NCD deaths in 2008 were cardiovascular diseases (17 million deaths, or 48% of all NCD deaths), cancers (7.6 million, or 13% of all NCD deaths), and respiratory diseases, including asthma and chronic obstructive pulmonary disease (4.2 million). Diabetes caused another 1.3 million deaths.
18. Indicator selection: This indicator is calculated from age-specific death rates for the combined four cause categories (typically in terms of 5-year age groups 30–34, …, 65–69). A life table method allows calculation of the risk of death between exact ages 30 and 70 from any of these causes, in the absence of other causes of death.
19. The lower age limit for the indicator of 30 years represents the point in the life-cycle where the mortality risk for the four selected chronic diseases starts to rise in most populations from very low levels at younger ages. The upper limit of 70 years was chosen for two reasons:
(i) to identify an age range in which these chronic diseases deaths can be truly considered premature deaths in almost all regions of the world. Table 1 shows estimated regional life expectancies at age 30 for the year 2009; in all regions except the African Region, the average expected age at death for 30 year olds already exceeds 70 years;
(ii) estimation of cause-specific death rates becomes increasingly uncertain at older ages because of increasing proportions of deaths coded to ill-defined causes, increasing levels of co-morbidity, and increasing rates of age mis-statement in mortality and population data sources.
20. Baseline data availability, measurement issues and requirements: Only about two thirds of countries have vital registration systems which record deaths with sufficient completeness to allow estimation of all-cause death rates. Further, as cause-specific certification and coding errors occur in a large number of countries, the proposed indicator relates to the combined mortality risk of the four major NCD groups that cause death. This avoids the need to deal with variability in coding practices for diabetes and cardiovascular diseases. Countries with good quality cause-of-death data, from a complete registration system, may wish to establish more detailed national targets for specific NCD causes.
21. National initiatives to strengthen vital registration systems and cause-specific mortality are a key priority for many countries. Physicians must be trained on the importance of completing death certificates. In settings where many deaths are not attended by a physician, alternate methods, such as verbal autopsy, may be used to complement data collected from death certificates. The global goal of high-quality mortality data will require long-term investment in civil registration.
Exposure indicators
Alcohol
22. Indicator: Total (recorded and unrecorded) alcohol per capita (15+ years old) consumption within a calendar year in litres of pure alcohol.
23. Public health relevance: Reducing alcohol-attributable disease burden is a global public health priority as affirmed by the global strategy to reduce the harmful use of alcohol. The strategy defines the harmful use of alcohol as drinking that causes detrimental health and social consequences for the drinker (harmful drinking), the people around the drinker and society at large, as well as patterns of drinking that are associated with increased risk of adverse health outcomes (hazardous drinking). It is estimated that 2.3 million deaths annually, or 3.8% of all global deaths, are attributed to alcohol consumption, from which more than half are due to NCDs including cancers and cardiovascular diseases. The risk of most alcohol-attributable health conditions is correlated with the overall levels of alcohol consumption with no evidence of a threshold effect for cancers and hypertension.
24. The global strategy to reduce the harmful use of alcohol emphasizes that the harmful use of alcohol and related public health problems are influenced by the general level of alcohol consumption in a population, drinking patterns and local contexts. Levels and patterns of alcohol consumption are interlinked: increase in overall alcohol consumption in a given population is associated with increase in prevalence of alcohol use disorders and detrimental patterns of drinking, and, on the other hand, reduction in prevalence of heavy drinking in a given population result in a reduction of overall level of alcohol consumption. In some countries 10–20% of heavy drinkers are responsible for 80–90% of total alcohol consumed in a population. The available data indicate that the overall levels of alcohol consumption, measured as per capita alcohol consumption, correlate with major alcohol-related health outcomes.
25. Indicator selection: Two parameters of alcohol consumption have particular relevance for NCD prevention and control: overall level of alcohol consumption and drinking pattern. For the overall level of alcohol consumption in populations the adult per capita consumption is well-recognized and established indicator for which the data are being collected, analysed and reported by WHO in time-series.
Level of per capita consumption correlates with the levels of hazardous and harmful drinking and can be considered as the only reliable proxy measure for global monitoring of the “harmful use of alcohol” as defined in the global strategy to reduce the harmful use of alcohol. Prevalence of heavy episodic drinking is considered as the best indicator for describing the pattern of alcohol consumption associated with multiple negative health outcomes. However, significant methodological challenges in measurement of heavy episodic drinking, which is based on self-reporting data with significant bias potential, variability of data received in different surveys for any given population, lack of data at the global and regional levels available in time series for most countries of the world as well as significant costs involved in reliable data collection from countries, prevent the recommendation of this indicator as the key indicator for monitoring purposes worldwide. Indicators based on mortality and morbidity caused by alcohol consumption, such as alcohol liver cirrhosis, alcohol dependence or alcohol-induced psychoses, were considered but not recommended due to significant measurement challenges and lack of trend data in most Member States.
26. Baseline data availability, measurement issues and requirements: Data on total (recorded and
unrecorded) per capita (15+) alcohol consumption in litres of pure alcohol for a calendar year are available for 192 Member States, and based on governmental national sales and export/import data, data available from alcohol industry sources and the Food and Agricultural Organization, as well as the estimates of unrecorded alcohol consumption. Assessment of the changes in overall alcohol consumption is based on documented changes in total adult (15+ years of age) alcohol per capita consumption expressed in litres of pure alcohol for a calendar year. In countries where the number of tourists per year is at least equal to the number of inhabitants, tourist consumption is taken into account in measuring alcohol per capita consumption. Since 2004, data for total (recorded and unrecorded) alcohol consumption are available for most Member States and there has been significant progress in improving the estimates of unrecorded alcohol consumption.
Fat intake
27. Indicator: Age-standardized mean proportion of total energy intake from saturated fatty acids in adults aged 18+ years.
28. Indicator: Age-standardized mean proportion of total energy intake from polyunsaturated fatty acids in adults aged 18+ years.
29. Public health relevance: Excessive dietary fat intake has been linked to increased risk of obesity, coronary heart disease and certain types of cancer. High consumption of saturated-fatty acids is widely considered a risk factor for cardiovascular disease. In 2002, the joint WHO/FAO expert consultation recommended that for the prevention of NCDs, SFA consumption should be less than 10% of a person’s total energy consumption. More recently, WHO recommended that SFA consumption should be less than 10% of a person’s total energy consumption for the reduction of cardiovascular disease. An analysis of FAO Food Balance Sheets (FBS) indicates that in 2008 the intake of SFA ranged between 2% and 35%, with over 40 countries exceeding 10% of energy.
30. Analysis of cohort studies and randomized controlled trials indicates that isocaloric replacement of SFA with polyunsaturated fat reduces cardiovascular risk. A 10% reduction of coronary heart disease risk for each 5% increase in per cent energy from PUFA has been calculated.
31. Indicator selection: The proportion of total energy intake from both saturated fatty acids and polyunsaturated fatty acids need to be collected in order to monitor the shift in consumption patterns.
32. Baseline data availability, measurement issues and requirements: Most dietary surveys from high-income countries report SFA intake (e.g.: Australia, Canada, Germany, Japan, New Zealand, United Kingdom of Great Britain and Northern Ireland, and the United States of America). A scoping of available national dietary surveys indicated that more than 60 countries have collected dietary data which contain SFA information. In addition, a large meta-analysis has been conducted in the context of the Global Burden of Disease project and will be available by end of 2012. Where SFA intake is not reported, assumptions can be made about SFA and PUFA from total fat intake. In the absence of SFA values in a food composition database, it is possible to estimate SFA intake through breaking down total fat by foods or food groups in order to calculate the fatty acid composition. For example, the fatty acid composition of dairy fat is quite similar across butter, cheese, yoghurt, etc. and, it is, therefore, possible to estimate the SFA and PUFA content of dairy food if the total fat content is known. Similar estimations can be made for meats, nuts, seeds, and oils.
Low fruit and vegetable intake
33. Indicator: Age-standardized prevalence of adult (aged 18+ years) population consuming less than five total servings (400 grams) of fruit and vegetables per day.
34. Public health relevance: Approximately 16 million (1.0%) DALYs and 1.7 million (2.8%) of deaths worldwide are attributable to low fruit and vegetable consumption. Adequate consumption of fruit and vegetables reduces the risk for cardiovascular diseases, stomach cancer and colorectal cancer. There is convincing evidence that the consumption of high levels of high-energy foods, such as processed foods that are high in fats and sugars, promotes obesity compared to low-energy foods such as fruits and vegetables.
35. Indicator selection: The consumption of at least 400g of fruit and vegetables per day is recommended as a population intake goal, to prevent diet-related chronic diseases.
36. Baseline data availability, measurement issues and requirements: Data on low fruit and vegetable consumption are collected in health risk behaviour surveys and nutrition surveys. Surveys must capture all consumption fruit and vegetables using standard serving size portions of 80 grams per serving.
Obesity and overweight
37. Indicator: Age-standardized prevalence of obesity (defined as a body mass index (BMI) equal or greater than 30 kg/m2) in adults aged 18+ years.
38. Indicator: Age-standardized prevalence of overweight in adults aged 18+ years and adolescents (defined as body mass index equal or greater than 25 kg/m² for adults and according to the WHO Growth Reference for adolescents) .
39. Public health relevance: The relationship between poor health outcomes/all-cause mortality and obesity is well-established. Worldwide, at least 2.8 million people die each year as a result of being overweight or obese, and an estimated 35.8 million (2.3%) of global DALYs are caused by overweight or obesity. In 2008, 9.8% of men and 13.8% of women in the world were obese (with a BMI ≥ 30 kg/m2), compared with 4.8% for men and 7.9% for women in 1980 (32). An estimated 205 million men and 297 million women over the age of 20 were obese in 2008 – a total of more than 500 million adults worldwide.
40. Indicator selection: Body mass index is a simple index of weight-for-height that is commonly used to classify overweight and obesity in adults. It is defined as a person’s weight in kilograms divided by the square of height in meters (kg/m2). These indicators use the WHO definition for overweight and obesity, where a BMI greater than or equal to 25 refers to “overweight” and a BMI greater than or equal to 30 refers to “obesity”. BMI provides the most useful population-level measure of overweight and obesity as it is the same for both sexes and for all ages of adults.
41. Baseline data availability, measurement issues and requirements: Data on prevalence of overweight and obesity in adults are widely available from Member States. Data are collected in health examination surveys and/or nutrition surveys, which include anthropometric measures (i.e. height and weight). Data on prevalence of overweight and obesity in adolescents are collected primarily through school-based health surveys.
Physical inactivity
42. Indicator: Age-standardized prevalence of insufficient physical activity in adults aged 18+ years (defined as less than 150 minutes of moderate-intensity activity per week, or equivalent).
43. Public health relevance: Insufficient physical activity is the fourth leading risk factor for mortality. Approximately 3.2 million deaths and 32.1 million DALYs (representing about 2.1% of global DALYs) each year are attributable to insufficient physical activity. People who are insufficiently physically active have a 20% to 30% increased risk of all-cause mortality compared to those who engage in at least 30 minutes of moderate intensity physical activity most days of the week. In 2008 it was estimated that 31% of persons aged 15+ were insufficiently active (males 28% and females 34%).
44. Indicator selection: The cut-point of less than 150 minutes of moderate activity per week (or equivalent) was chosen since a vast and strong body of scientific evidence shows that people meeting this threshold have higher levels of health-related fitness, a lower risk profile for developing a number of disabling medical conditions, and lower rates of various chronic NCDs than people who are inactive.
45. This indicator is calculated from age-specific prevalence values of insufficient physical activity. Age standardization is done in order to control differences in population age structure over time and across countries. The lower age limit of 18 years was selected taking into consideration the nature and availability of the scientific evidence relevant to health outcomes.
46. Baseline data availability, measurement issues and requirements: Data on physical activity patterns are collected in health risk behaviour surveys. Surveys must capture physical activity across all domains of life including work/household, transport, and leisure time for the general population.
Raised blood glucose/diabetes
47. Indicator: Age-standardized prevalence of raised blood glucose/diabetes among adults aged 18+ years (defined as fasting plasma glucose ≥7.0 mmol/L (126, mg/dl) or on medication for raised blood glucose).
48. Public health relevance: Diabetes, impaired glucose tolerance and impaired fasting glycaemia are risk categories for future development of diabetes and cardiovascular disease. In 2008, diabetes was directly responsible for 1.3 million deaths. In 2008, the global prevalence of diabetes (defined, in the estimates, as having a fasting plasma glucose value ≥7.0 mmol/L (126 mg/dl) or on medication for raised blood glucose) was estimated to be nearly 10%.
49. Indicator selection: Fasting plasma glucose values have been selected as the indicator due to wide availability in nationally representative surveys. Although the use of HbA1c is becoming increasingly accepted as a valid test to diagnose diabetes, it is not recommended for monitoring this target due to its higher cost in comparison to other diagnostic tools and a lack of standardization in its measurement across different populations.
50. Baseline data availability, measurement issues and requirements: More than 100 countries, including many low- and middle-income countries, have collected data on fasting blood glucose, through nationally representative health examination surveys. Glucose must be measured, not self-reported, and measurements must be taken after the person has fasted for at least eight hours. There are two main blood chemistry screening methods – dry and wet chemistry. Dry chemistry uses capillary blood taken from a finger and used in a rapid diagnostic test. Wet chemistry uses a venous blood sample with a laboratory based test. Most population based surveys used dry chemistry rapid diagnostic tests to gather fasting blood glucose values.
Raised blood pressure
51. Indicator: Age-standardized prevalence of raised blood pressure (defined as systolic blood pressure ≥140 and/or diastolic blood pressure ≥90) among adults aged 18+ years.
52. Public health relevance: Worldwide, raised blood pressure is estimated to cause 7.5 million deaths, about 12.8% of the total of all deaths. This accounts for 57 million disability adjusted life years (DALYS) or 3.7% of total DALYS. Raised blood pressure is a major risk factor for coronary heart disease and ischaemic as well as haemorrhagic stroke. Globally, the overall prevalence of raised blood pressure in those aged 25 and over was 40% in 2008.
53. Indicator selection: Stage 1/Grade 1 hypertension is defined in a clinical setting when the mean blood pressure is equal to or above 140/90 and less than 160/100 on two or more measurements on each of two or more visits on separate days. Treating systolic blood pressure and diastolic blood pressure to targets that are less than 140/90 is associated with a decrease in cardiovascular complications.
54. Baseline data availability, measurement issues and requirements: A significant number of countries, including many low- and middle-income countries, have collected data on measured blood pressure health examination surveys. Blood pressure must be measured, not self-reported.
Raised total cholesterol
55. Indicator: Age-standardized prevalence of raised total cholesterol among adults aged 18+ years (defined as total cholesterol ≥5.0 mmol/L or 190mg/dl).
56. Public health relevance: Raised cholesterol levels increase the risks of heart disease and stroke. Globally, a third of ischaemic heart disease is attributable to high cholesterol. Overall, raised cholesterol is estimated to cause 2.6 million deaths (4.5% of total) and 29.7 million DALYS, or 2% of total DALYS. Raised total cholesterol is a major cause of disease burden in both the developed and developing world as a risk factor for ischemic heart disease and stroke. In 2008, the global prevalence of raised total cholesterol among adults was 39% (37% for males and 40% for females). Globally, mean total cholesterol changed little between 1980 and 2008, falling by less than 0.1 mmol/L per decade in men and women.
57. Indicator selection: Raised total cholesterol defined as ≥5.0 mmol/L or 190mg/dl is used by WHO in guidelines for assessment and management of cardiovascular risk.
58. Baseline data availability, measurement issues and requirements: Around 50 countries have nationally representative data on raised total cholesterol, many of these are low- and middle-income countries who have collected data on total cholesterol, through nationally representative surveys. Cholesterol values must be measured, not self-reported. There are two main blood chemistry screening methods – dry and wet chemistry. Dry chemistry uses capillary blood taken from a finger and used in a rapid diagnostic test. Wet chemistry uses a venous blood sample with a laboratory based test. Most population based surveys used dry chemistry rapid diagnostic tests to gather cholesterol values.
Salt/sodium intake
59. Indicator: Age-standardized mean population intake of salt (sodium chloride) per day in grams in adults aged 18+ years.
60. Public health relevance: The amount of dietary salt (sodium chloride) consumed is an important determinant of blood pressure levels and of hypertension and overall cardiovascular risk. A salt intake of less than 5 grams (approximately 2g sodium) per person per day is recommended by WHO for the prevention of cardiovascular diseases, the leading cause of death globally. However, data from various countries indicate that most populations are consuming much more salt than recommended. In many high-income countries, approximately 75% of salt in the diet comes from processed foods and meals prepared outside the home. In many low- and middle-income countries, most sodium consumption comes from salt added at home in cooking and at the table or through condiments such as fish sauce and soy sauce. Decreasing dietary salt intake from the current global levels of 9–12 grams per day to the recommended level of less than 5 grams per day would have a major impact on blood pressure and cardiovascular disease, averting up to 2.5 million deaths due to heart attacks and stroke worldwide each year.
61. Indicator selection: A salt intake of less than 5 grams (approximately 2g sodium) per person per day is recommended by WHO for the prevention of cardiovascular diseases, the leading cause of death globally. Salt reduction strategies are a “best buy” in the prevention of NCDs.
62. Baseline data availability, measurement issues and requirements: There are limited national data on measured salt/sodium intake, with population based values available only in a few, mostly high-income, countries. Country estimates of mean population salt/sodium are in preparation as part of the Global Burden of Disease update, and will be available by the end of 2012. There is substantial work and regional collaboration currently under way towards the development of monitoring mechanisms, including in low- and middle-income countries. For example, the WHO STEPwise approach to Surveillance (STEPS) tool is currently developing a module on dietary sodium intake that will incorporate both questions to assess sources of sodium, and urine collection, which will facilitate the reporting against this indicator in the future. The gold-standard for estimating salt intake is through 24-hour urine collection, however other methods such as spot urines and food frequency surveys may be more feasible to administer at the population level.
Tobacco
63. Indicator: Age-standardized prevalence of current tobacco smoking among persons aged 15+ years. 64. Public health relevance: Risks to health from tobacco use result from direct consumption of both smokeless and smoking tobacco, and from exposure to second-hand smoke. There is no proven safe level of tobacco use. All current (daily and occasional) users of tobacco are at risk of a variety of
poor health outcomes across the life-course, and for NCDs in adulthood. Almost six million people die from tobacco use each year, accounting for 6% of all female and 12% of all male deaths in the world. Of these deaths, 600 000 are attributable to second-hand smoke exposure among non-smokers and more than five million to direct tobacco use. Tobacco smoking is estimated to cause about 71% of lung cancer deaths, 42% of chronic respiratory disease and nearly 10% of ischaemic heart disease deaths. In 2008, global adult tobacco prevalence of current smoking was 22% across both sexes (36% for males and 8% for females).
65. Indicator selection: Although tobacco interventions must address issues associated with both smokeless and smoking tobacco, at this time a target for tobacco smoking can be realistically set for smoking tobacco only because of greater availability of time trend data for smoking tobacco that allows for more meaningful trend analysis. “Tobacco smoking” includes any smoked form of tobacco.
66. Baseline data availability, measurement issues and requirements: Under WHO FCTC Article 20, countries must establish a national system for the epidemiological surveillance of tobacco consumption and maintain updated data from surveillance programmes. WHO under the aegis of the Global Tobacco Surveillance System has developed a set of tobacco indicators and associated questions that can be used globally in all surveys. Although all countries collect data on smoking tobacco, not all collect data on smokeless tobacco. In addition to countries where consumption of smokeless tobacco is already a substantial problem, all countries are encouraged to include monitoring the prevalence of smokeless tobacco as the tobacco industry is increasingly marketing smokeless tobacco worldwide. The up-to-now global focus on monitoring smoking tobacco is based on the fact that the quality and quantity over time of data on smoking tobacco are much more complete than for smokeless tobacco.
Health system response indicators
Cervical cancer screening
67. Indicator: Prevalence of women between ages 30–49 years screened for cervical cancer at least once.
68. Public health relevance: There were an estimated 530 000 global cases of cervical cancer and 270 000 global deaths from the disease in 2008, with over 80% of these in low- and middle-income countries. Cervical cancer is the most common female cancer in low- and middle-income countries. The widespread use of screening in high-income countries has resulted in a dramatic decline in cervical cancer mortality over the last three decades.
69. Over 95% of the cervical cancer burden is potentially avoidable by good-quality screening programmes and vaccination against HPV16 and 18 – the latter being the causal agent for up to 70% of cervical cancer. IARC concludes that there is sufficient evidence that cervical cancer screening can reduce cervical cancer mortality by 80% or more among screened women. Recent developments in technologies adapted to low-resource settings make screening and treatment of cervical precancerous lesions feasible and highly cost-effective for all countries. Early detection and treatment of precancerous lesions can result in massive improvements of survival, and are especially important in developing countries where access to expensive cancer treatment is limited.
70. In high resource settings, cytology (pap smear) is the most widely used screening test. Among the various screening tests, which are feasible in low resource settings, HPV testing and visual inspection with acetic acid (VIA) have been demonstrated to be effective in decreasing cervical cancer
mortality. HPV testing has better sensitivity, reproducibility, and negative predictive value than cytology and VIA. However, its current cost prohibits widespread use.
71. Indicator selection: Cervical cancer screening aims to detect precancerous changes, which, if not treated, may lead to cancer. In resource-poor settings, 30 to 49 year old women comprise the target audience because cervical cancer is rare in women under 30 and most common in women over 40 years. Screening younger women will detect many lesions that are not likely to develop into cancer, will lead to considerable overtreatment, and is not cost-effective. New programmes should start by screening women aged 30 years or more, and include younger women only when the higher-risk group has been covered. If a woman can be screened only once in her lifetime, WHO recommends the best age is between 35 and 45 years.
72. Baseline data availability, measurement issues and requirements: Comparable baseline data for screening coverage are available for around one quarter of all countries. However, the majority of these are programme-based, not population-based nationally representative data. Data may be available from nationally representative population-based surveys. However, the validity of self-reported screening has not been well established in low- and middle-income countries.
Drug therapy to prevent heart attacks and strokes
73. Indicator: Drug therapy to prevent heart attacks and strokes (includes glycemic control), and counselling for people aged 40+ years with a 10 year cardiovascular risk ≥ 30% (includes those with existing cardiovascular disease).
74. Public health relevance: Population-based interventions alone will not be sufficient to prevent heart attacks and strokes for people with a 10 year cardiovascular risk of 30% or higher. People at such risk level usually have modest elevations of multiple risk factors, such as smoking, raised blood pressure, raised cholesterol and/or diabetes. To prevent heart attacks and strokes in this population, cardiovascular risk needs to be lowered through counselling and appropriate drug therapy. Historic experience in high-income countries with declining cardiovascular mortality rates indicate that about 50% of the decrease can be attributed to reduction of cardiovascular risk through treatment, including secondary prevention. The absolute risk approach, which is monitored by this indicator, provides the most cost effective way of achieving this objective.
75. If implemented through a primary health care approach, the total cardiovascular disease risk approach is estimated to lower the cardiovascular disease burden at least by one third.
76. Indicator selection: WHO recommends drug therapy for prevention and control of heart attacks and strokes because it is feasible, high impact and affordable, even in low- and middle-income countries. This approach is considered more cost-effective and less expensive than conventional single risk factor interventions that address hypertension or hyper-cholesterolemia and is one of the “best buy” interventions.
77. Baseline data availability, measurement issues and requirements: Data on coverage of drug therapy to individuals identified as at-risk is currently available in high-income countries and a few middle-income countries. Establishing a baseline for this indicator requires obtaining information on cardiovascular events and drug treatment when risk factor data (on blood pressure, blood sugar and blood cholesterol) are collected by Member States from existing or planned population based surveys. The WHO/ISH risk prediction charts or a national risk prediction tool can be used to factor in the risk factor data and treatment information to determine the coverage of people with a 10-year risk of heart attack or stroke ≥ 30%, with appropriate therapy.
Essential NCD medicines and basic technologies to treat major NCDs
78. Indicator: Availability of basic technologies and generic essential medicines required to treat major NCDs in public and private sector facilities, including primary care facilities. The minimum list would include: medicines – at least aspirin, a statin, an angiotensin converting enzyme inhibitor, thiazide diuretic, a long acting calcium channel blocker, metformin, insulin, a bronchodilator and a steroid inhalant. Technologies – at least a blood pressure measurement device, a weighing scale, blood sugar and blood cholesterol measurement devices with strips and urine strips for albumin assay.
79. Public health relevance: Without effective medicines and essential diagnosing and monitoring equipment being available at health facilities to treat NCDs, patients will suffer short and long term adverse effects from their disease. Recently shortages have been reported in many high-income countries and reporting systems have been upgraded to collect and disseminate such data quickly. WHO has reported data from 2779 facilities in 40 developing countries and showed that the mean availability of NCD generic medicines was 36% in the public sector and 55% in the private sector. Recent WHO supported Service Availability and Readiness Assessment (SARA) surveys in Sierra Leone and Zambia showed very similar results.
80. Indicator selection: WHO recommends drug treatment for high-risk people including those with diabetes in order to prevent and control heart attacks, strokes and diabetes complications. This set of technologies and medicines will enable these “best buy” interventions to be implemented in primary care.
81. Baseline data availability, measurement issues and requirements: All high-income countries have systems in place to report on availability of NCD medicines. These sources could be used to generate availability data. Many surveys on medicine availability and pricing have already been undertaken in low- and middle-income countries and the results are available.
82. Every country is likely to have slightly different national treatment guidelines and thus the list of medicines to be assessed will need to be customized for each country’s situation. However as has been shown in other surveys the overall availability is comparable over time and across countries. To be specific and consistent the medicines to be assessed for availability might need to be adjusted to take account of national guidelines.
Palliative care
83. Indicator: Access to palliative care assessed by morphine-equivalent consumption of strong opioid analgesics (excluding methadone) per death from cancer.
84. Public health relevance: Every year, tens of millions of patients with noncommunicable diseases require palliative care to relieve suffering or, when curative treatment is no longer an option, ensure the highest possible quality of life until death. Although it is considered an integral part of health services for many noncommunicable diseases, the vast majority of these patients do not have access to palliative care and face unnecessary suffering as a result. The Political Declaration of the High-level Meeting of the General Assembly on the Prevention and Control of Non-communicable Diseases acknowledged the need for palliative care for people with NCDs.
85. Indicator selection: This indicator is an effective proxy measurement for palliative care development for all life-threatening illnesses, including NCDs.
86. Baseline data availability, measurement issues and requirements: Data required are already collected annually. WHO produces estimates of the number of deaths from cancer. The International Narcotics Control Board annually publishes consumption data for narcotic drugs, including strong opioid analgesics, as reported by countries. Morphine equivalent is a metric to standardize doses of strong opioids and allow combination and comparison of different medicinal opioids. This equation is taken from the ratios of the defined daily dose (oral dosing for all except fentanyl, which is transdermal) as described by the WHO Collaborating Centre for Drug Statistics Methodology. Because of methadone’s widespread use in opioid substitution therapy and its relatively rare use to treat moderate to severe pain, non-methadone morphine equivalent is also used in some instances. It is proposed to use the non-methadone morphine equivalent value to avoid consumption of methadone for drug treatment distorting the calculations.
Policies to eliminate industrially produced trans-fatty acids
87. Indicator: National policies that virtually eliminate partially hydrogenated vegetable oils in the food supply and replace with polyunsaturated fatty acids.
88. Public health relevance: Trans-fatty acids (TFA) negatively affect blood lipids and fatty acid metabolism, endothelial function and inflammation, thus increasing the risk of type 2 diabetes and cardiovascular diseases. TFA increase the risk for coronary heart disease through their negative effect on serum lipids, raising low-density lipoprotein and decreasing high-density lipoprotein in the blood, even more than saturated fat. In particular, the consumption of TFA from partially hydrogenated oils adversely affects multiple cardiovascular risk factors and contributes significantly to an increased risk of coronary heart disease events. TFA also worsen insulin resistance, particular among predisposed individuals with risk factors (e.g. raised blood glucose, overweight and obesity, or physical inactivity).
89. WHO recommends that the consumption of TFA should be eliminated. In 2002, the joint WHO/FAO expert consultation recommended that for the prevention of NCDs, TFA should be less than 1% of total energy consumption. In 2007, the WHO Scientific Update agreed that TFA should be considered as industrial food additives with no demonstrable benefits and that are clear hazards to human health.
90. Indicator selection: Replacement of industrially produced TFA with polyunsaturated fatty acids is a “best buy” for the prevention of NCDs.
91. Baseline data availability, measurement issues and requirements: Tracking policy and programme implementation for this indicator will be collected on a regular basis through the WHO NCD Country Capacity Survey and the WHO global nutrition policy review.
Marketing of foods high in saturated fats, trans-fatty acids, free sugars, or salt to children
92. Indicator: Policies to reduce the impact on children of marketing of foods high in saturated fats,
trans-fatty acids, free sugars, or salt.
93. Public health relevance: Evidence from systematic reviews on the extent, nature and effects of food marketing to children conclude that advertising is extensive and other forms of food marketing to children are widespread across the world. Most of this marketing is for foods with a high content of fat, sugar or salt. Evidence also shows that television advertising influences children’s food preferences, purchase requests and consumption patterns. Television advertising is gradually being complemented by a mix of marketing communications that focus on branding and building
relationships with consumers. Food marketing to children is now a global phenomenon and tends to be pluralistic and integrated, using multiple messages in multiple channels.
94. Indicator selection: In May 2010, at the Sixty-third World Health Assembly, the WHO Member States endorsed a set of recommendations on the marketing of foods and non-alcoholic beverages to children (see resolution WHA63.14). The main purpose of the recommendations is to guide efforts by Member States in designing new and/or strengthening existing policies on food marketing communications to children in order to reduce the impact on children of marketing of foods high in saturated fats, trans-fatty acids, free sugars, or salt. A number of countries have already started to implement resolution WHA63.14 – these include Ireland, Malaysia, Spain, Sweden, and the United Kingdom of Great Britain and Northern Ireland.
95. Baseline data availability, measurement issues and requirements: In resolution WHA63.14 (subparagraph 2(3)), the Health Assembly urges Member States to establish a system for monitoring and evaluating the implementation of the recommendations on the marketing of foods and non-alcoholic beverages to children. Tracking policy and programme implementation for this indicator will be collected on a regular basis through the WHO NCD capacity survey and the WHO global nutrition policy review.
Vaccination against cancer-causing infections
96. Indicator: Vaccination against cancer-causing infections: human papillomavirus (HPV) and hepatitis B virus (HBV).
97. Public health relevance: Globally there were an estimated 694 000 deaths from liver cancer in 2008 (477 000 in men, 217 000 in women) and because of its high fatality (overall ratio of mortality to incidence of 0.93), liver cancer is the third most common cause of death from cancer worldwide. HBV is a major cause of liver cancer accounting for 54% of liver cancer cases worldwide (59% of liver cancers in developing countries). In addition, HBV results in liver cirrhosis and in total it is estimated that 600 000 people die each year from chronic HBV infections, mainly from cirrhosis and liver cancer. People with chronic HBV infection have a 15%–25% risk of dying prematurely from HBV-related cirrhosis and liver cancer. A safe effective vaccine to prevent chronic infection with HBV is available and is recommended by WHO to be included in national infant vaccination programmes. The key strategy for achieving the goal is universal infant vaccination with 3 doses of hepatitis B vaccine, with the first dose delivered within 24 hours of birth.
98. Almost half a million women develop cervical cancer per year. Cervical cancer is caused by certain types of human papillomavirus (HPV) and is the most common cancer affecting women in developing countries. Two HPV vaccines have been approved for use in many countries. Clinical trial results show that both vaccines are safe and effective in preventing infections with the two types of HPV that cause most cervical cancer and precancerous cervical lesions.
99. Indicator selection: Preventing liver cancer via hepatitis B vaccination is classified as a “best buy” by WHO. HPV vaccination is potentially very cost effective if it can be made available at below I$ 10 per vaccinated girl.
100. Baseline data availability, measurement issues and requirements: Data on HPV and HBV are obtained from prevalence surveys conducted to monitor national immunization programme coverage. The WHO-UNICEF immunization survey and national immunization programme databases provide data on coverage for a significant number of countries.
PART 2: VOLUNTARY GLOBAL TARGETS
101. Table 2 below provides examples of voluntary global targets for consideration by Member States during the six regional committee meetings, as requested in decision WHA65(8). Achievement of a selection of these targets by 2025 would represent major progress in NCD prevention and control.
102. A limited number of targets will provide a foundation for global surveillance needs. Paragraph 63 of the Political Declaration urges Member States to consider the development of national targets based on national situations, building on the guidance provided by WHO, to assess the progress they are making in prevention and control of NCDs and their risk factors and determinants, and which will also contribute to the attainment of these global targets.
Criteria for selection of indicators and targets within the global monitoring framework 103. The possible targets listed below have been assessed against the following criteria:
(i) High epidemiological and public health relevance.
(ii) Coherence with major strategies, notably the priorities of the global strategy for the prevention and control of noncommunicable diseases and its action Plan, the Political Declaration, and the WHO framework for health systems priorities to monitor exposures, outcomes, and health systems response.
(iii) Availability of evidence-based effective and feasible public health interventions.
(iv) Evidence of achievability at the country level, including in low- and middle-income countries.
(v) Existence of unambiguous data collection instruments and potential to set a baseline and monitor changes over time.
104. In calculating these targets, the historical performance of the top ranked 10th percentile of countries was assessed to help set the level of achievement considered possible. Age-standardized baselines for 2010 for all targets will be established by WHO, based on existing available data and estimation methods to fill data gaps, such as those described in the WHO Global Status Report on Noncommunicable Diseases 2010.1 Interim targets for 2015 and 2020 will be set once the final global targets are agreed by Member States. The targets are to be achieved by 2025, and are listed in alphabetical order within each component of the global monitoring framework.
1 Prevalence targets are age-standardized to discount any effect on mortality or prevalence based on different age
distributions across populations and over time, and future reporting against all indicators will be age-standardized. Without this standardization it would be unclear if differences in rates or prevalence were due to age or other factors.
Table 2. Examples of voluntary global targets (with indicators and data sources)
Outcome targets Indicator Data source(s)
1. Premature mortality from NCDs
25% relative reduction in overall mortality from cardiovascular diseases, cancer, diabetes, or chronic respiratory diseases
Unconditional probability of dying between ages 30–70 from,
cardiovascular diseases, cancer, diabetes, or chronic respiratory diseases
Civil registration system, with medical certification of cause of death, or survey with verbal autopsy
Exposure targets Indicator Data source(s)
2. Alcohol
10% relative reduction in overall alcohol consumption (including hazardous and harmful drinking)
Total (recorded and unrecorded) alcohol per capita (15+ years) consumption within a calendar year in litres of pure alcohol
Official statistics and reporting systems for production, import, export, and sales or taxation data
3. Fat intake
15% relative reduction in mean proportion of total energy intake from saturated fatty acids, with aim of achieving recommended level of less than 10% of total energy intake
Age-standardized mean proportion of total energy intake from saturated fatty acids in adults aged 18+ years
National survey
4. Obesity
Halt the rise in obesity prevalence Age-standardized prevalence of obesity among adults aged 18+ years
National survey (with measurement)
5. Physical inactivity
10% relative reduction in
prevalence of insufficient physical activity
Age-standardized prevalence of insufficient physical activity in adults aged 18+ years
National survey
6. Raised blood pressure
25% relative reduction in
prevalence of raised blood pressure
Age-standardized prevalence of raised blood pressure among adults aged 18+ years
National survey (with measurement)
7. Raised cholesterol
20% relative reduction in prevalence of raised total cholesterol
Age-standardized prevalence of raised total cholesterol among adults aged 18+ years
National survey (with measurement)
Exposure targets Indicator Data source(s)
8. Salt/sodium intake
30% relative reduction in mean population intake of salt, with aim of achieving recommended level of less than 5 grams per day
Age-standardized mean adult (aged 18+) population intake of salt per day
National survey (with measurement)
9. Tobacco
30% relative reduction in prevalence of current tobacco smoking
Age-standardized prevalence of current tobacco smoking among persons aged 15+ years
National survey
Health systems response targets Indicator Data source(s)
10. Drug therapy to prevent heart attacks and strokes
50% of eligible people receive drug therapy to prevent heart attacks and strokes, and counselling
Drug therapy to prevent heart attacks and strokes (including glycemic control), and counselling for people aged 40+ years with a 10 year cardiovascular risk ≥ 30% (includes those with existing cardiovascular disease)
National survey
11. Essential NCD medicines and basic technologies to treat major NCDs
80% availability of basic
technologies and generic essential medicines required to treat major NCDs in both public and private facilities
Availability of basic technologies and generic essential medicines required to treat major NCDs in public and private sector facilities, including primary care facilities
Facility data
Detailed description of targets to be achieved by 2025
105. A full description of each proposed target, rationale for target setting, and how the target might be achieved is included below. Based on World Health Assembly decision WHA65(8), the following categories of targets have been established – “target adopted”, “targets with wide support”, “targets with support for further development”.
Target adopted
Premature mortality from NCDs
106. Target: 25% relative reduction in overall mortality from cardiovascular diseases, cancer, diabetes, or chronic respiratory diseases.
107. Target setting: The proposed target for a 25% relative reduction over the 15-year period 2010–2025 was based on an analysis of the historically achieved trends in the indicator in recent decades. To set this target, data was analysed from 81 Member States with at least 15 years of vital registration data in the period 1980–2010 that passed quality criteria on completeness and cause-of-death assignment. The average annual rate of decline was calculated on the unconditional probability of dying from the four causes between ages 30 and 70 (both sexes combined) for each country from
the available data within this 30-year time period, and the top 24th percentile for the 81 countries was computed (see Figure 3). On the conservative assumption that the other Member States without such high-quality historical data would all fall below this level, this percentile corresponds to the 10th percentile for all Member States, and corresponds to an annual average decline of the order of 2% per year. The target for the 15-year period 2010–2025 was thus set at a 25% relative reduction (2% annual reduction compounded for 15 years).
Table 3. Estimated regional life expectancies and probability of dying between exact ages 30 and 70 in year 2009
Life expectancy at age 30 (years)
Expected age at death
Probability of dying (%) between exact ages 30 and 70
High-income countries 51.0 81.0 18
Low- and middle-income countries
African Region 35.5 65.5 54
Region of the Americas 47.2 77.2 26
South-East Asia Region 41.5 71.5 39
European Region 42.0 72.0 39
Eastern Mediterranean Region 42.5 72.5 36
Western Pacific Region 45.9 75.9 27
Source: WHO life tables for year 2009 (World Health Statistics 2011).
108. Achievability: The historic experience of best performing countries over the period 1980–2010 has shown that very substantial declines in NCD death rates can be achieved, and that the proposed target is achievable. Known “best buys” for prevention and treatment interventions can result in very large reductions in death rates for the four major disease groups. For example:
(i) WHO has estimated that the five leading behavioural and dietary risks – high body mass index, low fruit and vegetable intake, physical inactivity, tobacco use and alcohol use – are responsible for 30% of cancer deaths.
(ii) WHO has estimated that eight risk factors – harmful use of alcohol, tobacco use, raised blood pressure, high body mass index, raised cholesterol, raised blood glucose, low fruit and vegetable intake, and physical inactivity – account for 61% of cardiovascular deaths. Additional mortality reductions are feasible through targeted health service interventions for people with high cardiovascular risk and for patients who have experienced an acute cardiovascular disease event.
(iii) Around 60% of adult-onset diabetes can be prevented through lifestyle modifications and additional mortality reductions can be achieved through diagnosis and treatment.
(iv) Around 60% of chronic respiratory disease deaths are attributable to tobacco smoking or exposure to indoor smoke from solid fuel fires.
Targets with wide support
Raised blood pressure
109. Target: 25% relative reduction in the prevalence of raised blood pressure (defined as ≥140 and/or diastolic blood pressure ≥90).
110. Target setting: The per cent decline proposed is based on historic experience from 1980–2010 in the relative reductions achieved by the top 10th percentile of countries.
111. Achievability: This target is to be achieved by the implementation of salt reduction interventions; promotion of healthy diets including increased consumption of fruits and vegetables and reducing intake of saturated fats; efforts to reduce overweight and obesity; and screening, detection and treatment of people with hypertension.
Tobacco smoking
112. Target: 30% relative reduction in prevalence of current tobacco smoking.
113. Target setting: The per cent decline proposed was based on reductions in prevalence of smoking demonstrated as being achievable by some high- and middle-income countries that had implemented strong tobacco control programmes. Using data from the WHO Report on the Global Tobacco Epidemic, trends in tobacco smoking prevalence rates were analysed for those Member States that had achieved implementation of selected demand reduction measures at the highest level. This analysis indicated that these high- and middle-income countries had achieved around a 1% absolute annual reduction in tobacco smoking prevalence. This achievement was translated into a 30% relative reduction by 2025 which is therefore deemed to be feasible and achievable.
114. Achievability: This target is to be achieved through full implementation of the WHO Framework Convention on Tobacco Control (WHO FCTC), and in particular demand reduction measures at the highest level, for example, tobacco product tax, large pictorial health warning labels, comprehensive smoke-free legislation, and bans on all forms of tobacco advertising, promotion and sponsorship.
Salt/sodium intake
115. Target: 30% relative reduction in mean population intake of salt, with the aim of achieving a target of less than 5 grams per day (approximately 2g sodium).
116. Target setting: Less than 5 grams per day in adults aged 18+ is the established WHO recommendation for the prevention of cardiovascular disease. The per cent decline proposed is also based on the WHO recommendation for the prevention of cardiovascular disease that states that all individuals should be strongly encouraged to reduce daily salt intake by at least one third. Based on available data, it is estimated that dietary salt intake is between 9 and 12 grams per day.
117. Achievability: This target is to be achieved by implementation of salt reduction interventions including mass media campaigns to inform and empower consumers to make informed choices and reduced salt content in processed foods through product reformulation. A limited number of countries have implemented salt/sodium reduction strategies and data from these countries (e.g. Finland, United Kingdom) have shown that over a period of 7–10 years mean population intake of salt per day can be reduced by up to 30%. Several low- and middle-income countries are also now implementing or planning to implement salt/sodium reduction strategies in the near future.