En vue de l'obtention du
DOCTORAT DE L'UNIVERSITÉ DE TOULOUSE
Délivré par :
Institut National Polytechnique de Toulouse (INP Toulouse)
Discipline ou spécialité :
Signal, Image, Acoustique et Optimisation
Présentée et soutenue par :
M. GIUSEPPE ROTONDO
le lundi 12 décembre 2016
Titre :
Unité de recherche :
Ecole doctorale :
Processing and Integrity of DC/DF GBAS for CAT II/III Operations
Mathématiques, Informatique, Télécommunications de Toulouse (MITT)
Laboratoire de Télécommunications (TELECOM-ENAC)
Directeur(s) de Thèse :
M. OLIVIER JULIEN M. PAUL THEVENON
Rapporteurs :
M. BERND EISSFELLER, UNIVERSITAT DER BUNDESWEHR MUNICH M. JAUME SANZ SUBIRANA, UNIV POLITECNICA DE CATALUNYA BARCELONA
Membre(s) du jury :
1 M. BERND EISSFELLER, UNIVERSITAT DER BUNDESWEHR MUNICH, Président
2 M. OLIVIER JULIEN, ECOLE NATIONALE DE L'AVIATION CIVILE, Membre
Abstract
In Civil Aviation domain, to cope with the increasing traffic demand, research activities are pointed toward the optimization of the airspace capacity. Researches are thus ongoing on all Civil Aviation areas: Communication, Navigation, Surveillance (CNS) and Air Traffic Management (ATM). Focusing on the navigation aspect, the goals are expected to be met by improving performances of the existing services through the developments of new NAVigation AIDS (NAVAIDS) and the definition of new procedures based on these new systems.
The Global Navigation Satellite System (GNSS) is recognized as a key technology in providing accurate navigation services with a worldwide coverage. A symbol of its importance, in civil aviation, can be observed in the avionics of new civil aviation aircraft since a majority of them are now equipped with GNSS receivers. The GNSS concept was defined by the International Civil Aviation Organization (ICAO).It, includes the provision of an integrity monitoring function by an augmentation system in addition to the core constellations. This is needed to meet all the required performance metrics of accuracy, integrity, continuity and availability which cannot be met by the stand-alone constellations such as GPS. Three augmentation systems have been developed within civil aviation: the GBAS (Ground Based Augmentation System), the SBAS (Satellite Based Augmentation System) and the ABAS (Aircraft Based Augmentation System).
GBAS, in particular, is currently standardized to provide precision approach navigation services down to Category I (CAT I) using GPS or Glonass constellations and L1 band signals. This service is known as GBAS Approach Service Type-C (GAST-C). In order to extend this concept down to CAT II/III service, research activities is ongoing to define the new service called a GAST-D. Among other challenges, the monitoring of the ionospheric threat is the area where the integrity requirement is not met.
Thanks to the deployment of new constellations, Galileo and Beidou, and the modernization process of the existing ones, GPS and Glonass, the future of GNSS is envisaged to be Multi-Constellation (MC) and Multi-frequency (MF). In Europe, research activities have been focused on a Dual-Constellation (DC) GNSS and DC GBAS services based on GPS and Galileo constellations. Benefits, brought by DC and DF, are related to
the robustness of the entire system against unintentional interference thanks to the use of measurements in two protected frequency bands,
the robustness against a constellation failure,
the accuracy improvement by using new signals with improved performance, and more satellites.
improved detection of ionosphere anomalous condition thanks to the use of DF measurements. mitigation of the residual ionospheric induced range error
These last points in particular are considered as one of the biggest benefits brought by the DF GBAS. To overcome the problems experienced by Single-Frequency (SF) GBAS due to ionosphere anomalies, the use of two frequencies (Dual Frequency, DF) has been selected as a mean to improve ionosphere anomalies detection and to mitigate ionosphere residual errors. Advantages in using a DC/DF GBAS (GAST-F) system are, however, not only related to the integrity monitoring performance improvement. However, the use of new signals and a new constellation, does not bring only benefits. It also raises a series of challenges that have to be solved to fully benefit from the new concept.
In this thesis, some challenges, related to DC/DF GBAS, have been investigated. One of them, rising from the use of new GNSS signals, is to determine the impact of error sources that are uncorrelated between the ground station and the aircraft and that induce an error on the estimated position. Using two frequencies, there is the possibility to form measurement combinations like Divergence-free (D-free) and Ionosphere-free (I-free) for which the errors impact has to be analyzed. In this thesis, the impact of the uncorrelated errors (noise and multipath as main sources) on ground measurements is analyzed. The aim is to compare the derived performances with the curve proposed in (RTCA Inc.; DO253-C, 2008) for the ground correction accuracy and derived for GPS L1 C/A.
Another issue raised by the use of DC/DF GBAS is the increased number of satellites and the presence of a second frequency. This leads to the constraint of having a big number of channels in GNSS receivers to track all available signals. Moreover, to broadcast a bigger number of corrections from the ground to the aircraft, the messages capacity has to be increased with respect to the current SF/SC GBAS. To solve this problem, some solutions have been proposed, one of these is the implementation of a satellite selection algorithm. In this PhD, the impact of some algorithms proposed in literature has been analyzed on a simulated DC GBAS system.
The last analysis performed in this thesis regards some of the challenges in the integrity monitoring domain. GBAS has been validated, nowadays, only for GAST-C to provide CAT I service. Although almost the same architecture has been used to provide CAT II/III service within GAST-D (but with new monitors on the ground architecture), the concept to derive the airworthiness between the two services is totally different. This major difference is justified by the fact that for CAT III operations, requirements are more stringent than for CAT I. Despite all the efforts done, GAST-D for CATII/III has not been validated. The cause of the non-validation of GAST-D is the lack of integrity performances in monitoring the ionosphere anomalous activity with the proposed monitoring scheme. Even if for GAST-F, relying on DF combinations, the monitoring of the ionosphere could not represent the main issue and
the integrity performances of current monitors may be sufficient to meet the requirements, two considerations have to be done
In case of loss of frequency, for GAST-F, the ionosphere monitoring presents the same condition as for GAST-D. If the latter is not validated, the fallback mode is GAST-C, limiting the availability of CAT II/III operations.
Improving the integrity performances of GAST-D will permit to create a system with an enhanced CAT II/III operations availability thanks to the use of GAST-D as fallback mode in case of frequency loss whenever GAST-F is used as primary mode. In case of GAST-D as primary mode, GAST-F can be considered the fallback mode for cases of ionosphere anomalous conditions.
Considering previous conditions, the work done in this thesis has focused on the monitoring of the ionospheric conditions that are impeding GAST-D to be validated. A solution combining RAIM SC/SF GBAS differential corrections and foreseen GAST-D monitors is proposed. The combination of these integrity monitoring functions permit to get closer to GAST-D requirements for particular ionospheric scenarios where the maximum ionospheric induced range error can be assumed. The consideration of dual constellation in the same mix of integrity monitoring functions has also been studied, as a possible fallback mode of GAST-F when one of the two frequencies is lost.
The ionosphere is not the only integrity issue for GAST-F. Other analysis have been done considering the impact of new signals or new processing modes on the existing monitors. Concerning this, the impact of a lower update rate, for the PRC and RRC, on the Excessive Acceleration (EA) monitor has been analyzed. The aim is to verify the feasibility of the monitor in extending the current update interval from 0.5 seconds up to a proposed value of 2.5 seconds.
Résumé
Dans le domaine de l'aviation civile, afin de répondre à la demande croissante du trafic, les activités de recherche sont guidées par la volonté d’améliorer la capacité de l'espace aérien. Des recherches sont en cours dans tous les domaines de l'aviation civile: Communication, Navigation, Surveillance (CNS) et de gestion du trafic aérien (Air Traffic Management, ATM). En ce que concerne la navigation, les objectifs devraient être atteints par l'amélioration des performances des services existants grâce au développement des nouvelles aides à la navigation et la définition de nouvelles procédures basées sur ces nouveaux systèmes.
La navigation par satellite, grâce au concept de Global Navigation Satellite System (GNSS), est reconnue comme une technologie clé pour fournir des services de navigation précis avec une couverture mondiale. Le concept GNSS a été défini par l'Organisation de l'Aviation Civile Internationale (OACI). Son importance dans l'aviation civile peut être observée dans l'avionique de nouveaux avions puisque la majorité d'entre eux sont maintenant équipés de récepteurs GNSS. Le GNSS comprend une fonction de surveillance de l'intégrité fournie par un système d’augmentation en plus de la constellation de base. Ceci est nécessaire pour répondre à toutes les exigences concernant la précision, l'intégrité, la continuité et la disponibilité qui ne peuvent pas être fournis par les constellations autonomes comme le GPS ou Glonass. Trois systèmes d’augmentation ont été développés au sein de l'aviation civile: le GBAS (Ground Based Augmentation System), le SBAS (Satellite Based Augmentation System) et l’ABAS (Aircraft Based Augmentation System).
Le système GBAS, en particulier, est actuellement standardisé pour fournir des services de navigation, comme l'approche de précision, jusqu’à la Catégorie I (CAT I) en utilisant les constellations GPS ou Glonass et des signaux dans la bande L1. Ce service est connu sous le nom de GBAS Approach Service Type-C (GAST-C). Afin d'étendre ce concept jusqu'à des approche de précision CAT II/II, les activités de recherche sont en cours pour définir le nouveau service appelé GAST-D. Parmi tous les défis, la surveillance de la menace ionosphérique est le secteur où le niveau d'intégrité est insuffisant.
Grâce au développement des nouvelles constellations, Galileo et Beidou, et grâce au processus de modernisation des autres constellations existantes, GPS et Glonass, l'avenir du GNSS sera Multi-Constellation (MC) et Multi-Fréquence (MF). En Europe, les activités de recherche se sont concentrées sur un système GNSS Bi-Constellation (Dual-Constellation, DC) basé sur GPS et Galileo. Les avantages d'un système DC/DF GBAS (GAST-F) sont :
• la robustesse de l'ensemble du système contre toute interférence involontaire grâce à l'utilisation de mesures effectuées dans deux bandes de fréquences protégées,
• l'amélioration de la précision à l'aide de nouveaux signaux avec des performances améliorées, et plusieurs satellites.
• l’amélioration de la détection d’anomalies ionosphérique • atténuation des erreurs résiduelles dues à l’ionosphère
Ces derniers points sont considérés comme les plus grande avantage apportée par le GBAS double fréquence. Afin de surmonter les problèmes rencontrés par en fonctionnement Mono-Fréquence (Single-Frequency, SF) en présence d’anomalies ionosphériques, l'utilisation de deux fréquences (Dual-Frequency, DF) a été sélectionnée comme un moyen d'améliorer la détection des anomalies ionosphériques et d'atténuer les erreurs résiduelles ionosphériques.
Cependant, l'utilisation de nouveaux signaux et d’une nouvelle constellation, n’apporte pas que des avantages. Elle soulève également une série de défis qui doivent être résolus de profiter pleinement de ce nouveau concept.
Dans cette thèse, certains défis, liés à un système DC/DF GBAS ont été étudiés. Un d’entre eux, causé par l'utilisation de nouveaux signaux GNSS, est de déterminer l'impact des sources d'erreur qui sont décorrélées entre la station au sol et l'avion et qui induisent une erreur sur la position estimée. De plus, avec l’utilisation de deux fréquences, il y a la possibilité de former des combinaisons de mesure comme les mesures Divergence-free (D-free) et Ionosphère-free (I-free) pour lesquelles l'impact des erreurs doit être analysé. Dans cette thèse, l'impact des erreurs décorrélées (bruit et multitrajet principalement) sur les mesures au sol est analysé. L'objectif est de comparer les performances des nouveaux signaux et des différentes combinaisons possibles, avec la courbe proposée dans (RTCA Inc.; DO253-C, 2008) pour la précision des corrections calculées dans la station au sol pour GPS L1 C/A.
Un autre problème soulevé par l'utilisation de DC/DF GBAS est l'augmentation du nombre de satellites et la présence d'une deuxième fréquence. Cela nécessite un grand nombre de canaux dans les récepteurs pour poursuivre tous les signaux disponibles. En outre, pour envoyer un grand nombre de corrections, la capacité des messages de correction doit être augmentée. Pour résoudre ce problème, certaines solutions ont été proposées, l'une d'entre elles est la mise en œuvre d'un algorithme de sélection de satellite. Dans cette thèse, l'impact de certains algorithmes proposés dans la littérature a été analysé sur un système GBAS DC simulé.
La dernière analyse effectuée dans cette thèse concerne le domaine de la surveillance de l'intégrité. De nos jours, le GBAS a été validé uniquement dans le cadre du GAST-C pour fournir un service d’approche CAT I. Même si une architecture identique est utilisée pour fournir un service CAT II/III dans un cadre GAST-D (mais avec de nouveaux moniteurs sur la station de référence), le concept pour valider la navigabilité entre les deux services est totalement différent. Cette différence est justifiée par
Malgré tous les efforts faits, le GAST-D pour CAT II/III n'a pas été validé. La cause de la non-validation du GAST-D est le manque de performances d'intégrité dans la détection des activités ionosphériques anormales avec le système de surveillance proposé. Même si pour le GAST-F, en se fondant sur des combinaisons DF, la surveillance de l'ionosphère ne représentera pas le principal problème et même si les performances de l'intégrité des moniteurs actuels peuvent être suffisantes pour répondre aux exigences, deux considérations doivent être faites :
• En cas de perte d’une fréquence, pour GAST-F, la surveillance de l’ionosphère présente les mêmes conditions que pour D. Si celui-ci n'a pas été validé, le mode de repli est GAST-C, ce qui limite la disponibilité des CAT II / III.
• L’amélioration des performances de l'intégrité de GAST-D permettra de créer un système avec une disponibilité améliorée pour les opérations en CAT II/III grâce à l'utilisation de GAST-D en tant que mode de repli en cas de perte d’une fréquence à chaque fois que GAST-F est utilisé comme mode primaire. En cas d’utilisation de GAST-D en mode primaire, GAST-F peut être considéré comme le mode de repli en cas de conditions ionosphériques anormales.
Compte tenu des conditions précédentes, le travail effectué dans cette thèse a mis l'accent sur le suivi des conditions ionosphériques qui entravent la validation du GAST-D. Une solution combinant un algorithme de type RAIM, des corrections différentielles SF/SC GBAS et les moniteurs prévus en D est proposée. La combinaison de ces moniteurs permet de se rapprocher des exigences GAST-D pour certains scénarios où l’erreur ionosphériques maximale peut être modélisée. La prise en compte d’une deuxième constellation avec la même combinaison de fonctions de contrôle d'intégrité a également été étudiée, en tant que mode de repli possible de GAST-F lorsque l'une des deux fréquences est perdue.
L'ionosphère n’est pas le seul problème d'intégrité pour GAST-F. D'autres analyses doivent être faites compte tenu de l'impact des nouveaux signaux ou de nouveaux modes de traitement sur les moniteurs existants. Sur ce sujet, l'impact d'un taux de mise à jour plus bas des corrections différentielles sur le moniteur « Excessive Acceleration » a été analysé. Le but est de vérifier les bonnes performances du moniteur lorsque l'intervalle de mise à jour passe de la valeur actuelle de 0,5 seconde jusqu'à une valeur proposée de 2,5 secondes.
Acknowledgements
I would like to thank Professor Bernd Eissfeller and Professor Jaume Sanz Subirana for accepting to review my thesis manuscript, for their corrections and to attend to my thesis defence.
I would like to thank as well my thesis director Olivier Julien and, Christophe Macabiau and Carl Milner, for their help in these last three years. As well I have to thank Pierre Ladoux for its support and suggestions for the thesis work. I would like also to thank Frieder Beck for the provisions of ground measurements used in the thesis. Thanks to all SESAR 15.3.7 members for their help and for good moments had together.
A huge thank to my thesis co-director Paul Thevenon for its help and advice for the thesis work and for its help when the French language was the “unknown term” at the beginning of these three years. As well as I would like to thank all people from the SIGNAV and EMA groups for all good moments spend together, in particular, my GBAS colleague Alizé who shared the office with me. Jeremy who tried to explain me rugby rules. Jean Baptiste for sharing the passion for food. Amany, Quentin and Capucine for sharing the office with me in the last months avoiding to let me alone. Johan for its bad results in learning the Italian language…but essentially THANKS TO ALL.
A “good luck” to all future Ph. D. student for their works.
Thanks to my friends, Alessio, Marco, Enik and Simon for keeping the motivation high with some beers, and all kind of liquors, in bad moments.
Author(s) consulted Deliverable D03 of the SESAR 15.03.07 project .
Deliverable D03 of the SESAR 15.03.07 project has been developed by AENA, Airbus, DFS, DSNA, ENAC, ENAV, EUROCONTROL, Honeywell, INDRA, NATMIG, Selex, Thales and AT-One for the SESAR Joint Undertaking within the frame of the SESAR Programme co-financed by the EU and
EUROCONTROL. It was provided “as is”, without warranty of any kind, either express or implied, including, without limitation, warranties of merchantability, fitness for a particular purpose and non-infringement. Therefore, the provided document after review of the SJU may change, improve, be updated or replaced by another version without notice.
Deliverable D03 of the SESAR 15.03.07 project has been provided for informative purposes only. Under no circumstances shall the SJU be liable for any loss, damage, liability or expense incurred or suffered that is claimed to have resulted from the use of this document, including, without limitation, any fault, error, omission, interruption or delay with respect thereto.
This document may contain advice, opinions and statements of its author[s]. The SJU does not
represent or endorse the accuracy or reliability of any advice, opinion, statement or other information provided by any information provider or any other person or entity involved in the drafting of this document.
Table of Contents
1 Introduction ... 29
1.1 Background and Motivations ... 29
1.1.1 SESAR Project ... 30
1.2 Objectives and Contributions ... 32
1.2.1 Objectives ... 32 1.2.2 Original Contributions ... 33 1.3 Dissertation Organization ... 34 2 GNSS in Civil Aviation ... 37 2.1 GNSS Background ... 37 2.1.1 GNSS Signals ... 37
2.1.2 PVT Computation and Pseudorange Measurement ... 38
2.1.3 The Geometry Aspect ... 39
2.1.4 Measurement Model and Error Budget ... 40
2.2 Civil Aviation Applications ... 50
2.2.1 GNSS Signals for Civil Aviation ... 52
2.2.2 Accuracy Improvement ... 53
2.2.3 Integrity Improvement ... 61
2.2.4 Augmentation Systems ... 62
2.3 GBAS ... 65
2.3.1 GBAS Architecture ... 67
2.3.2 GBAS Measurements Processing ... 69
2.3.3 GBAS Integrity Monitoring ... 73
2.3.4 GBAS Approach Service Type ... 80
3 MC/MF GBAS Ground Multipath and Noise Model ... 89
3.1 Objectives and Motivations ... 89
3.2.1 The CMC: a Useful Combination to Evaluate Noise and Multipath ... 90
3.2.2 Impact of Modulation on Noise and Multipath ... 95
3.2.3 Residual Biases Detection ... 97
3.2.4 Effect of the Time Correlation of the Error on the Smoothed Measurements ... 99
3.2.5 Inter-Frequencies Error Correlation ... 100
3.2.6 Error Correlation over Two Reference Receivers ... 101
3.3 Results on Noise and Multipath Errors Characterization ... 102
3.3.1 Experimental Set-up Description... 102
3.3.2 Noise and Multipath on Different Signals ... 106
3.3.3 MLA Calibration on L5 ... 111
3.3.4 Smoothing Efficiency ... 115
3.3.5 Assessment of I-Free RMS ... 121
3.3.6 Averaged Noise and Multipath ... 123
3.3.7 Synthesis of the Results ... 124
3.4 σ𝑝𝑟 𝑔𝑛𝑑 Computation ... 125
3.4.1 Synthesis of the 𝜎𝑝𝑟 𝑔𝑛𝑑 Calculation Process... 126
3.4.2 Day-to-Day Repeatability ... 127
3.4.3 Statistical Uncertainty Inflation ... 131
3.4.4 Error Correlation between Reference Receivers ... 134
3.4.5 Long Term Error Variation (Seasonal Effects) ... 136
3.4.6 Ground multipath model ... 136
3.4.7 𝜎𝑝𝑟 𝑔𝑛𝑑 Results ... 136
3.5 Conclusions ... 139
4 Satellite Selection ... 141
4.1 Motivations and Objectives ... 141
4.2 Satellite Selection Methods ... 141
4.2.1 Optimal Solution ... 142
4.2.3 Lear’s Simple Satellite Selection ... 142
4.2.4 Fast Satellite Selection Algorithm ... 143
4.3 Selected Methods for Simulation ... 145
4.4 Simulations Baseline ... 146
4.4.1 Airports Coordinates ... 146
4.4.2 DOP Analysis and Computational Load ... 147
4.4.3 Protection Level Computation ... 148
4.4.4 Geometry Screening Availability ... 148
4.5 Simulation Results ... 148
4.5.1 Dual Constellation 12 Satellite subset ... 148
4.5.2 Dual Constellation 15 Satellites Subset ... 159
4.6 Conclusions ... 168
5 GBAS Integrity ... 171
5.1 The GAST D Concept ... 173
5.1.1 Low Level Performance Requirements for Ground Monitors ... 174
5.1.2 Geometry Screening ... 176
5.1.3 SiS TTA ... 177
5.2 GAST D Integrity Monitoring ... 179
5.2.1 GAST D Monitors State-of-Art ... 179
5.2.2 GAST D Monitoring Challenges ... 193
5.2.3 GAST-D RAIM Baseline and Results ... 203
5.3 GAST-F Integrity Monitoring ... 214
5.3.1 GAST-F Monitoring Challenges ... 214
5.3.2 GAST-F Monitors Evaluation ... 215
5.3.3 GAST-F RAIM Baseline and Results ... 220
5.4 Conclusions ... 227
6 Conclusions and Future Works ... 229
6.2 Perspectives for Future Works ... 232
7 References ... 233
A. Civil Aviation Authorities and Requirements ... 241
A.1 Civil Aviation Authorities ... 241
A.1.1 International Civil Aviation Organization (ICAO) ... 241
A.1.2 Radio Technical Commission for Aeronautics (RTCA, Inc.) ... 241
A.1.3 European Organization for Civil Aviation Equipment (EUROCAE) ... 242
A.1.4 Federal Aviation Authority (FAA) and European Aviation Safety Agency (EASA) . 242 A.2 Phases of Flight ... 242
A.2.1 Approach ... 244
A.3 Performance Based Navigation (PBN) ... 246
A.4 Performance Navigation Criteria ... 248
A.4.1 Accuracy ... 249
A.4.2 Availability ... 249
A.4.3 Integrity ... 249
A.4.4 Continuity ... 250
A.5 Annex 10 Signal in Space Requirements ... 250
8.1 CAT II/III Requirements ... 252
B. GBAS Messages ... 255
B.1 Type 1 Message – Pseudorange Correction ... 256
B.2 Type 2 Message – GBAS Related Data ... 258
B.3 Type 11 Message – Pseudorange Corrections for 30 Seconds Smoothed Pseudorange ... 259
C. MC/MF GBAS Ground Multipath and Noise Model ... 261
C.1 Pattonville 50 Meters Case ... 261
C.2 Pattonville 100 Meters Case ... 263
C.3 Toulouse Blagnac Airport ... 265
C.3.1 03/04/2016 ... 265
C.3.3 09/04/2016 ... 275
C.4 MLA Calibration on L5 ... 279
C.5 Smoothing Efficiency ... 281
C.5.1 Pattonville Results ... 281
C.5.2 Toulouse Blagnac 03/04/2016 Results ... 284
C.5.3 Toulouse Blagnac 06/04/2016 Results ... 286
C.5.4 Toulouse Blagnac 09/04/2016 Results ... 288
C.6 Optimal Smoothing Constant ... 290
C.7 Assessment of I-Free RMS ... 292
List of Figures
Figure 1 – GNSS signals frequency plan (www.navipedia.net/index.php/GNSS_signal) ... 37
Figure 2 – Positioning obtained through trilateration ... 38
Figure 3 – Simplified ionospheric wave front model (Luo, et al., 2004) ... 45
Figure 4 – LOS multipath example ... 48
Figure 5 – NLOS multipath example ... 49
Figure 6 – Differential GNSS simplified scheme ... 54
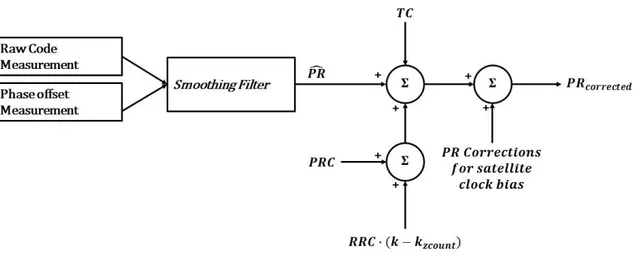
Figure 7 – Block diagram of carrier smoothed code processing ... 56
Figure 8 – SBAS ionospheric corrections adapted from (Escher, et al., 2014) ... 62
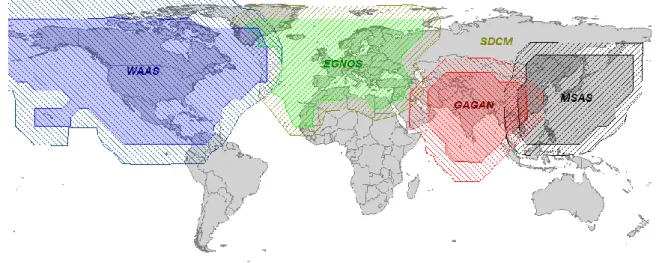
Figure 9 – Global SBAS coverage map (gpsworld.com) ... 63
Figure 10 – Ground station facilities spread over Europe for EGNOS SBAS system ... 64
Figure 11 – GBAS Runway coverage ... 67
Figure 12 – Typical GBAS architecture ... 68
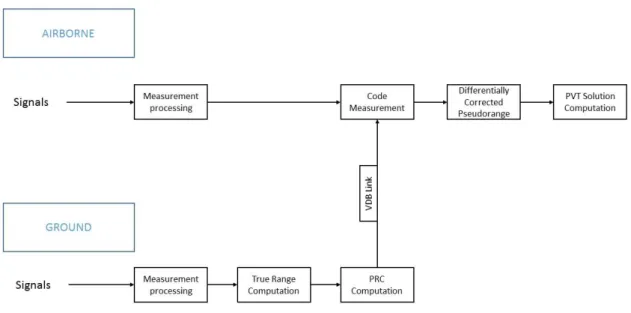
Figure 13 – Airborne measurement processing ... 72
Figure 14 – GBAS integrity risk allocation (ICAO, 2006) ... 74
Figure 15 – Timing diagram for differential processing below 200 ft. (Brenner, et al., 2010) ... 75
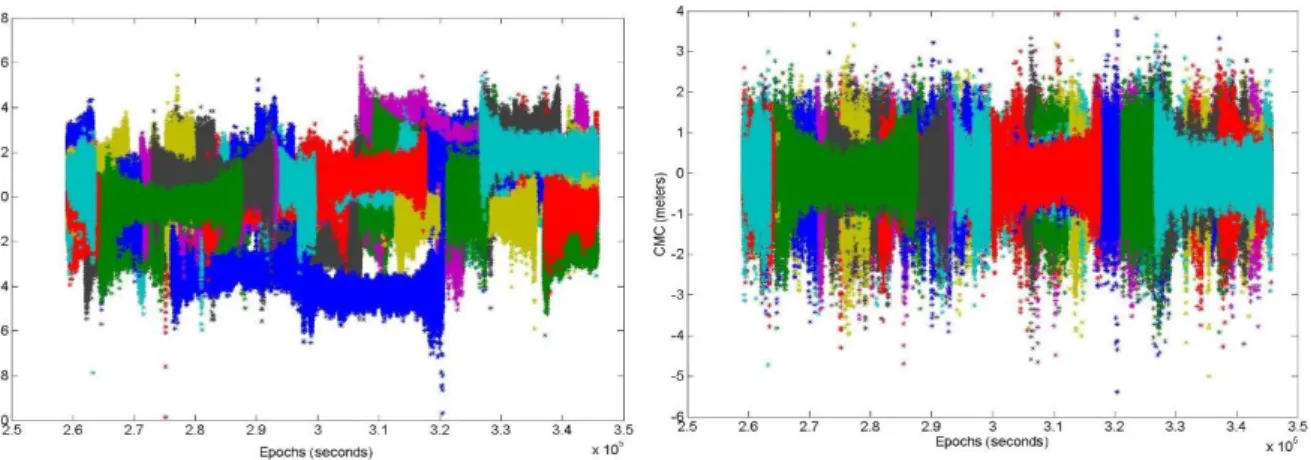
Figure 16 – service type, facility classification and airborne equipment classes (RTCA Inc.; DO253-C, 2008) . 81 Figure 17 – CMCs before (left) and after (right) phase ambiguity term compensation (each color represent a PRN) ... 93
Figure 18 – Pseudorange from one satellite, visible twice in a day ... 94
Figure 19 – Early-Late discriminator tracking of GPS satellites (RTCA Inc.; DO253-C, 2008) ... 95
Figure 20 – Thermal noise standard deviation Vs. C/N_0 ... 96
Figure 21 – Code Tracking Delay for One Path Multipath ... 97
Figure 22 – Antenna positions for data collection at Pattonville airport ... 103
Figure 23 – MLA antenna and reflector building in Pattonville airport ... 104
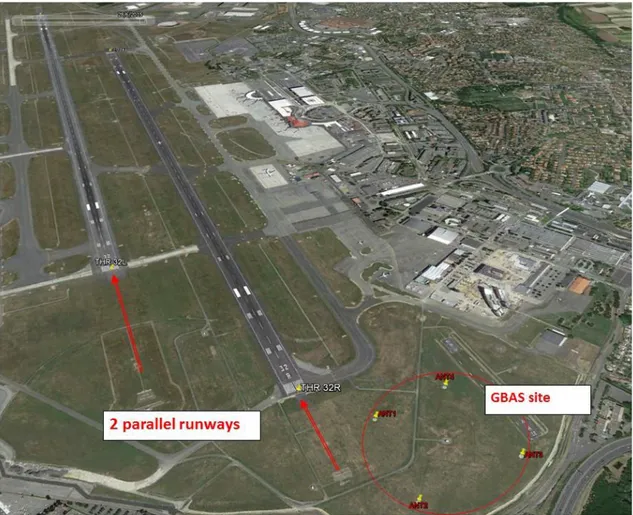
Figure 24 – Toulouse Blagnac airport GBAS ground station (Ladoux, 2016) ... 105
Figure 25 – GPS L5 raw CMC time series for one satellite, with and without epoch continuity detection ... 106
Figure 26 – GPS L1 C/A, GPS L5 and I-Free Raw and 100 seconds smoothed CMCs for All Satellites Toulouse Blagnac RR1 ... 107
Figure 27 – Galileo E1 C/A, E5a and I-Free Raw and 100 seconds smoothed CMCs for All Satellites Toulouse Blagnac RR1 ... 109
Figure 28 – GPS and Galileo CMCs standard deviation for raw and smoothed cases on all signals ... 110
Figure 29 – Comparison between RMS and standard deviation for 100 s. smoothed GPS and Galileo signals . 112 Figure 30 – GPS L5 CMCs Mean Value (left) St. Deviation (right) Vs. Elevation Angle for All Satellites across Three Days ... 113
Figure 31 – Calibrated raw and 100 s smoothed CMCs for GPS signals on RR1 ... 114
Figure 32– Calibrated raw and 100 s smoothed CMCs for Galileo signals on RR2 ... 115
Figure 35 – Autocorrelation function for Galileo E1 and E5a for different satellites ... 118
Figure 36 – Standard deviation comparison for different Smoothing constants for GPS and Galileo signals .... 120
Figure 37 – Real and theoretical I-free CMCs RMS comparison on GPS for PRN 3 (a) PRN 8 (b) and Galileo PR8 (c) and PRN 26 (d) ... 122
Figure 38 – RMS difference percentage distribution for GPS I-free (left) and Galileo I-free (right), each color represents a satellite ... 122
Figure 39 – Standard deviation comparison between empirical and theoretical value for GPS CMCs (a and c) and Galileo CMCs (b and d) ... 123
Figure 40 – Day-to-day autocorrelation functions for different elevation angles ... 128
Figure 41 – CMCs and autocorrelation functions for all satellites with elevation angle bigger than 80° ... 129
Figure 42 – Galileo CMCs for four consecutive days ... 130
Figure 43 – Statistical uncertainty effects on Galileo signals for one, four and nine days comparison ... 131
Figure 44 – Inflation factor for statistical uncertainty fir different number of samples ... 132
Figure 45 – Number of independent samples per bin comparison for GPS ... 133
Figure 46 – Number of independent samples per bin, with unique bin for elevation >80°, for GPS ... 134
Figure 47 – 𝜌 coefficients as function of 𝑛 and 𝑟 ... 135
Figure 48 – 𝜎𝑝𝑟 𝑔𝑛𝑑 values for GPS and Galileo signals for 100 seconds smoothed case ... 137
Figure 49 – 𝜎𝑝𝑟 𝑔𝑛𝑑 values for GPS and Galileo signals for 30 seconds smoothed case ... 137
Figure 50 – 𝜎𝑝𝑟 𝑔𝑛𝑑 values for GPS and Galileo signals for 300 seconds smoothed case ... 138
Figure 51 – Fast satellite selection sky subdivision example (Zhang, et al., 2008) ... 145
Figure 52 – Number of Satellites for all the simulated epochs and airports and 12 satellites subset in red ... 149
Figure 53 – Histogram of satellites number across all airports and epochs with percentage of use of satellite selection for subset 12 ... 149
Figure 54 – VDOP values across all epochs and airports for all the methods and for all-in-view satellites ... 150
Figure 55 – HDOP values across all epochs and airports for all the methods and for all-in-view satellites ... 151
Figure 56 – GAST-D VPL computed across all the epochs and airports for three selection methods and all-in-view satellites... 153
Figure 57 – GAST-D LPL computed across all the epochs and airports for three selection methods and all-in-view satellites... 154
Figure 58 – GAST D 𝑆𝑣𝑒𝑟𝑡 values across all epochs and airports for three methods and all-in-view satellites 154 Figure 59 – GAST D 𝑆𝑣𝑒𝑟𝑡2 values across all epochs and airports for three methods and all-in-view satellites ... 155
Figure 60 – I-Free VPL across all epochs and airports for three methods and all-in-view satellites ... 157
Figure 61 – I-Free LPL across all epochs and airports for three methods and all-in-view satellites ... 157
Figure 62 – I-Free 𝑆𝑣𝑒𝑟𝑡 values across all epochs and airports for three methods and all-in-view satellites ... 158
Figure 63 – I-Free 𝑆𝑣𝑒𝑟𝑡2 values across all epochs and airports for three methods and all-in-view satellites ... 158
Figure 64 – Number of satellites for all the epochs and airports and 15 satellites subset in red ... 160
Figure 65 – Histogram of satellites number across all airports and epochs with percentage of use of satellite selection for subset 15 ... 160
Figure 66 – VDOP values across all epochs and airports for all the selection criteria and for all-in-view satellites ... 161 Figure 67 – HDOP values across all epochs and airports for all the selection criteria and for all-in-view satellites ... 162 Figure 68 – GAST D VPL for all the epochs and airports for all the analyzed methods and all-in-view satellites ... 163 Figure 69 – GAST D LPL for all the epochs and airports for all the analyzed methods and all-in-view satellites ... 164 Figure 70 – GAST D 𝑆𝑣𝑒𝑟𝑡 computed for all the epochs and airports for all the analyzed methods and all-in-view satellite ... 164 Figure 71 – GAST D 𝑆𝑣𝑒𝑟𝑡2 computed for all the epochs and airports for all the analyzed methods and all-in-view satellites... 165 Figure 72 – I-Free VPL for all the epochs and airports for all the analyzed methods and all-in-view satellite .. 166 Figure 73 – I-Free LPL for all the epochs and airports for all the analyzed methods and all-in-view satellites . 166 Figure 74 – I-Free 𝑆𝑣𝑒𝑟𝑡 computed for all the epochs and airports for all the analyzed methods and all-in-view satellites... 167 Figure 75 – I-Free 𝑆𝑣𝑒𝑟𝑡2 computed for all the epochs and airports for all the analyzed methods and all-in-view satellites... 167 Figure 76 GBAS standards to support CAT III operations (ICAO NSP, 2010) ... 172 Figure 77 – GAST-F fallback modes example ... 173 Figure 78 – Derived limit case 𝑃𝑚𝑑 requirement for ranging source monitor (ICAO NSP, 2010)... 175 Figure 79 – General 𝑃𝑚𝑑 requirement for ranging source monitors in range domain ... 175 Figure 80 – Example of monitor performances Vs. 𝑃𝑚𝑑 requirements ... 176 Figure 81 – Timing diagram derivation for below 200 ft. processing derived from (SESAR JU, 2011) ... 178 Figure 82 – Threat Model A: Digital failure ... 179 Figure 83 – Threat Model B: Analog failure mode ... 180 Figure 84 – Threat Model C: Analog and digital failure mode. ... 180 Figure 85 – Acceleration induced differential range error ... 185 Figure 86 – simulated ionospheric delay (left) and related smoothing time variant filter response ... 190 Figure 87 - 𝑃𝑚𝑑 performances for DSIGMA ... 191 Figure 88 – Ionospheric delay on two different RRs ... 192 Figure 89 – example of stationary front for possible worst case geometry (Lee, et al., 2011) ... 194 Figure 90 – IGM test statistic for Houston airport (ICAO NSP WGW/WP 16, 2014) ... 196 Figure 91 – Simulation of maximum induced delay for an ionospheric front impacting the aircraft but no the GS ... 198 Figure 92 – Ionospheric induced range error for different ionospheric angle ... 199 Figure 93 – Point along the approach used to derive DRAIM performances... 204 Figure 94 – DRAIM 𝑃𝑚𝑑 of ionospheric front induced error for GPS Optimal 24 and ∆𝑣 = 70 𝑚/𝑠 for all airports ... 208
Figure 95 – DRAIM 𝑃𝑚𝑑 for ionospheric front induced error for GPS 31 Satellites and ∆𝑣 = 70 𝑚/𝑠 for all airports ... 209 Figure 96 – DRAIM 𝑃𝑚𝑑 for ionospheric front induced error for GPS optimal 24 and ∆𝑣 = 35 𝑚/𝑠 for all airports ... 210 Figure 97 – DRAIM 𝑃𝑚𝑑 for ionospheric front induced error for GPS 31 Satellites and ∆𝑣 = 35 𝑚/𝑠 for all airports ... 211 Figure 98 – DRAIM 𝑃𝑚𝑑 for ionospheric front induced error for GPS optimal 24 and ∆𝑣 = 0 𝑚/𝑠 for all airports ... 212 Figure 99 – DRAIM 𝑃𝑚𝑑 for ionospheric front induced error for GPS 31 satellites and ∆𝑣 = 0 𝑚/𝑠 for all airports ... 213 Figure 100 – Timing diagram derivation for below 200 ft. processing with PRC update rate at 2.5 seconds .... 216 Figure 101 – 𝑃𝑚𝑑 values for different accelerations and K-values for new metric... 218 Figure 102 – integrity messages scheme ... 219 Figure 103 – DRAIM 𝑃𝑚𝑑 for an ionospheric front induced error for GPS & Galileo Optimal 24 and ∆𝑣 = 70 𝑚/𝑠 for all airports ... 223 Figure 104 – DRAIM 𝑃𝑚𝑑 for an ionospheric front induced error for GPS 31 satellites and Galileo Optimal 24 and ∆𝑣 = 70 𝑚/𝑠 for all airports ... 224 Figure 105 – DRAIM 𝑃𝑚𝑑 for an ionospheric front induced error for GPS & Galileo Optimal 24 and ∆𝑣 = 35 𝑚/𝑠 for all airports ... 225 Figure 106 – DRAIM 𝑃𝑚𝑑 for an ionospheric front induced error for GPS 31 satellites and Galileo Optimal 24 and ∆𝑣 = 35 𝑚/𝑠 for all airports ... 226 Figure 107 – Typical phases of flight (Cassel, et al., 1995) ... 243 Figure 108 – Phases of flight and GNSS augmentation (Montloin, 2011) ... 245 Figure 109 – Total system error components (Martineau, 2008) ... 248 Figure 110 – “ILS look-alike method” ... 253 Figure 111 – Autoland method ... 254 Figure 112 – GPS L1 C/A, GPS L5 and I-Free raw and smoothed CMC for all satellites Pattonville 50 m. case ... 262 Figure 113 – Raw (left) and 100 s. smoothed (right) CMC standard deviation for GPS L1, L5 and I-Free combinations Pattonville 50 m. case ... 263 Figure 114 – GPS L1 C/A, GPS L5 and I-Free for raw and smoothed CMCs for all satellites Pattonville 100 m. case ... 264 Figure 115 – Raw (left) and 100 s. Smoothed (right) CMCs Standard Deviation for GPS L1, L5 and I-Free Combinations Pattonville 100 m. case ... 265 Figure 116 – GPS L1 C/A, GPS L5 and I-Free raw and 100 seconds smoothed CMCs for all satellites Toulouse Blagnac RR1 03/04/2016 ... 266 Figure 117 – GPS L1 C/A, GPS L5 and I-Free raw and 100 seconds smoothed CMCs for all satellites Toulouse Blagnac RR2 03/04/2016 ... 267
Figure 118 – Galileo E1, Galileo E5a and I-Free raw and 100 seconds smoothed CMCs for all satellites Toulouse Blagnac RR1 03/04/2016 ... 268 Figure 119 – Galileo E1, Galileo E5a and I-Free raw and 100 seconds smoothed CMCs for all satellites Toulouse Blagnac RR2 03/04/2016 ... 269 Figure 120 – GPS L1 C/A, GPS L5 and I-Free raw and 100 seconds smoothed CMCs for all satellites Toulouse Blagnac RR1 06/04/2016 ... 271 Figure 121 – GPS L1 C/A, GPS L5 and I-Free raw and 100 seconds smoothed CMCs for all satellites Toulouse Blagnac RR2 06/04/2016 ... 272 Figure 122 – Galileo E, Galileo E5a and I-Free raw and 100 seconds smoothed CMCs for all satellites Toulouse Blagnac RR1 06/04/2016 ... 273 Figure 123 – Galileo E1, Galileo E5a and I-Free raw and 100 seconds smoothed CMCs for all satellites Toulouse Blagnac RR2 06/04/2016 ... 274 Figure 124 – GPS L1 C/A, GPS L5 and I-Free raw and 100 seconds smoothed CMCs for all satellites Toulouse Blagnac RR1 09/04/2016 ... 275 Figure 125 – GPS L1 C/A, GPS L5 and I-Free raw and 100 seconds smoothed CMCs for all satellites Toulouse Blagnac RR2 09/04/2016 ... 276 Figure 126 – Galileo E1, Galileo E5a and I-Free raw and 100 seconds smoothed CMCs for all satellites Toulouse Blagnac RR1 09/04/2016 ... 277 Figure 127 – Galileo E1, Galileo E5a and I-Free raw and 100 seconds smoothed CMCs for all satellites Toulouse Blagnac RR1 09/04/2016 ... 278 Figure 128 – Comparison between RMS and standard deviation for Pattonville 50 m (left side) and 100 m (right case). ... 279 Figure 129 – Calibrated raw and 100 s smoothed CMCs for GPS L5 and I-Free for Pattonville 50 m. case ... 280 Figure 130 – Calibrated raw and 100 s smoothed CMCs for GPS L5 and I-Free for Pattonville 100 m. case ... 281 Figure 131 – Real Vs. theoretical smoothing gain for GPS L1 C/A, GPS L5 and GPS I-Free for Pattonville 50 m (left side) and 100 m (right side) ... 282 Figure 132 – Autocorrelation function for GPS L1 C/A and L5 for satellite PRN 1 (a, b) and 24 (c, d) on Pattonville 50 m ... 283 Figure 133 – Autocorrelation function for GPS L1 C/A and L5 for satellite PRN 9 (a, b) and 25 (c, d) on Pattonville 100 m ... 284 Figure 134 – Real Vs. theoretical smoothing gain for GPS (left side) and Galileo (right side) signals for Toulouse Blagnac 03/04/2016 on RR1 ... 285 Figure 135 – Real Vs. theoretical smoothing gain for GPS (left side) and Galileo (right side) signals for Toulouse Blagnac 03/04/2016 on RR2 ... 286 Figure 136 – Real Vs. theoretical smoothing gain for GPS (left side) and Galileo (right side) signals for Toulouse Blagnac 06/04/2016 on RR1 ... 287 Figure 137 – Real Vs. theoretical smoothing gain for GPS (left side) and Galileo (right side) signals for Toulouse Blagnac 06/04/2016 on RR2 ... 288
Figure 138 – Real Vs. theoretical smoothing gain for GPS (left side) and Galileo (right side) signals for Toulouse Blagnac 09/04/2016 on RR1 ... 289 Figure 139 – Real Vs. theoretical smoothing gain for GPS (left side) and Galileo (right side) signals for Toulouse Blagnac 09/04/2016 on RR2 ... 290 Figure 140 – Standard Deviation Comparison for Different Smoothing Constants for GPS L1, GPS L5 and I-free on Pattonville 50 m (left side) and Pattonville 100 m (right side)... 291 Figure 141 – Real and theoretical I-free CMCs RMS comparison for satellite PRN 1 (left) and PRN 8 (right) Pattonville 50m ... 292 Figure 142 – Real and theoretical I-free CMCs RMS comparison for satellite PRN 1 (left) and PRN 8 (right) Pattonville 100m ... 292 Figure 143 – RMS difference percentage distribution for GPS I-free for Pattonville 50 m (left side) and 100 m (right side), each color represents a satellite ... 292 Figure 144 – Standard deviation comparison between empirical and theoretical value for GPS CMCs (a, c) and Galileo CMCs (b, d) 03/04/2016 ... 293 Figure 145 – Standard deviation comparison between empirical and theoretical value for GPS CMCs (a, c) and Galileo CMCs (b, d) 06/04/2016 ... 294 Figure 146 – Standard deviation comparison between empirical and theoretical value for GPS CMCs (a, c) and Galileo CMCs (b, d) 09/04/2016 ... 295
List of Tables
Table 1 – Comparison between Klobuchar and NeQuick models ... 43 Table 2 – Ionospheric gradient parameters (ICAO NSP, 2015) ... 45 Table 3 – Thermal noise standard deviation for DLL and PLL (Julien O., 2011/2012) ... 47 Table 4 – SiS performance requirements (ICAO, 2006) ... 51 Table 5 – GNSS Signals for Civil Aviation (ARINC Engineering Services, 2004) and (GJU-GALILEO Joint Undertaking, 2010) ... 53 Table 6 – 𝐾𝑓𝑓𝑚𝑑 Values... 76 Table 7 – 𝐾𝑚𝑑 Values ... 77 Table 8 – Vertical alert limit ... 78 Table 9 – Lateral alert limit ... 78 Table 10 – Ground reference receiver error allocation model ... 82 Table 11 – Summary of LAAS SIS residual errors (McGraw, et al., 2000) ... 83 Table 12 – Airborne thermal noise and interference error model parameters ... 84 Table 13 – 𝜎𝑝𝑟 𝑔𝑛𝑑 bound values for all analyzed signals for GPS and Galileo ... 139 Table 14 – GDOP values for different number of satellite at high elevation for a simulated study (Zhang, et al., 2008) ... 144 Table 15 – Airports coordinates used in simulation ... 147 Table 16 – VDOP percentile at 95, 99 and 99.9 % for 12 satellites subset ... 151 Table 17 – HDOP percentile at 95, 99 and 99.9 % for 12 satellites subset ... 151 Table 18 – Computational time, in seconds, for all methods with 12 satellites subset ... 152 Table 19 – Geometry screening availability for all the selection methods with 12 satellites and all in view case ... 155 Table 20 – Geometry screening availability for all selection methods and all in view case ... 159 Table 21 – VDOP percentile at 95, 99 and 99.9 % for 15 satellites subset ... 161 Table 22 – HDOP percentile at 95, 99 and 99.9 % for 15 satellites subset ... 162 Table 23 – Computational time, in seconds, for all methods with 15 satellites subset ... 163 Table 24 – DISGMA test metric standard deviation (ICAO NSP, 2016) ... 190 Table 25 – Difference speed limit for CCD detection ... 195 Table 26 – Airport latitude, longitude and runway heading for DRAIM simulation ... 203 Table 27 – ionospheric front induced range error (m) ... 205 Table 28 – Percentage of epoch with a not sufficient 𝑃𝑚𝑑 for GAST-D ... 214 Table 29 – Acceleration detected with 𝑃𝑚𝑑 = 10 − 9 for different K-values ... 218 Table 30– Percentage of epoch with a not sufficient 𝑃𝑚𝑑 for GAST-F ... 227 Table 31 – Decision height and visual requirements (ICAO, 2001) ... 246 Table 32 – SiS performance requirements (ICAO, 2006) ... 251 Table 33 – Alert limit associated to the typical operations (ICAO, 2006) ... 252 Table 34 – SiS performance requirements for various phases of aircraft operation ... 254
Table 35 – LAAS VHF Data Broadcast (VDB) messages and broadcast rate (DO-246D, 2008)... 255 Table 36 – GBAS message type required for each service level ... 256 Table 37 – Message type 1 format ... 257 Table 38 – Message Type 2 format ... 258 Table 39 – Additional data block 3 ... 259 Table 40 – Message Type 11 format ... 260
Table of Acronyms
AAD Aircraft Accuracy Designator
ADB Additional Data Block
AMD Airframe Multipath Designator
ABAS Aircraft Based Augmentation System
APV Approach with Vertical Guidance
ARAIM Advanced Receiver Integrity Monitoring
ARNS Aeronautical Radio Navigation Services
ATM Air Traffic Management
C/A Coarse Acquisition
CCD Code Carrier Divergence
CMC Code Minus Carrier
CNS Communication Navigation Surveillance
DF Divergence Free
DGNSS Differential GNSS
DH Decision Height
DRAIM Differential-Receiver Autonomous Integrity Monitoring DSIGMA Dual Solution Ionosphere Gradient Monitoring Algorithm
EGNOS European Geostationary Navigation Overlay Service
ESA European Space Agency
FAA Federal Aviation Administration
FASLAL FAS Lateral Alert Limit
FAST Facility Approach Service Type
FASVAL FAS Vertical Alert Limit
FD Fault Detection
FDE Fault Detection and Exclusion
FTE Flight Technical Error
GAD Ground Accuracy Designator
GAST GBAS Service Type
GBAS Ground Based Augmentation System
GFC GBAS Facility Classification
GLONASS GLObal'najaNAvigacionnaja Sputnikovaja Sistema
GLS GBAS Landing System
GNSS Global Navigation Satellite System
GPIP Glide Path Intersection Point
GPS Global Positioning System
HAL Horizontal Alarm Limit
HPL Horizontal Protection Level
IATA International Air Transport Association ICAO International Civil Aviation Organization
IF Ionosphere Free
IGM Ionosphere Gradient Monitor
ILS Instrumental Landing System
LAL Lateral Alarm Limit
LOS Line Of Sight
LPL Lateral Protection Level
LTP Landing Threshold Point
MC Multi Constellation
MF Multi Frequency
MT Message Type
NLOS Non-Line Of Sight
OACI l'Organisation de l'Aviation Civile Internationale
PA Precision Approach
PBN Performance Based Navigation
PRC PseudoRange Correction
PSE Path Steering Error
PVT Position Velocity and Time
RAIM Receiver Autonomous Integrity Monitoring
RNAV Area Navigation
RNP Required Navigation Performance
RR Reference Receiver
RRC Range Rate Correction
SARPs Standard And Recommended Practices
SBAS Satellite Based Augmentation System
SC Single Constellation
SF Single Frequency
SiS Signal in Space
SQM Signal Quality Monitor
TEC Total Electron Content
TTDAB Time-to-detect And Broadcast
TC Tropospheric Correction
TSE Total System Error
TTA Time-To-Alert
U.S. United States
VAL Vertical Alarm Limit
VDB VHF Data Broadcast
VPL Vertical Protection Level
WAAS Wide Area Augmentation System
1 Introduction
1.1 Background and Motivations
The civil aviation is the transport sector having experienced, during the last tens of years, the largest growth in term of passengers, tonnes of transported goods and number of trips. According to the International Civil Aviation Organization (ICAO), the number of transported passenger in 2012 was 2.9 billion, and will reach 3.6 billion by the end of 2016 according to International Air Transport Association (IATA). Tonnes of freight transported also need to be added to this data to provide a complete and accurate point of the situation of the civil aviation traffic demand.
To provide an efficient response to this trend, the entire system, comprising airplane, airports, air traffic management (ATM) systems need to improve or innovate their services to make operations more efficient and at the same time as safe as possible. In this scope, the creation of flexible routes for the approach and landing operation can bring a lot of benefits to the ATM segment, permitting also cleaner and less noisy operation.
The main system used to provide accurate guidance for the approach and landing, for the CAT III operations, is the Instrumental Landing System (ILS). Despite its capabilities to provide accurate guidance in the vertical and lateral axes, there are some limitations that make this system no longer the optimal choice for such operations, such as the fact that it can only provide information for straight-in trajectories. This condition limits, nowadays, the creation of different and flexible routes that permit to increase the number of operations-per-hour (take-off and landing) or to avoid to fly over city centres. Moreover this system is considered expensive since it has to be installed at each runway end to cover all approach routes. In order to develop new flexible routes another system, able to provide the same services as the ILS, must be found.
Nowadays, most of the civil aviation aircrafts are equipped with Global Navigation Satellite System (GNSS) receivers (90% of aircrafts according to EUROCONTROL Survey (Roelandt, 2014)) and it is recognized as a key technology in providing accurate navigation services with a worldwide coverage. GNSS concept was defined by the International Civil Aviation Organization (ICAO) in (ICAO, 2006). To use GNSS within the CNS (Communications, Navigation, and Surveillance)/ATM system, a stand-alone core constellation needs to be augmented to meet requirements specified by ICAO (ICAO, 2006) in terms of accuracy, integrity, availability and continuity. Therefore, several augmentation systems have been developed for this purpose:
GBAS (Ground Based Augmentation System) SBAS (Satellite Based Augmentation System)
1-INTRODUCTION
ABAS (Aircraft Based Augmentation System).
Among them, GBAS is considered as a very attractive system since it provides navigation services, with a level of performance comparable with the ILS currently used (Felux, et al., 2013). It uses the Differential GNSS principle to improve the performance of stand-alone GNSS in order to reach the accuracy required (ICAO, 2006). Nevertheless, accuracy is not the only parameter required to use a GNSS system for civil aviation: integrity must be provided as well. To provide the required integrity, GBAS is composed of a ground station able to monitor the presence of a variety of threats on the received GNSS signal. It includes several receivers, each one generating pseudorange measurements, with the aim to elaborate pseudorange corrections that have to be transmitted to the airborne receiver. An associated integrity message is generated by the ground station providing system and correction integrity information. Using this information, the user receiver is able to correct its own measurements and to exclude some of them in case of the presence of anomalous errors, thus guarantying the required integrity level.
Currently (as of 2016), GBAS has been certified for CAT I precision approaches, and some projects are ongoing to develop a concept for reaching CAT II/III requirements. This explains the interest of Civil Aviation, since GBAS may then become an alternative to classical ILS and MLS equipment which are currently the only means to achieve CAT II/III precision approaches.
In order to classify the GBAS services, the acronym GAST (GBAS Approach Service Type) has been created. Nowadays GAST-C is the service corresponding to the CAT I precision approach service, and it is the only one certified, using single constellation and single frequency core system. Two levels of service are under development to provide guidance for CAT II/III precision approach: GAST-D and GAST-F. The first one corresponds to a single constellation and single frequency GBAS as for the GAST C service, the main difference being the use of a double smoothing constant and the split of the responsibility for the integrity monitoring between ground station and airborne receivers. The GAST F service instead relies on dual constellation and dual frequencies GBAS; however the processing and monitoring schemes for this latter service are still under development.
1.1.1 SESAR Project
Contrary to the United States, Europe does not have a single sky, one in which air navigation is managed at the European level. Furthermore, European airspace is among the busiest in the world with over 33,000 flights (SESAR, 2009) on busy days and high airport density. This makes air traffic control even more complex.
The EU Single European Sky is an ambitious initiative launched by the European Commission in 2004 to reform the architecture of European air traffic management. It proposes a legislative approach to meet future capacity and safety needs at a European rather than a local level.
BACKGROUND AND MOTIVATIONS
The key objectives of the Single European Sky Advanced Research (SESAR) project are to (SESAR, 2009):
Restructure European airspace as a function of air traffic flows Create additional capacity
Increase the overall efficiency of the air traffic management system
Then, the major elements of this new institutional and organizational framework ATM in Europe consist of:
Separating regulatory activities from service provision, and the possibility of cross-border ATM services.
Reorganizing European airspace that is no longer constrained by national borders.
Setting common rules and standards, covering a wide range of issues, such as flight data exchanges and telecommunications.
Furthermore, the activities in the CNS domain constitute a significant level of investment within the SESAR program and are included in the Work Package 15 (WP15) named “Non-Avionic CNS System Work package”. It addresses CNS technologies development and validation also considering their compatibility with the Military and General Aviation user needs.
In WP 15 the sub-task 15.3 is dedicated to the NAVIGATION. Navigation systems developments in SESAR focus on the evolution of GNSS-based navigation technologies which will be developed to fulfil navigation performance supporting RNP (Required Navigation Performance) based operations as defined and validated in the operational projects of the program.
The SESAR work program integrates operational projects, which define new PBN (Performance Based Navigation) procedures and concepts, with the technical projects, which develop the Navigation tools and systems according to the operational needs, which are validated by the operational projects. For the underlying navigation sensor and system developments, SESAR projects aim to define the medium and long term GNSS baseline including the expected configuration of constellations, signals and augmentation systems (GBAS/ABAS/SBAS). This will drive the further developments within the program covering evolution from single constellation/single frequency (GPS L1 C/A) to multi-constellation/multi-frequency (GPS L1/L5 and Galileo E1/E5).
This PhD project is included inside this part of the SESAR project and more precisely in the WP 15.3.7 “Multi GNSS CAT II/III GBAS”.
1-INTRODUCTION
1.2 Objectives and Contributions
1.2.1 Objectives
As mentioned in the section above, current GBAS is based on GPS and GLONASS constellations and provides precision approach service down to Category I (CAT-I) using a single protected signal (GPS L1 C/A). The evolution of GBAS towards Multi-Constellation (MC) and Multi-Frequency (MF) is expected to provide better performance and robustness as well as the availability of new services. Several expected improvements (ICAO NSP, 2010) are listed below:
The development of a Multi-Constellation GBAS service will provide additional ranging sources that will permit to improve the availability of the service (improvement of the satellites geometry). Moreover, the presence of a larger number of satellites permits to increase the continuity of service in case of local atmospheric anomalies, such as ionospheric scintillation. This issue could be solved with the MC GNSS implementation because with more satellites in view, it would be much less likely that scintillation would result in loss of service. So, the availability of additional ranging sources and frequencies will improve the operational robustness.
The implementation of a second constellation, Galileo, will increase the continuity of service because in a case of total constellation failure, the entire system can rely on the other constellation ranging sources.
Future satellites will provide signals on multiple frequencies which allow to form combinations that remove the ionospheric delay from the measurement. Thanks to this properties MC/MF GBAS is expected to overcome the integrity problems experienced by GAST-D for ionosphere monitoring (Thales, 2006).
New signals will increase the robustness against unintentional interference and will improve the accuracy.
Despite the advantages listed above, a series of challenges and key issues have to be considered and solved before the system may be used. These include:
deriving system-level requirements,
selection of the optimal MF processing mode,
defining VHF Data Broadcast (VDB) transmission and format of the transmitted message from the GBAS VDB unit (Beck, et al.)
management of dual constellation at ground and aircraft sides, analysis and characterization of Galileo fault modes,
OBJECTIVES AND CONTRIBUTIONS
airborne performance and certification, operational impact,
standardization, validation and certification authorities’ involvement. In the frame of this thesis some of these points have been investigated or analyzed.
The selection of the optimal processing mode assumes that the performance of new signals and DF combinations are known in order to estimate the system accuracy for any possible mode. On this topic, the errors affecting the PseudoRange Corrections (PRC) have been analyzed. The objective is to derive new models that permit to characterize the ground performances considering the impact of new signals or combinations. The analysis has also considered the impact of different smoothing time constants and the impact of the inter-frequencies correlation and the correlation across Reference Receivers (RR). The increased number of available satellites, jointly with the presence of a second frequency, increases the number of corrections to broadcast from the ground station to the airborne receiver. Moreover, a further limitation can be represented by the limited number of channels available in an embedded receiver. A possible solution to this limitation is the implementation of a satellite selection algorithm. Other proposed solution regards the broadcast of correction at a lower rate or the modification of the current VDB message structure. In this thesis, an overview of satellite selection methods proposed in literature has been done and for some of them, the predicted availability and the Dilution of Precision (DOP) have been calculated and compared with the all-in-view solution.
Using new signals, and relying on DF combinations, one aspect that is impacted is the integrity monitoring. All monitors developed so far are in fact intended to work on Single Frequency (SF) using GPS L1 C/A as measurement. The use of new signals may require a modification of the current monitors or an assessment of new integrity performances. Moreover with an increased number of satellites, and a second frequency, the number of corrections to broadcast increases a lot. Possible solutions to increase the messages capacity consider to change the current processing mode, based on the broadcast of corrections with 2 Hz frequency, for a lower PRC and RRC update rate. The impact of all these changes have to be analyzed on all existing monitors to derive new performances according to the used processing scheme. It has to be considered that GAST-D, for instance is still under validation due to lack of integrity performances in monitoring ionosphere anomalies. The objectives in this part is to analyze and propose a solution to improve the monitoring under GAST-D. The solution proposed may be used also under GAST-F service whenever one of the two frequency will not be available, relying in this case on two constellations. The impact of a lower update rate is analyzed as well.
1.2.2 Original Contributions
1-INTRODUCTION
Analysis of PRC residual errors (noise and multipath) using real airport data for the new signals (GPS L5 and Galileo E1, E5a and for the I-free combination).
Code Minus Carrier calibration process for L5 band measurements on the BAE ARL-1900 antenna
Impact of different smoothing time constant on all signals and combination previously analyzed
Derivation of the inter-frequencies correlation impact on I-free combination
Computation of the 𝜎𝑝𝑟 𝑔𝑛𝑑 for all signals and combinations, and comparison with GAD
curves proposed for GPS L1 C/A in the frame of GAST-C service development
Degradation of the VDOP and HDOP when using a satellites subset, 12 and 15 satellites Analysis of the availability for a DC GBAS when subset is used for SF and I-free combinations Estimation of the feasibility of a lower PRC and RRC update rate on the acceleration monitor Analysis of the performances in using RAIM to monitor atmospheric anomalous conditions
not covered by the current GAST-D monitor scheme.
Analysis of the performances of RAIM for a DC/SF GBAS (GAST-F with a lost frequency) for the same ionosphere anomalous conditions defined for GAST-D.
1.3 Dissertation Organization
The thesis is organized in the following way. Chapter 2 introduces the main principles of GNSS introducing the error affecting the pseudorange measurement and causing an error on the computed position solution. The requirement to use GNSS in civil aviation are then introduced followed by the description of the main augmentation systems proposed so far: ABAS, SBAS and GBAS. A last section is entirely dedicated to the GBAS, the architecture, the messages and the integrity monitoring are presented in this section for GAST-C service. GAST-D and DC/DF GBAS, known as GAST-F are presented finally.
Chapter 3 concerns the analysis of the noise and multipath affecting the PRC at the ground station. In the first section, the methodology adopted to derive information about these two errors and all the analysis done are presented. In the following, the results for each analysis are shown. The last section of this chapter introduces the methodologies followed to compute the 𝜎𝑝𝑟 𝑔𝑛𝑑 values starting from a
limited set of empirical data.
Chapter 4 introduces the satellites selection methods found in literature and chosen to be analyzed. The simulation baseline is then introduced before providing the results for two subset sizes: 12 and 15 satellites. Results are given in term of VDOP and HDOP for the all-in-view and the analyzed methods in order to have an idea about the loss of accuracy. Then the predicted availability is obtained by
DISSERTATION ORGANIZATION
comparing the VPL and LPL with the related alert limit. The chapter will conclude on the interest to apply a satellite selection algorithm.
Chapter 5 is dedicated to the integrity monitoring. The first section introduces the main differences that exists between the concepts of GAST-C and D to derive the airworthiness. The following section introduces the monitors’ state-of-art for GAST-D. Then the challenges that are still active in the monitoring of the ionosphere anomalies, for GAST-D, are presented. The last part of the section proposes a solution to improve the integrity performances and the results obtained applying this solution. Another section is dedicated to the GAST-F challenges in the integrity monitoring domain. The impact of a different processing mode, with a lower PRC and RRC, on the excessive acceleration monitor is analyzed. Finally the same monitor solution proposed for GAST-D is applied to a particular GAST-F scenario, loss of one of the two frequencies, SF/DC GBAS case under the same conditions.
Chapter 6 provides the conclusion derived from the analysis of results obtained in the previous chapter and the perspectives for future works.
In the appendix A the civil aviation authorities and requirements are presented to help the understating of concepts introduced in chapter 2. Appendix B provides details about the GBAS messages structure. Appendix C shows the results of chapter 3 for all analyzed days and airports location.
2 GNSS in Civil Aviation
2.1 GNSS Background
The Global Navigation Satellite System (GNSS) is a concept developed by the ICAO (International Civil Aviation Organization) and more precisely by the FANS (Future Air Navigation Systems) committee.
“GNSS. A worldwide position and time determination system that includes one or more satellites constellations, aircraft receivers and system integrity monitoring, augmented as necessary to support the required navigation performance for the intended operation” (ICAO, 2006)
It is part of the CNS/ATM concept (Communication Navigation Surveillance/Air Traffic Management) which was also established by ICAO in 1983 but adopted in 1991. The latter was intended as a basis for the implementation of new technologies, such as communications by satellites and data transmissions, and its operational plan was adopted by ICAO in 2003 and remains set around the world. PVT Computation and Pseudorange Measurement.
2.1.1 GNSS Signals
The aim of this part is to briefly present the different signals that are available for a civil aviation.
Figure 1 – GNSS signals frequency plan (www.navipedia.net/index.php/GNSS_signal)
In Figure 1 the signals that are available for three different constellations, GPS, Galileo and GLONASS are shown according to the used frequency. They are:
2-GNSS IN CIVIL AVIATION
GPS L1 C/A, L2 and L5 Galileo E1, E5a, E5b and E6 GLONASS G1, G2 and G3
More details about the signals used in civil aviation will be given in section 2.2.1
2.1.2 PVT Computation and Pseudorange Measurement
In a GNSS system, the user’s position is computed based on the knowledge of the distances between the satellites and receiver antennas, known as ranges. A GNSS receiver estimates the satellite/user range by measuring the travel time of a signal emitted by the satellite and reaching the user, and then multiplying it by the speed of light (thus assuming travel through a vacuum).
Figure 2 – Positioning obtained through trilateration
As highlighted by Figure 2, it is theoretically possible to compute the 3-D user position based on three range measurements. In particular, knowing the satellites position (𝑥𝑠, 𝑦𝑠, 𝑧𝑠) and the distance 𝑟, it is
possible to solve a system formed as:
𝑟 = √(𝑥𝑠− 𝑥𝑢)2+ (𝑦
𝑠− 𝑦𝑢)2+ (𝑧𝑠− 𝑧𝑢)2 Eq. 2.1
Where the sub-index s stands for satellite and u stands for user.
The mechanism used by a GNSS system to measure the satellite/user range is however not fully compatible with Equation Eq. 2.1. Indeed, the user-satellite distance is in fact measured by comparing the emission and reception times of the transmitted signal. This assumes a common time scale between satellites and user receiver which is not the case in the design of satellite positioning systems to date (Kaplan, et al., 2006). Because of the presence of an offset between the satellite and receiver time, the actual receiver measurement includes a time bias. It is therefore called a pseudorange and can be modelled as follows: