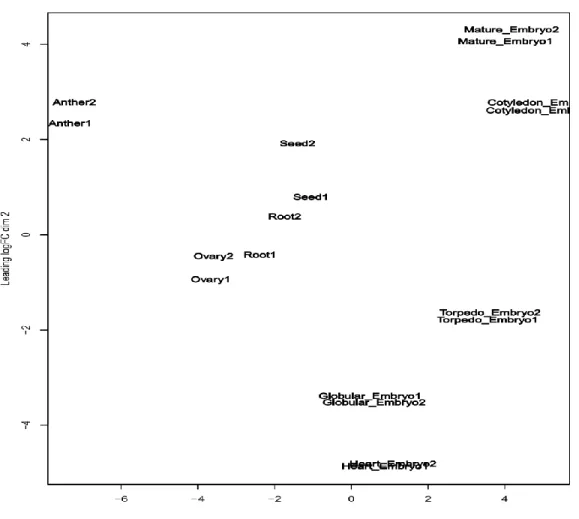
Figure S1. Multidimensional scaling (MDS) plot of nine different organs displaying the relative similarities between the biological replicates based on the log fold change values.
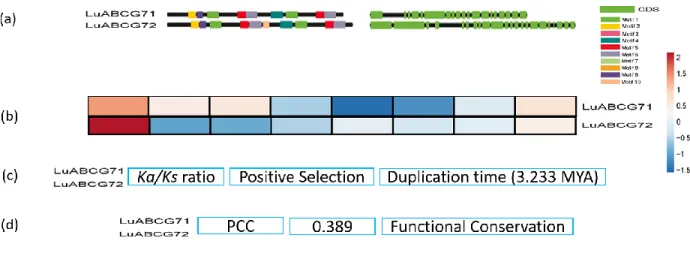
Figure S3. Schematic representations of the two most stable genes among nine Cd candidate genes based on their conserved gene structure (a), gene expression (b), non-synonymous/synonymous substitution rates (c), and Pearson correlation coefficient (PCC) (d).