HAL Id: tel-03035014
https://tel.archives-ouvertes.fr/tel-03035014
Submitted on 2 Dec 2020HAL is a multi-disciplinary open access
archive for the deposit and dissemination of sci-entific research documents, whether they are pub-lished or not. The documents may come from teaching and research institutions in France or abroad, or from public or private research centers.
L’archive ouverte pluridisciplinaire HAL, est destinée au dépôt et à la diffusion de documents scientifiques de niveau recherche, publiés ou non, émanant des établissements d’enseignement et de recherche français ou étrangers, des laboratoires publics ou privés.
Methodology to identify the key variables driving the
techno-economic feasibility of Trigeneration – Thermal
Storage systems
Mexitli Eva Sandoval Reyes
To cite this version:
Mexitli Eva Sandoval Reyes. Methodology to identify the key variables driving the techno-economic feasibility of Trigeneration – Thermal Storage systems. Chemical and Process Engineering. Ecole nationale supérieure Mines-Télécom Atlantique; Instituto superior técnico (Lisbonne), 2020. English. �NNT : 2020IMTA0182�. �tel-03035014�
T
HESE DE DOCTORAT DE
L
’É
COLEN
ATIONALES
UPÉRIEUREM
INES-T
ÉLÉCOMA
TLANTIQUEB
RETAGNEP
AYS DE LAL
OIRE-
IMT
A
TLANTIQUEET
I
NSTITUTOS
UPERIORT
ÉCNICO,
L
ISBOA,
P
ORTUGALECOLE DOCTORALE N°602
Sciences pour l'Ingénieur
Spécialité : Energétique, Thermique et Combustion
Methodology to identify the key variables driving the techno-economic
feasibility of Trigeneration – Thermal Storage systems
Thèse présentée et soutenue à Lisbonne, le 9 mars 2020 Unité de recherche : GEPEA UMR CNRS 6144
Thèse N° : 2020IMTA0182
Par
Mexitli Eva SANDOVAL REYES
Rapporteurs avant soutenance :
Patrícia Carla GAMA PINTO PEREIRA DA SILVA, Professeur adjoint Université de Coimbra
Luís Miguel PIRES NEVES, Professeur Coordinateur Institut Politechnique de Leiria
Composition du Jury :
Président : Paulo FERRÃO, Professeur IST, Université de Lisbonne
Examinateurs : Massimo SANTARELLI, Professeur Politechnic de Turin
Patrícia Carla GAMA PINTO PEREIRA DA SILVA, Professeur adjoint Université de Coimbra
Luís Miguel PIRES NEVES, Professeur Coordinateur Institut Politechnique de Leiria
Directeurs de Thèse : Bruno LACARRIERE, Professeur IMT Atlantique
Co-encadrant de Thèse : Carlos SANTOS, Professeur IST, Université de Lisbonne
Invité(s)
To my beloved family,
because they are and always will be my North Star.
To my brother Tenoch,
because he is still the most inspiring engineer I know.
To the reader,
because his/her time makes this work meaningful.
“The important thing is not to stop questioning. Curiosity has its own reason for existence. One cannot help but be in awe
when he contemplates the mysteries of eternity, of life, of the marvelous structure of reality. It is enough if one tries merely to comprehend a little of this mystery each day.
— Old Man's Advice to Youth: 'Never Lose a Holy Curiosity.’ LIFE Magazine (2 May 1955) p. 64”
ACKNOWLEDGMENTS
I would like to express my deepest gratitude to my supervisors Dr. Bruno Lacarrière, and Dr. Carlos Silva (mentioned in alphabetical order), as well as Dr. Pierrick Haurant. Their guidance and their scientific rigor contributed greatly to this thesis, but especially to my professional and personal learnings. I was very lucky to share this path with the three of them. Their combined support is the perfect balance.
I would also like to acknowledge Dr. Miguel Heleno and Alan Valenzuela for their support during my stay in the Lawrence Berkeley National Laboratory, California, US. I thank from the bottom of my heart to Tenoch Sandoval-Reyes, Monica Eskander, João Pires, and Aurora Villanueva for their academic collaboration. I have greatly enjoyed working with them and hopefully it will continue in the future.
I would like to extend my gratitude to Rui Pereira and João Patricio from the Project “Campus Sustentável”, as well as, Diana Neves, from the at the IST for their help to get the data used in this thesis.
In the personal sphere, I greatly thank the endless support and encouragement from my parents and siblings, from Richard, and from my friends Jorge, Erika, Liz, Vanessa, Max, Gabriel, Kai, Monica, Mina, Laura, Felix, Ian, Joana, André, Filip, Sandra, Maria, Helena, Marcelina, Andreia, Guillermo, Ângelo, Lumango, and Cristian. Life is much better with them.
Finally, I would like to acknowledge the Erasmus Mundus Joint Doctorate SELECT+ program Environomical Pathways for Sustainable Energy Services funded with support from the Education, Audiovisual, and Culture Executive Agency (EACEA) (Nr 2012-0034) of the European Commission. Also, the funding provided by the Fundação para a Ciência e a Tecnologia, Portugal [Project IN+ strategic, ID/EEA/50009/2013] is highly recognized. Moreover, I would like to acknowledge the InnoEnergy PhD School for providing financial support for an additional international education within the area of business management and innovation, as well as my stay in the Berkeley Lab.
This publication reflects the views only of the author(s), and the funders cannot be held responsible for any use, which may be made of the information contained therein.
INDEX
ACKNOWLEDGMENTS ... v INDEX ... vii LIST OF FIGURES ... xi LIST OF TABLES ... xv ACRONYMS ... xvii ABBREVIATIONS ... xixSYMBOLS AND NOMENCLATURE ... xxi
RÉSUMÉ LONG (Français) ... xxv
LONG ABSTRACT (English) ... xxxi
1 INTRODUCTION ... 1
1.1 Context ... 1
1.2 Combined thermal and power energy systems ... 1
Cogeneration ... 2
Trigeneration ... 3
Trigeneration with Thermal Storage ... 3
1.3 Market framework ... 5
Size of the thermal sector ... 5
Current status of CHP market ... 7
Relevant sectors for combined thermal and power energy systems ... 8
Key success factors for combined thermal and power energy systems 12 Perspective for thermal storage ... 13
1.4 Motivation ... 14
1.5 Hypothesis and Research questions ... 16
1.6 Outline of the thesis ... 16
2 LITERATURE REVIEW ... 19
2.1 Combined thermal and power energy systems ... 19
2.2 Relevant variables for the feasibility analysis ... 21
Energy prices ... 23
Energy loads ... 25
2.3 Computational tools to simulate energy system ... 27
2.4 Modeling and optimization of combined thermal and power energy systems ... 30
Optimization algorithms for combined thermal and power energy
systems ... 31
The general structure of the optimization model ... 33
PYOMO – CPLEX : a computational alternative ... 35
2.5 Sensitivity analysis ... 36
2.6 Position of the thesis ... 40
3 METHODOLOGY ... 43
3.1 General methodology ... 43
3.2 Phase I: Exploratory study of the CCHP-TS feasibility ... 44
Full factorial DoE ... 44
Modeling and optimization in DER-CAM... 45
Data analysis ... 47
3.3 Phase II: Sensitivity analysis of the CCHP-TS feasibility ... 53
Modeling and optimization solutions adapted to SA implementation ... 53
Sensitivity analysis – theoretical background ... 56
Global sensitivity analysis methods ... 57
Sampling methods ... 66
Global sensitivity analysis vs. full factorial DoE ... 69
3.4 Case study: A university campus ... 71
4 PHASE I: Exploratory study of the CCHP-TS feasibility ... 75
4.1 Sampling of scenarios from the case study ... 76
4.2 Energy system optimization: DER-CAM ... 77
4.3 Data analysis: Clustering ... 84
4.4 Results interpretation ... 91
Analysis of generation means for each energy carrier ... 92
Analysis of the energy flows within the CCHP-TS system ... 95
Analysis of the percentage of savings ... 97
Summary of results ... 102
4.5 Hypothesis regarding the impact of energy prices ... 103
Problem statement ... 103
Creating a hypothesis ... 104
Testing the hypothesis ... 104
4.6 Conclusions of the section ... 108
5 PHASE II: Sensitivity analysis of the CCHP-TS feasibility ... 109
5.1 Introduction ... 109
5.3 VARS – Variogram based approach ... 117
5.4 Sobol – Variance based approach ... 123
5.5 General conclusion of the sensitivity analysis ... 127
5.6 Overall comparison of the three SA methods ... 129
5.7 Isolines of the variables ... 131
6 CONCLUSIONS AND FUTURE WORK ... 137
6.1 General conclusions ... 137
6.2 Conclusions from the methodology ... 141
6.3 Future work ... 142
REFERENCES ... 145
ANNEX I. Consolidated output data from DERCAM... 165
ANNEX II. Equation used in MATLAB to extract information from DER-CAM reports ... 173
ANNEX III. Multi-criteria Decision Making ELECTRE 1S ... 183
LIST OF FIGURES
Figure 1 Méthodologie générale de cette thèse ... xxvi
Figure 2 General methodology of this thesis ... xxxii
Figure 3 Comparison of a trigeneration-thermal storage system vs. a conventional system, while meeting the annual loads Ln Ɐ n={E: electricity, H:heating, C:cooling} . 4 Figure 4 Estimated European heat market in 2010 including residential and service sector (Adapted from Persson, 2015 [26]) ... 5
Figure 5 Cooling demand total (top) and per capita (bottom) for selected countries in 2000 and 2017 (image adapted from [28]) ... 6
Figure 6 CHP electricity generation [TWh] and CHP share in the gross electricity generation for European countries in 2017 [31] ... 7
Figure 7 Share of type of useful thermal energy (by temperature) for the industry of EU27 in 2009 [27] ... 8
Figure 8 Industrial sectors that require thermal energy in Peta-Joules [PJ] (by temperature) for EU27 in 2009 [27] ... 9
Figure 9 Useful heat demand for Iron & steel, and non-metallic minerals (high temperature) and chemical (for low temperature). EU27 in 2009 [27] ... 10
Figure 10 Breakdown of useful energy demand for the service sector in EU-27 for 2009 ... 11
Figure 11 Household energy use (by end use) around the world [27] ... 11
Figure 12 Useful energy demand for the residential sector in EU-27 for 2009 ... 12
Figure 13 Subtropical desert places (adapted from the Global Solar Atlas [40]) ... 15
Figure 14 Household electricity price worldwide in 2016, by region (published by Statista Research Department [64]) ... 24
Figure 15 Wholesale natural gas prices worldwide in 2018, by region (data from the International Gas Union [65]) ... 24
Figure 16 European energy prices 2017 [66] ... 25
Figure 17 Electric energy demand depending on the dimension of the case study ... 26
Figure 18 General methodology of this thesis ... 44
Figure 19 Difference of percentage of savings reported by DER-CAM and the Python-PYOMO-CPLEX tool for 30 scenarios ... 56
Figure 20 VARS is based on pairs of points at the response surface. Adapted from Razavi, 2016 [161] ... 64
Figure 21 Image taken from Razavi, 2016 [111]. At left, the profile of three different response surfaces f1(x), f2(x), and f3(x). At right, their respective directional variograms. ... 65
Figure 22 based sampling with k=2 independent variables and r=2 STAR-centers [111] ... 66
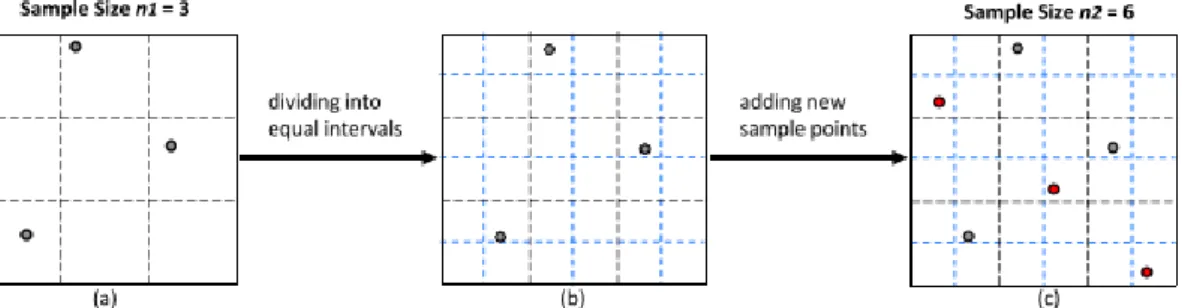
Figure 23 (a) Optimal LHS with low correlated factors and optimal space-filling (distribution of samples), (b) Sampling with good space-filling only, (c) LHS with very poor space-filling and highly correlated factors ... 67 Figure 24 Doubling procedure of PLHS with k=2 variables (a) Initial LHS with r=3 samples, (b) Dividing initial sample domain into 6 intervals with equal marginal probability ... 68 Figure 25 Load duration curves (left) and the normalized hourly pattern of the Electricity, Heating and Cooling loads for the IST Alameda Campus, expressed in hourly basis ... 72 Figure 26 Comparison of a trigeneration-thermal storage system vs. a conventional system, while meeting the annual loads Ln Ɐ n={E: electricity, H:heating,
C:cooling} ... 75 Figure 27 Refined methodology of Phase I ... 76 Figure 28 Example of one scenario out of the 600 possible, as part of the full factorial design of experiments. ... 77 Figure 29 Simulation data obtained from the full factorial design of experiments, using DER-CAM (example of SS4=6.6) ... 81 Figure 30 CHP Technology Mix Histogram (example of SS4=6.6) and its relationship with levels E, H, C, and percentage of savings. ... 83 Figure 31 Graphical explanation of the set of criteria for the MCDM ELECTRE 1S method ... 87 Figure 32 Clusters across the axis of annual loads E, H, C (example for SS4=6.6). . 90 Figure 33 Ternary diagram for the distribution of the percentage of Grid, Boiler, Absorption, and Heat Scrap across dominance rates (𝑟𝐸 , 𝑟𝐻 , 𝑟𝐶) and SS rates. ... 93 Figure 34 Ternary diagram for the distribution of E4E, E4C, E4CS, H4H, H4C and H4CS across dominance rates (𝑟𝐸 , 𝑟𝐻 , 𝑟𝐶) and SS rates. ... 96 Figure 35 Ternary diagrams of SS2, SS3 and SS4 for the distribution of the percentage of savings across dominance rates (𝑟𝐸 , 𝑟𝐻 , 𝑟𝐶) ... 98 Figure 36 Boxplots comparing 𝑟𝐸, 𝑟𝐻, 𝑟𝐶, and the percentage of savings for each cluster across the spark spread rates SS2-SS3-SS4. ... 100 Figure 37 Ternary diagrams of SS1 for the distribution of the percentage of savings across dominance rates (𝑟𝐸 , 𝑟𝐻 , 𝑟𝐶) ... 101 Figure 38 Boxplots comparing 𝑟𝐸, 𝑟𝐻, 𝑟𝐶, and the percentage of savings for each cluster across the spark spread rate SS1 = 3.0... 101 Figure 39 Average percentage of savings for each cluster across spark spread rates SS2-SS3-SS4. ... 103 Figure 40 Isolines for the price of electricity [$/kWh] ... 106 Figure 41 Isolines for the price of natural gas ... 107 Figure 42 Morris sensitivity indexes for the ranges 0 to 10 GWh/y (top), 0 to 100 GWh/y (middle), and 0 to 1000 GWh/y (bottom). Each range shows the analysis for the amount of savings (left) and the percentage of savings (right) ... 112
Figure 43 Morris sensitivity indexes for the ranges 0 to 5 GWh/y, 5 to 10 GWh/y, and 10 to 40 GWh/y. Each range shows the analysis for the amount of savings (left) and the percentage of savings (right) ... 115 Figure 44 Morris sensitivity indexes for the ranges 40 to 70 GWh/y, and 70 to 100 GWh/y. Each range shows the analysis for the amount of savings (left) and the percentage of savings (right) ... 116 Figure 45 Variogram of variables for the amount of savings (top), zoom (bottom) .. 119 Figure 46 Response surface (amount of savings) vs. the raw data corresponding to the four seed points for variables pE, pNG, E, H, and C. ... 120 Figure 47 Variogram of variables for the percentage of savings (top), zoom (bottom) ... 121 Figure 48 Response surface (percentage of savings) vs. the raw data corresponding to the four seed points for variables pE, pNG, E, H, and C. ... 122 Figure 49 Sobol SA indexes for amount of savings ... 124 Figure 50 Sobol SA indexes for percentage of savings ... 125 Figure 51 Three dimensional charts of the average amount and percentage of savings (left and right respectively), across pE, pNG, and E. ... 127 Figure 52 Isolines of pNG-E-H-C across the electricity price [pE] for the amount of savings (top); and addition of the isoline pNG=0.075, E=40, H=70, C=65 (bottom) 132 Figure 53 Isolines of pNG-E-H-C across the electricity price [pE] for the percentage of savings ... 133 Figure 54 Isolines of pE-E-H-C across the natural gas price [pNG] for the amount and percentage of savings (top and bottom respectively) ... 133 Figure 55 Isolines of pE-pNG-H-C across the annual electricity load [E] for the amount and percentage of savings (top and bottom respectively) ... 134 Figure 56 Isolines of pE-pNG-E-C across the annual heating load [H] for the amount and percentage of savings (top and bottom respectively) ... 135 Figure 57 Isolines of pE-pNG-E-H across the annual cooling load [C] for the amount and percentage of savings (top and bottom respectively) ... 136 Figure 58 Ternary diagrams of SS1, SS2, SS3, and SS4 for the distribution of the percentage of savings across dominance rates (rE , rH , rC). Taken from subsection 4.4.3. ... 138 Figure 59 Graphical explanation of Heat for Cooling (H4C) and Heat for Cooling Storage (H4CS) ... 179 Figure 60 Behavior of partial concordance Index [cjai, ak], depending on the value of qi, pi and Ωi. ... 184
LIST OF TABLES
Table 1 Papers studying combined thermal and power energy systems... 20
Table 2 General characteristics of the computational tools [79]–[81], [86], [87] ... 28
Table 3 Specific characteristics of the computational tools [79]–[87] ... 29
Table 4 Papers using optimization algorithms to assess the feasibility of combined thermal and power energy systems... 32
Table 5 Types of sensitivity analysis methods used in energy analysis ... 37
Table 6 Types of clustering: Inputs and outputs ... 48
Table 7 Comparison of clustering types ... 49
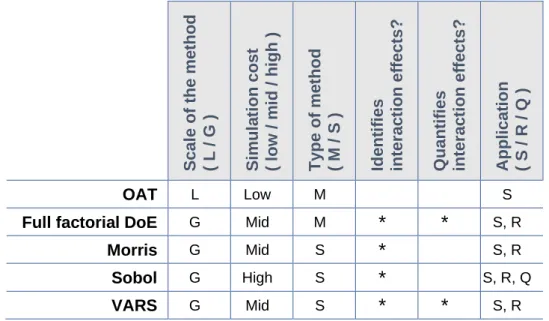
Table 8 Comparison of GSA methods against OAT, and full factorial DoE ... 70
Table 9 Energy prices used in DERCAM ... 78
Table 10 Technological settings for the reference scenario in DERCAM ... 78
Table 11 Technological settings for the CCHP-TS scenario (CHP prime movers) .... 78
Table 12 Technological settings for the CCHP-TS scenario (absorption chiller) ... 79
Table 13 Technological settings for the CCHP-TS scenario (thermal storage) ... 79
Table 14 Other settings used in DERCAM ... 79
Table 15 General information of the energy analysis for the scenarios belonging to the different SS rates ... 80
Table 16 Set of criteria for the MCDM ELECTRE 1S method ... 86
Table 17 Enlarged performance table (example of SS4=6.6)... 88
Table 18 Concordance matrix and outranking relations (example of SS4=6.6) ... 89
Table 19 Discordance matrix (example of SS4=6.6). Note: one means veto condition. ... 90
Table 20 Prices of electricity and natural gas (in cents of EUR / kWh) for the spark spread rates in chapter 4. ... 104
Table 21 Feasible combinations by fixing price of electricity and spark spread rate. ... 105
Table 22 Feasible combinations by fixing price of natural gas and spark spread rate ... 107
Table 23 First point of the 20 routes for the Morris SA ... 111
Table 24 Seed point for VARS SA ... 118
Table 25 Raw data obtained from DER-CAM report (part 1) ... 173
Table 26 Raw data obtained from DER-CAM report (part 2) ... 174
Table 27 Electricity and Heat produced by the CHP and scrapped ... 174
Table 28 Energy scrap produced by the CHP ... 175
Table 30 Source proportion for the whole system ... 176 Table 31 Source proportion for the whole system ... 178 Table 32 Source proportion for the whole system ... 180
ACRONYMS
BBD Box-Behnken Design of experiments
CCD Central Composite Design of experiments
CCHP Combined Heating, Cooling, and Power (Trigeneration). Also referred by some authors as CHCP
CHP Combined Heating and Power (Cogeneration)
COP Coefficient of performance
CT Combustion turbine
CTDB Combustion Turbine Duct Burner
DER-CAM Distributed Energy Resources Customer Adoption Model DHC District Heating and Cooling
DoE Design of experiments
EU European Union
GA Genetic algorithms
GAMS General Algebraic Modeling System (software)
GDP Gross domestic product
GSA Global sensitivity analysis
ICE Internal combustion engine
IEA International Energy Agency
IPCC Intergovernmental Panel on Climate Change
JRC Joint Research Centre (Europe)
LBNL Lawrence Berkeley National Laboratory
LHS Latin Hypercube Sampling
MCDM Multi-Criteria Decision-Making
MILP Mixed integer linear programming MINLP Mixed integer non-linear programming
OAT “One-at-a-time” sensitivity analysis
OECD Organization for Economic Co-operation and Development
SA Sensitivity analysis
SS Spark Spread
TS Thermal Storage
ABBREVIATIONS
Abs Absorption chiller
C# Cluster number # (in k-Means application)
CStg Cold storage
E4C Electricity produced by the CHP and used to cover cooling loads E4CS Electricity produced by the CHP and used to produce cold that will be stored E4E Electricity produced by the CHP and used to cover electric loads
HStg Heat storage
H4CS Heat produced by the CHP and used to produce cold that will be stored H4C Heat produced by the CHP and used to cover cooling loads H4H Heat produced by the CHP and used to cover heating loads
pSav Percentage of savings
SYMBOLS AND NOMENCLATURE
Nomenclature
C Annual size of the cooling load (in terms of energy) [GWh/y]
CoolingAbsorption(t)
Cooling produced with an Absorption chiller, in hourly basis [kW]
CoolingElectric(t) Cooling produced with vapor-compression chiller, in hourly basis [kW]
dim(h) No. of levels, where h={h1,…,hj ,…,hn} are the levels (in VARS SA)
dn(t) Hourly load pattern of the n energy carrier, where n={E: electricity , H: heating , C: cooling } [-/h]
E Annual size of the electric load (in terms of energy) [GWh/y] EEi Elementary effects of the variable i (in Morris SA)
ElectricityCHP(t) Electricity produced by CHP, expressed in hourly basis [kW]
ElectricityGrid(t) Electricity imported from the national grid, expressed in hourly basis [kW]
ElectricityCHPCS (t) Electricity produced by CHP and used to produce Cooling and store it, expressed in hourly basis [kW]
ElectricityCHPLC (t) Electricity produced by CHP and used to supply Cooling load, expressed in hourly basis [kW]
ElectricityCHPLE (t) Electricity produced by CHP and used to supply Electric load, expressed in hourly basis [kW]
EnergyCHP(t)
Total energy produced by CHP, expressed in hourly basis [kW] , including Electricity and Heat
H Annual size of the heating load (in terms of energy) [GWh/y] HeatingBoiler(t) Heating produced by a boiler, expressed in hourly basis [kW]
HeatingCHP(t)
Heating produced by CHP, expressed in hourly basis [kW]
NOTE: This is useful heat. Non-useful heat is the one that is produced and not consumed
HeatCHPCS (t) Heat produced by CHP and used to produce Cooling and store it, expressed in hourly basis [kW]
HeatCHPLC (t) Heat produced by CHP and used to supply Cooling load, expressed in hourly basis [kW]
HeatCHPLH (t) Heat produced by CHP and used to supply Heating load, expressed in hourly basis [kW]
Ln(t)
Hourly energy load of n carrier [kW], where n={E: electricity , H: heating , C: cooling }
n Number of seed point (in VARS SA)
p Number of levels (in Morris SA)
pE Price of the electricity from the national grid [$/kWh] pNG Price of the natural gas from the national grid [$/kWh]
R Range
r Number of seed point (in Morris SA)
rn Dominance rates of n carrier [-], where n={E: electricity , H: heating , C: cooling }
S1 Individual effects (in Morris SA)
S2 Interaction effects (in Morris SA)
Greek letters
γ(hi) Directional variogram of variable i (in VARS SA)
Δ Resolution or size of the step (in Morris SA) Δh Resolution or size of the step (in VARS SA)
μ Mean of the distribution of the elementary effects EEi ~ Fi (in Morris SA)
μ* Mean of the distribution of the absolute values of the elementary effects | EEi | ~ Gi (in Morris SA)
σ Standard deviation of the distribution of elementary effects EEi ~ Fi (in Morris SA)
RÉSUMÉ LONG (Français)
Mots clés: Systèmes de trigénération couplés à du stockage thermique, faisabilité
technico-économique, demandes en énergies, prix de l'énergie, analyse de sensibilité.
Les systèmes de trigénération couplés à du stockage thermique (CCHP-TS) contribuent à la production distribuée d'énergie et à la réduction des émissions de gaz à effet de serre. Ils sont conçus pour découpler la production et la consommation de chauffage, de froid et d'électricité. Néanmoins, il est important d'évaluer leur faisabilité technico-économique pour assurer une mise en œuvre à long terme. Par ailleurs, la détermination et la caractérisation des variables influentes sont essentielles pour identifier les domaines d'application les plus viables. Potentiellement, cela peut stimuler l'intérêt des chefs de projet, des investisseurs et des décideurs politiques, encourageant ainsi l'adoption de cette technologie.
Plusieurs auteurs suggèrent que les prix et les demandes en énergies (électricité, chaleur et froid) sont des variables importantes de la faisabilité technico-économique des systèmes combinés d'énergie thermique et électrique. Ils ont notamment utilisé le ratio Spark Spread (SS) qui est le rapport entre le prix de l'électricité du réseau et du combustible de cogénération. Cependant, seules quelques études, telles que celles de Hajabdollahi [1], et Cardona et al. [2], évaluent l’influence combinée des prix et de la demande en énergies. De plus, ces travaux présentent certaines limites dans leur modèle. Ainsi, Hajabdollahi étudie les charges mensuellement uniquement alors qu’une résolution temporelle plus courte de la demande est nécessaire pour plus de précision pour une analyse de faisabilité. Quant à Cardona et al., ils analysent les prix et les charges sur une base horaire, mais le modèle qu'ils proposent n'optimise que la stratégie d'opération et non la conception (puissances installées des systèmes) qu’ils supposent définie a priori.
La littérature mettant en avant les prix de l'énergie et les niveaux de demandes comme variables importantes, ce travail propose et analyse deux hypothèses : 1) Il existe un couplage entre les prix de l'énergie et la variabilité des demandes en énergies qui influe techniquement et économiquement sur la faisabilité des systèmes
CCHP-TS; 2) Les prix de l'énergie (électricité et gaz naturel) doivent être considérés séparément plutôt que d’utiliser seulement le ratio Spark Spread (SS).
Le travail repose sur une méthodologie divisée en deux phases, présentées sur la Figure 1.
Figure 1 Méthodologie générale de cette thèse
La première phase est une analyse exploratoire visant à démontrer que le modèle utilisé de CCHP-TS est pertinent et sensible aux variables d'analyse (prix et demandes énergétiques). Pour ce faire, nous utilisons l’outil DER-CAM et son modèle pour optimiser le système énergétique. La méthode d'analyse de sensibilité, quant à elle, met en œuvre un plan factoriel complet, en raison de sa simplicité, de sa capacité d'analyse globale et de la possibilité d'identifier les effets d'interaction. Après avoir effectué les simulations, les données sont analysées à l'aide d'une nouvelle combinaison de la méthode de «clustering» k-Means et d’une méthode d’aide à la décision multicritère (MCDM). Les enseignements tirés de cette première phase permettent de définir la méthodologie de la seconde phase et de proposer un modèle de simulation et d’optimisation pertinent et sensible aux variables d'analyse.
La seconde phase propose donc une analyse de sensibilité rigoureuse qui permet de plus une comparaison de trois «approches»: Morris («aproche» basée sur la dérivé), Sobol («aproche» basée sur la variance) et VARS («aproche» basée sur le variogramme). Chacune de ces méthodes est associée à différentes méthodes d'échantillonnage (Hypercube latin et Monte Carlo). Concernant la simulation et l'optimisation du système énergétique, DER-CAM est un outil limité pour effectuer le nombre de simulations nécessaires à une analyse de sensibilité globale. Par
LA PHASE I Analyse exploratoire de la faisabilité du CCHP-TS LA PHASE II Analyse de sensibilité de la faisabilité du CCHP-TS Hypercube latin et Monte Carlo Échantillonnage Optimisation du système énergétique L'analyse des données Interprétation des résultats Python PYOMO – CPLEX «Approches» d'analyse de sensibilité: Morris, Sobol, VARS
Indices d'analyse de sensibilité Plan factoriel complet DER-CAM «Clustering» k-Means et méthode d’aide à la décision multicritère (MCDM) Diagrammes ternaires et les ratios
de dominance des demandes
conséquent, pour la deuxième phase, un modèle adapté de simulation et d’optimisation de systèmes CCHP-TS (dévelopés en langage Python) est proposé. Le modèle est basé sur les bilans énergétiques et utilise la méthode MILP comme algorithme d'optimisation. En Python, cette approche MILP est mise en oeuvre à l'aide de la bibliothèque d'optimisation PYOMO et du solveur CPLEX. Cette combinaison puissante est une alternative aux logiciels commerciaux tels que GAMS, qui est couramment utilisé dans ce type de travaux. Par ailleurs, les prix de l'électricité et du gaz naturel sont étudiés de façon découplée, au lieu de les consolider dans le ratio Spark Spread.
Trois aspects montrent l'importance d’effectuer une analyse de sensibilité globale dans la deuxième phase, au lieu de conserver les résultats obtenus avec le plan factoriel complet pendant la première phase: 1) Le plan factoriel complet est une méthode guidée par le modèle utilisé, tandis que l'analyse de sensibilité globale est indépendante de celui-ci. Ces dernières reposent sur une exploration globale de l’espace contrairement aux méthodes guidées par un modèle 2) La précision du plan factoriel complet repose sur la dispersion de l'échantillon, tandis que l'analyse de sensibilité globale garantit un échantillonnage aléatoire et dispersé sur toute la plage des variables. 3) Le plan factoriel complet permet principalement l’identification d’effets individuels des paramètres et d'interaction possibles, tandis que les méthodes d'analyse de sensibilité globale, telles que Sobol, sont également utiles pour classer et quantifier la sensibilité relative des paramètres. La mise en œuvre complémentaire des trois méthodes d'analyse de sensibilité globales de cette deuxième phase a ainsi renforcé l'analyse de faisabilité technico-économique. Les résultats de cette analyse de sensibilité identifient cinq variables importantes à prendre en compte dans l’analyse de faisabilité, ainsi que les effets de leurs interactions. Ces variables sont: le prix de l'électricité [pE], le prix du gaz naturel [pNG], la demande électrique [E], la demande en chauffage [H] et la demande en froid [C]. L'ordre d’importance diffère selon que l’indicateur de performance économique utilisé soit absolu (montant d'économies réalisées [$]) ou relatif (pourcentage d'économies réalisées [%]). Ci-dessous, la description des résultats et la réponse aux deux hypothèses formulées.
HYPOTHÈSE 1
Oui, il existe un couplage entre les prix de l'énergie et les demandes énergétiques qui influe sur la faisabilité des systèmes de trigénération couplés à du stockage thermique. Les effets de ce couplage dépendent de l’indicateur de performance économique considérée.
Concernant leur impact sur le montant d'économies réalisées, le prix de l’électricité (pE), le prix du gaz (pNG) et la demande en électricité (E) sont, de loin, les variables les plus importantes, tandis que les effets des demandes en chaleur et en froid (H et C respectivement) semblent relativement négligeables. Les principaux effets d'interaction impliquent la demande électrique et les prix de l'énergie (pNG et E-pE). En d'autres termes, avoir une demande électrique importante est en faveur d’un système CCHP-TS, d’autant plus que le prix du gaz sera faible et celui de l’écetricité élevé, et inversement Il est par ailleurs montré que, pour des valeurs pE et pNG déterminées, une augmentation des demandes améliore le montant des économies réalisées par la mise en oeuvre de ce type de systèmes . Enfin, il est important de mentionner que le prix du gaz pNG est une variable singulière qui a des effets d'interaction avec toutes les autres.
Concernant les effets d'économies relatives réalisées, les prix de l'énergie pE et pNG apparaissent comme les variables les plus importantes. La demande en électricité E reste plus influente que H et C, mais devient moins impactante que sur les économies absolues. Cela tiend au fait que pour l’indicateur du montant d'économies, il existe un lien direct entre l'argent économisé et la demande E, tandis que le pourcentage d'économies tient compte des proportions plutôt que du montant total. Néanmoins, il est à noter que lorsque les économies relatives sont utilisées comme indicateur de faisabilité, l'influence des trois demandes (E, H et C) est légèrement plus équilibrée que lorsque la faisabilité est étudiée via le montant des économies. Le prix du gaz pNG est icic aussi la seule variable qui a des effets d'interaction avec toutes les autres dont certains aspects attirent l'attention. Le couplage pNG-pE est notablement plus fort que dans le cas d’un montant absolue d'économies, ce qui suggère que le ratio Spark Spread pourrait être plus pertinent pour analyser les économies relatives que les économies absolues. Cependant, on constate que les demandes énergétiques ont des effets d'interaction presque exclusivement avec le pNG. Par conséquent, la importance de E, H et C n'est fortement liée qu'au prix du gaz naturel.
HYPOTHÈSE 2
Concernant l'intérêt d'étudier séparément les prix de l'énergie, on peut dire que les deux paramètres pE et pNG, sont importants individuellement quelle que soit l’indicateur de performance économique utilisé (montant absolu ou pourcentage d'économies réalisées). De plus, ils sont clairement liés, directement ou indirectement. Cependant, la principale différence entre les deux est que pNG intéragit avec toutes les autres variables, indiquant une influence plus large. En ce qui concerne spécifiquement le pourcentage d'économies, les demandes énergétiques interagissent presque exclusivement avec le pNG. De plus, bien que le pE ait également de forts effets d'interaction avec le pNG, il est montré que contrairement à la règle générale établie par les organismes gouvernementaux internationaux, le seuil du ratio Spark Spread pourrait être inférieur à la valeur usuelle (SS=3) en fonction du prix du gaz naturel. Il est donc recommandé d'analyser séparément les prix de l'énergie pour évaluer la faisabilité des systèmes de trigénération couplés à du stockage thermique
Au-delà des résultats techniques, la contribution de cette thèse comprend l'adaptation d'un modèle de pas de temps horaire des systèmes CCHP-TS dans un langage de programmation qui permet une analyse de sensibilité agile. De plus, la mise en œuvre des trois méthodes d'analyse de sensibilité a permis d'identifier leurs avantages et leurs limites. Cette complémentarité a ainsi renforcé l'analyse de faisabilité technico-économique des systèmes de trigénération couplés à du stockage thermique.
LONG ABSTRACT (English)
Key words: Trigeneration systems with thermal storage, techno-economic feasibility,
energy loads, energy prices, sensitivity analysis.
Trigeneration systems with thermal storage (CCHP-TS) contribute to the distributed generation of energy and the reduction of greenhouse gas emissions. They are designed to decouple the production and consumption of heating, cooling and electricity. Nevertheless, it is important to assess their techno-economic feasibility to ensure long-term implementation. Moreover, determining and characterizing the influential variables is essential to identify the most viable application fields. Potentially, this could foster the interest of project managers, investors, and policymakers, therefore encouraging the adoption of this technology.
Several authors suggest that energy prices and loads are important variables for the techno-economic feasibility of combined thermal and power energy systems. Particularly they have explored the Spark Spread rate, a ratio between the price of electricity from the grid and the price of CHP fuel. However, just a few studies, such as Hajabdollahi [1], and Cardona et al. [2], assess the prices and loads together. Moreover, they present some limitations in their analysis. Hajabdollahi study the loads in monthly basis, but a smaller time-step in the loads is important because it gives more precision to the feasibility analysis. As for Cardona et al., they analyze prices and loads in hourly basis, but the model they propose only optimizes the operation strategy, while the design (installed capacity of the equipment) is an assumption. As the literature reveals that energy prices and loads size are important variables, this study aims to take a university campus as case study and analyze two hypotheses proposed: 1) There is a combination of energy prices and the size of the annual energy loads that makes techno-economically feasible a CCHP-TS system; 2) The energy prices (electricity and natural gas) should be considered separately instead of consolidating them into the spark spread rate (SS).
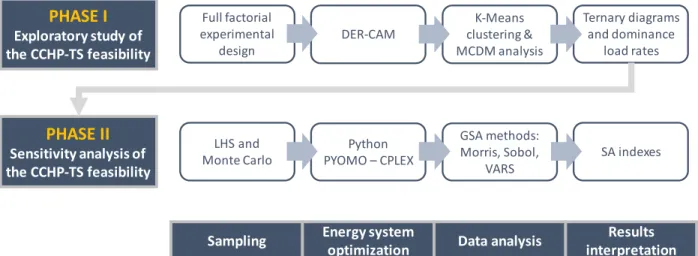
The analysis is divided into two phases, exhibited the general methodology of Figure 18.
Figure 2 General methodology of this thesis
The first one is an exploratory study aiming to demonstrate that the model for CCHP-TS is relevant and sensitive to the variables of analysis (energy prices and loads). To take advantage of the computational tools, we use DER-CAM and its embedded model to optimize the energy system. As for the sensitivity analysis method, it implements a full factorial design of experiments, due to its simplicity, ability to analyze globally, and the possibility of identifying interaction effects. Once the simulations are conducted, the data gets analyzed using a novel combination of k-Means clustering and multicriteria decision making (MCDM). The learnings from this first phase are the cornerstone for the second one, because the objective is to demonstrate that the model is relevant and sensitive to the variables of analysis.
The second is a in depth sensitivity analysis and the comparison of three approaches: Morris (derivative-based approach), Sobol (variance-based approach), and VARS (variogram-based approach). Each of them incorporates their corresponding sampling methods (LHS and Monte Carlo). Regarding the energy system optimization, DER-CAM is a limited tool to perform the amount of simulations required for a global sensitivity analysis. Therefore, for the second phase, we adapted the model of a CCHP-TS system into the programming language Python. The model is based on energy balances and uses MILP as optimization algorithm. In Python, the MILP model is solved using the optimization library PYOMO and the solver CPLEX. This combination is a powerful alternative to commercial software such as GAMS, which is commonly used in this context. In addition, it is worth mentioning that at this
PHASE I Exploratory study of the CCHP-TS feasibility PHASE II Sensitivity analysis of the CCHP-TS feasibility LHS and Monte Carlo
Sampling Energy system
optimization Data analysis
Results interpretation Python PYOMO – CPLEX GSA methods: Morris, Sobol, VARS SA indexes Full factorial experimental design DER-CAM K-Means clustering & MCDM analysis Ternary diagrams and dominance load rates
stage, electricity and natural gas prices are studied separately, rather than consolidating them into Spark Spread.
Three aspects exhibit the importance of conducting a global sensitivity analysis in the second phase, instead of keeping the results obtained with the full factorial design of experiments during the first phase: 1) The factorial design of experiments is a model-based method, while global sensitivity analysis is model-free. Model-free methods are not related to any local reference at the model. In other words, while a model-free method takes the samples randomly, a model-based method takes them based on a specific starting point or indication given by the user. 2) The accuracy of the factorial design of experiments relies on the sample dispersion, while the global sensitivity analysis ensures a random and dispersed sampling across the range of the variables. 3) The factorial design of experiments is primarily for screening purposes and provides an idea of the individual and interaction effects of the parameters, while global sensitivity analysis methods, such as Sobol, are useful also for ranking and quantifying the relative sensitivity of the parameters. In general, the complementary implementation of the three global sensitivity analysis methods in this second phase thereby reinforced the techno-economic feasibility analysis.
The results of the sensitivity analysis rank five variables from the least to the most relevant, as well as their interaction effects. The variables are: the electricity price [pE], the natural gas price [pNG], the annual size of electric loads [E], the annual size of heating loads [H], and the annual size of cooling loads [C] (Note that E, H, and C are expressed in energy). The order of relevance relies on the measure used for the techno-economic performance of the CCHP-TS system. It can be amount of savings [$] or the percentage of savings [%]. Below the description of the results and the answer to the two hypotheses formulated.
HYPOTHESIS 1
Yes, there are combination of energy prices and size of the energy loads that make a Trigeneration – Thermal Storage feasible. The optimal combination depends on the metric considered.
When talking about the amount of savings, pE, pNG, and E are, by far, the most relevant variables. While H and C seem comparatively unimportant. The main
interaction effects are between the electricity load and the energy prices (E – pNG and E – pE). In other words, having a large E is good, but it should be along with a small pNG and high pE. Vice versa it is also true. It was show that, for determined pE and pNG, an increase of the loads rises the amount of savings. Finally, it is good to mention that pNG is a singular variable that has interaction effects with all the others. When talking about the percentage of savings, the energy prices pE, and pNG are the most relevant variables. E is still more influential than H and C, but it becomes less influential compared with its analysis for the amount of savings. That is because, when measuring the amount of savings, there is a direct link between the money saved and the size of E. But when measuring percentage of savings, it considers the proportions, rather than the total amount. Nevertheless, an important remark is that in the percentage of savings, the influence of the three loads (E, H, and C) is slightly more equilibrated than in the amount of savings. On the other hand, pNG is again the only variable that has interaction effects with all the others, but some aspects draw attention. The index pNG – pE is notably bigger compared with its analogous in the amount of savings, suggesting that the Spark Spread rate (SS) could be relevant for the relative savings. However, that resolution becomes weak when noticing that the energy loads have interaction effects almost exclusively with pNG. Therefore, the relevance of E, H, and C is strongly linked only to the price of natural gas.
HYPOTHESIS 2
Concerning the interest of studying the energy prices separately, it can be said that both, pE and pNG, are relevant individually regardless of the output measure (amount or percentage of savings). Also, they are clearly tied, either directly or indirectly. However, the main difference between them is that, in either output (amount or percentage of savings), pNG keeps interaction effects with all the other variables, indicating that its influence is wider. Specifically talking about the percentage of savings, the energy loads interact almost exclusively with pNG. Moreover, although pE also has a strong interaction effects with pNG, it is shown that contrary to the general rule established by international governmental organisms, the spark spread threshold could be lower than three depending on the price of natural gas. Therefore,
it is recommendable to analyze separately the energy prices while assessing the feasibility of Trigeneration systems with Thermal Storage.
Beyond the technical results, the contribution of this thesis includes adapting an hourly time-step model of the CCHP-TS systems into a programming language that allows an agile sensitivity analysis. Additionally, the implementation of the three sensitivity analysis methods allowed identifying their advantages and limitations. Moreover, this complementarity thereby reinforced the techno-economic feasibility analysis of the Trigeneration systems with Thermal Storage.
1
1 INTRODUCTION
1.1 Context
Throughout the years, several authors have suggested that there is a relationship between the energy consumption and the economic growth of a region [3]–[8]. With regards to the environmental impact of the energy consumption, the IPCC report [9] indicates that half of the anthropogenic CO2emissions between 1750 and 2011 have occurred in the last 40 years. From those, 40% were kept in the atmosphere and 60% were removed and stored on land (plants and soils) and ocean, causing ocean acidification. The report also identified the energy sector as the largest contributor to the greenhouse gas emissions. Burning coal, natural gas, and oil for electricity and heat production represented 25% of the emissions in 2010, while fuel extraction, refining, processing, and transportation represented another 10%. Therefore, reducing energy demand is one of the most important mitigation strategies proposed by the IPCC report [9].
Given the dependency between energy consumption and economic growth and the impact of energy consumption in climate change, one of the major challenges faced by society today is how to promote the economic growth of developing regions like Africa, southeast Asia, middle east and Latin America without increasing the emissions of greenhouse gases. The only way to solve this challenge is by promoting the efficient use of energy demand and supply it using the most efficient generation technologies and renewable resources.
1.2 Combined thermal and power energy systems
Around the globe, society requires electrical and thermal energy to cover their needs in the building sector and industry (which together account from almost 60% of the total final energy consumption [10]). Typically, they are produced2
separately, but a combined thermal and power energy system can generate both using the same fuel.
There are several advantages in using combined thermal and power energy systems: 1) improving the energy efficiency and reducing emissions; 2) enabling the use of local renewable and residual thermal energy; 3) increasing the security of energy supply by decentralizing its production; 4) reducing the transmission and distribution losses because such decentralized systems are closer to the location of the demand; and 5) generating cost-savings for the energy consumer ([11], [12]). In general, combined heat and power generation technologies contribute to a low-carbon and resilient local energy system. The combined generation of heat and power may have different approaches. The following sections 1.2.1, 1.2.2, and 1.2.3 provide a more detailed insight.
Cogeneration
Combined Heating and Power (CHP), also known as cogeneration, is a process that generates simultaneously heat and electrical energy from a single fuel. The fuel could be either fossil or non-fossil.
According to the CODE2 [13], CHP can save up to 25% of the primary energy compared to the separate production of both outputs. The increase of this number depends on the carbon intensity of the electricity from the grid [14], and the efficiency of the CHP. The Fraunhofer Institute reports an overall CHP efficiency up to 93% [15].
In general, CHP can significantly reduce greenhouse gases emissions in residential, industry, and tertiary sectors, by lowering fuel demand and transmission losses [16]. The latter happens because it produces the energy closer to the consumer.
In 2012, the EU published the Energy Efficiency Directive (EED) 2012/27/EU that replaced the 2004/8/EC, to promote the use of CHP. Specifically, the EED talks about cogeneration in its Art. 14 and annexes I, II, VIII, IX, and X. The method to calculate the CHP efficiency is detailed in the Annexes I and II [17].
3
As part of the Directive 2012/27/EU, in 2015, all EU members assessed the potential for high-efficiency CHP and DHC, to promote the join generation of electricity and useful heat. In Portugal [18], [19], the transposition of the Directive 2004/8/EC was through the Decree-Law nº. 23/2010, and later, in 2015, the Decree-Law nº. 68-A/15 transposed the Directive 2012/27/EU. Portugal has mainly used CHP for industrial purposes. However, the Decree-Law nº. 68-A/15 [20] introduced changes to the regulation that made more difficult for the CHP owners to access to supports such as the remuneration according to a reference tariff and the bonus per efficiency. Potentially, this has had a negative impact in the CHP for Portugal.
Trigeneration
Combined Heating, Cooling and Power (CCHP), also known as trigeneration, is a system that includes CHP and additional technologies, such as heat pumps or absorption cooling systems, to produce cooling from the heat and electricity generated by the CHP. These systems can reach overall efficiencies as high as 90%, depending on the configuration [21].
Trigeneration with Thermal Storage
In CHP and CCHP systems, the production of electricity, heat, and cold are coupled, but this is not necessarily true for the consumption. A solution is to install Thermal Storage (TS) units that decouple the heat and cold supply from the electricity one [22]. Additionally, this helps to shave peaks of demand [23], and reduce operation cost, primary energy use and emissions [24], [25]. This type of system is then called Trigeneration – Thermal Storage (CCHP-TS) and it is a specific configuration of the Combined Thermal and Power Energy Systems.
There are already successful examples of application of this approach. In Denmark, it has been proven that using thermal storage within DHC networks, helps to manage intermittency from wind and solar PV, by optimizing the
4
operation of thermo-electric equipment like heat pumps, electric boilers and CHP [11].
Figure 3 illustrates an example of the configuration for a CCHP-TS system (right) and compares it with a conventional energy system, called reference design (left). The latter uses electricity from the grid to meet the annual electric and cooling loads (through a vapor-compression chiller) and uses a natural gas boiler to meet the annual heating loads.
The CCHP-TS system uses grid and boiler just as auxiliary units. The main supply of energy comes from the CHP unit, that produces electricity and heat. Both energy vectors can be used directly to cover their loads, or they can be used to produce cold (through an electrical and/or absorption chiller respectively). The cold, like the heat, can be directly used to cover cooling and heating demand, or they can be stored using sensible thermal storage systems (hot-water tanks or cold-water tanks).
Figure 3 Comparison of a trigeneration-thermal storage system vs. a conventional system, while meeting the annual loads Ln Ɐ n={E: electricity,
H:heating, C:cooling}
NOTE: Energy Supply (dotted lines) and Energy Loads (solid lines)
LE Boiler Vapor-compression Chiller Grid Reference design LH LC CHP Absorption chiller Cooling storage Heat storage LE Boiler (Aux) Vapor-compression Chiller (Aux) Grid (Aux)
Trigeneration sys. with Thermal storage (CCHP-TS)
LH LC
5
1.3 Market framework
Size of the thermal sectorOnly in Europe, the heating and cooling represent about 50% of the final energy consumption. From that, 84% is still generated from fossil fuels and only 16% from renewable energy [11].
The heat demand in the EU28 in 2010 reached approximately 4,306 PWh (Peta-Watt hour) [26]. From that, only 12% was covered with district heating, other 12% with electricity, and 66% with natural gas, oil, and coal products. According to Persson [26], the demand of heat depends on factors such as: the climate, the levels of building insulation, the energy services available and desired, as well as the level of comfort.
Figure 4 Estimated European heat market in 2010 including residential and service sector (Adapted from Persson, 2015 [26])
It is worth mentioning that the largest heat demand in the European markets are located in Germany, France, the United Kingdom, Italy, Poland, Spain, and the Netherlands (Figure 4). The reason is that, according to the JRC [27], the heat demand of those countries is representative in the three main sectors (industrial, residential, and services).
0 100 200 300 400 500 600 700 800 900 1000 M a lt a C y p ru s L u x e m b o u rg Es to n ia Sl o v e n ia L a tv ia L it h u a n ia C ro a ti a Bu lg a ri a Po rt u g a l Ire la n d Sl o v a k R e p u b li c G re e c e D e n m a rk H u n g a ry F in la n d Au s tri a C z e c h R e p u b lic R o m a n ia Be lg iu m Sw e d e n N e th e rl a n d s Sp a in Po la n d It a ly U n it e d Ki n g d o m F ra n c e G e rm a n y H e a t e n e rg y d e m a n d [ P W h ]
6
Regarding the cooling demand, Figure 5 presents an estimate for selected countries in 2000 and 2017 across the world. The increase of the total cooling demand (top of Figure 5) shows that the market is growing around the world. Also, it is evident that Asia is taking relevance, especially with the market growth in China and India. The demand per capita (bottom of Figure 5) shows that countries such as the US consume significantly more than others [28]. Therefore, if other countries follow the same trend, the cooling demand could grow exponentially.
Figure 5 Cooling demand total (top) and per capita (bottom) for selected countries in 2000 and 2017 (image adapted from [28])
0 100 200 300 400 500 600 700 Rest of the world
Brazil Korea India Japan European
Union China United States C o o li n g d e m a n d [ T W h ] 2000 2017 0 500 1000 1500 2000 Rest of the world
Brazil Korea India Japan European
Union China United States C o o li n g d e m a n d [k W h /c a p it a ] 2000 2017
7 Current status of CHP market
As mentioned at the beginning of the section 1.2, a combined thermal and power energy system produces electricity and thermal energy from the same fuel. That increases its efficiency dramatically. Typically, the total efficiency of a CHP system is between 77% and 83% [29], however, in some systems, it can reach up to 90% [30].
Worldwide, CHP accounts for 10% of the electricity production [12]. But most of the contribution comes from countries with focused governmental policies. Figure 6 shows the CHP electricity generation and its share for the European countries in 2017. The blue line indicates the European average CHP share in the gross electricity production. It was 11.3% in 2017 [31]. Countries such as Denmark, Latvia, and the Netherlands have the largest share of CHP electricity production. Whilst Germany and Italy are leading the absolute electricity generation.
Figure 6 CHP electricity generation [TWh] and CHP share in the gross electricity generation for European countries in 2017 [31]
8
On the other hand, in recent years, the Asia-Pacific region has fostered CHP systems installation in new industrial facilities. China and India were leading this path in 2012 with 13% and 5% of their electricity production respectively [32], [33]. In 2017, CHP was already accounting for 20% of the total electricity production in China [34].
Relevant sectors for combined thermal and power energy systems Combined thermal and power energy systems can be used mainly in three different sectors: industry, services, and households, in the form of district heating and cooling (DHC) [30].
Industry
For the OECD countries, the industry represents 25% of the total final energy consumption, only behind the transport (37%).
The industry is the application par excellence of the CHP technology, as it usually requires high temperature thermal energy. Until 2007, this represented 80% of the installed capacity of CHP worldwide [30]. In the European context, 55% of the industry in 2009 had high temperature energy requirements (Figure 7).
Figure 7 Share of type of useful thermal energy (by temperature) for the industry of EU27 in 2009 [27] High temp 55% Med temp 19% Low temp 26%
T OTAL USEFUL HEAT DEMAND FOR T HE INDUSTRY (EU-27 IN 2009)
9
The typical industrial sectors using CHP are metallurgy, mining, chemical, petrochemical, food processing, pulp & paper, etc. The common characteristic among all is their high needs of thermal energy, usually in high temperatures. Figure 8 shows the European industrial sectors that required thermal energy in 2009. The most representative ones for high temperature are Iron & steel, and non-metallic minerals. For low temperature, it is the chemical sector. Figure 9 illustrates that the Germany, Italy, Spain, and France concentrate the highest thermal demand due to these sectors, therefore, they are the largest industrial markets for CHP.
Figure 8 Industrial sectors that require thermal energy in Peta-Joules [PJ] (by temperature) for EU27 in 2009 [27]
0 200 400 600 800 1000 1200 Ir o n & S te e l N o n -f e rr o u s m e ta l C h e m ica l N o n -m e ta lli c m in e ra l p ro d u ct s O re e xt ra ct io n ( e xce p t fu e ls) F o o d , d ri n k a n d t o b a cco T e xt ile , le a th e r & cl o th in g P a p e r & p ri n ti n g T ra n sp o rt E q u ip m e n t M a ch in e ry O th e r in d u st ri e s
U
s
e
fu
l
h
e
a
t
d
e
m
a
n
d
[
P
J
]
10
Figure 9 Useful heat demand for Iron & steel, and non-metallic minerals (high temperature) and chemical (for low temperature). EU27 in 2009 [27]
Services
For the OECD countries, the sector of services represents more than 70% of their GDP and 13% of their total final energy consumption. A significant share of this energy consumption, around 50%, is for heating and cooling, in order to provide thermal comfort for the building users (offices, schools, hospitals, shopping centers, etc.) Figure 10 shows that Germany, France, UK, and Italy concentrate the highest thermal demand in the service sector. CHP is used in this sector through the connection of the buildings to district heating (and cooling) networks or with the direct installation of CHP units in the facilities, like in the case of hospitals.
0 50 100 150 200 250 300 Cyprus Estonia Ireland Lithuania Malta Denmark Portugal Slovenia Greece Latvia Bulgaria Luxembourg Hungary Finland Sweden Belgium Romania Slovak Republic Poland Austria Netherlands Czech Republic Spain Italy United Kingdom France Germany
Useful heat demand [PJ]
Iron & Steel : High temp EU27 in 2009 0 50 100 150 200 Malta Latvia Luxembourg Estonia Lithuania Slovenia Cyprus Finland Ireland Sweden Slovak Republic Hungary Romania Denmark Bulgaria Netherlands Austria Czech Republic Greece Belgium Portugal United Kingdom Poland France Germany Spain Italy
Useful heat demand [PJ]
Non-metallic mineral products : High temp EU27 in 2009 0 20 40 60 80 100 Cyprus Luxembourg Malta Latvia Estonia Denmark Greece Ireland Slovenia Sweden Slovak Republic Austria Lithuania Portugal Hungary Bulgaria Czech Republic Finland Romania Spain France Belgium United Kingdom Poland Netherlands Italy Germany
Useful heat demand [PJ]
Chemical : Low temp EU27 in 2009
11
Figure 10 Breakdown of useful energy demand for the service sector in EU-27 for 2009
Households
For the OECD countries, the sector of households represents 21% of their total final energy consumption. And within the households, space heating consumes the most (Figure 11), in general with at least 50% of the share.
Figure 11 Household energy use (by end use) around the world [27]
0 20 40 60 80 100 120 140 M a lt a C y p ru s L u x e m b o u rg Sl o v e n ia Po rt u g a l Es to n ia L it h u a n ia L a tv ia Bu lg a ri a Sl o v a k R e p u b li c Ire la n d G re e c e D e n m a rk F in la n d H u n g a ry Au s tri a C z e c h R e p u b lic Sw e d e n R o m a n ia Sp a in Be lg iu m N e th e rl a n d s Po la n d It a ly U n it e d Ki n g d o m F ra n c e G e rm a n y U s e fu l e n e rg y d e m a n d [ P W h ]
Space heating Water heating Space cooling
0 1 2 3 4 5 1990 1995 2000 2005 Ene rgy us e [E W h] Space heating Appliances Water heating Lighting Cooking
12
As for the delivery of heating, hot water and cooling services to households, it is usually done through District Heating and Cooling (DHC) networks. These networks deliver hot water or cold water through a network of insulated pipes, from a central point of generation to the end user [35]. The generation can be done through a combined thermal and power energy system.
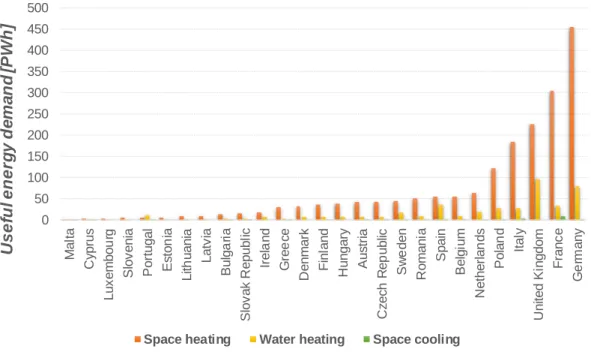
In Europe, the countries that have the largest energy demand for households are Germany, France, United Kingdom, Italy, and Poland (Figure 12).
Figure 12 Useful energy demand for the residential sector in EU-27 for 2009
Key success factors for combined thermal and power energy
systems
Figure 6 exhibits the countries that currently present a large penetration of CHP in the power generation. However, there are multiple factors influencing it. As stated by Persson [26], the climate, architectural characteristics, and cultural context are important because they determine the level of demand. However, Galindo Fernández [11] presented a list of key factors determining the success of the technology. They include governmental interest to reduce CO2 emissions,
a liberalized thermal energy market with low regulation, predictability of prices
0 50 100 150 200 250 300 350 400 450 500 M a lt a C y p ru s L u x e m b o u rg Sl o v e n ia Po rt u g a l Es to n ia L it h u a n ia L a tv ia Bu lg a ri a Sl o v a k R e p u b li c Ire la n d G re e c e D e n m a rk F in la n d H u n g a ry Au s tri a C z e c h R e p u b lic Sw e d e n R o m a n ia Sp a in Be lg iu m N e th e rl a n d s Po la n d It a ly U n it e d Ki n g d o m F ra n c e G e rm a n y U s e fu l e n e rg y d e m a n d [ P W h ]
13
and urban planning, and tax incentives. This statement is backed-up by multiple governmental reports ([12], [30]) that highlight case studies with different policies in place: building regulations and interconnection standards, feed-in-tariffs, green certificates, emission trading, and installed capacity grants. Galindo Fernández also identified some factors in terms of the market characteristics: competitive prices, local energy resources, possibility of economies of scale, and operation flexibility.
Perspective for thermal storage
There are three types of thermal energy storage technologies: sensible, latent and thermochemical. The first includes tank, pit, borehole, and aquifer. The second refers to phase change materials, and the third uses reversible chemical reactions.
According to the Department for Business Energy & Industrial Strategy in the UK [36], the cheapest are the pits and boreholes with a cost of 0.3-0.8 £/kWh. While the thermochemical storage can go up to 400 £/kWh. The report highlights that for any thermal storage technology, the cost decreases with the economies of scale, in other word, the size of the installation. Regarding the operation and maintenance cost, they are almost negligible.
The technology with the largest penetration is the water tank (sensible thermal storage). Although its price is not the lowest (25-180 £/kWh). It has an efficiency of 50-90% and the sector that mainly use it is the residential. However, it is also found on district heating and some commercial applications. They are generally coupled with solar thermal power systems (solar receivers), heat pumps, CHP, biomass, district heating, and solar PV (to transform the surplus of electricity into thermal energy). This technology foresees low chances of cost reduction. Mainly because the technology is already mature. In contrast, phase change materials and reversible chemical reactions have large probability to reduce their cost, but the forecast is uncertain.
![Figure 4 Estimated European heat market in 2010 including residential and service sector (Adapted from Persson, 2015 [26])](https://thumb-eu.123doks.com/thumbv2/123doknet/14723173.751582/42.892.140.752.514.878/figure-estimated-european-including-residential-service-adapted-persson.webp)


![Figure 20 VARS is based on pairs of points at the response surface. Adapted from Razavi, 2016 [161]](https://thumb-eu.123doks.com/thumbv2/123doknet/14723173.751582/101.892.238.644.523.834/figure-vars-based-points-response-surface-adapted-razavi.webp)