HAL Id: tel-03200903
https://tel.archives-ouvertes.fr/tel-03200903
Submitted on 16 Apr 2021HAL is a multi-disciplinary open access archive for the deposit and dissemination of sci-entific research documents, whether they are pub-lished or not. The documents may come from teaching and research institutions in France or abroad, or from public or private research centers.
L’archive ouverte pluridisciplinaire HAL, est destinée au dépôt et à la diffusion de documents scientifiques de niveau recherche, publiés ou non, émanant des établissements d’enseignement et de recherche français ou étrangers, des laboratoires publics ou privés.
Aide à la décision multicritère pour l’optimisation de
scénarios de production énergétique via l’utilisation de
données spatiales
Nadeem Alkurdi
To cite this version:
Nadeem Alkurdi. Aide à la décision multicritère pour l’optimisation de scénarios de production énergé-tique via l’utilisation de données spatiales. Physique [physics]. Université de Guyane, 2020. Français. �NNT : 2020YANE0006�. �tel-03200903�
UNIVERSITÉ DE GUYANE
Ecole Doctorale 587
« Diversités, santé et développement en Amazonie »
DFR « Sciences et Technologies »
Thèse
pour obtenir le grade de docteur de l’Université de Guyane
Présentée par
Discipline : Sciences pour l’ingénieur
Spécialité : Génie électrique, électronique des puissance
NADEEM ALKURDI
Aide à la décision multicritère pour l’optimisation de scénarios de production
énergétique via l’utilisation de données spatiales
Sous la direction de Carmen Gervet et Laurent Linguet
Soutenue le 2 Octobre 2020 à Montpellier devant le jury composé de :
POGGI Philippe Rapporteur Professeur des universités, Université des Corse
SANDOU Guillaume Rapporteur Professeur des universités, Ecole d’ingénieur Centrale Supelec OMRANE Abedennebi Examinateur Professeur des universités, Université des Guyane
GERVET Carmen Directrice de thèse Professeur des universités, Université de Montpellier LINGUET Laurent Directeur de thèse Professeur des universités, Universite des Guyane
Remerciements
I would like to express my deep gratitude to my supervisors Prof.Carmen Gervet and Prof.Laurent Linguet for their continuous supports, comments, guidance, patience and help during this thesis period.It was my honour to work with them in this interesting project under their supervision.
Thanks again to Prof.Gervet for being besides me during these three years of my PhD thesis in Montpellier where my workplace is it. Her intensive comments, discussions, encouragement and feedback were really useful, and highly appreciated for the success of this work.
I would like also to thank deeply Dr.Benjamin Pillot who was working and supporting me during this thesis period as one team-work with our supervisors. His strong interests and contribution in this project and his discussions with me, urges and motivated me to achieve a better work.
Thanks to Prof.Isabelle Mougenot for her valuable comments, discussions and her encouragement that urges me to achieve more progress in this thesis as being a committee member at the annual evaluation committee.
This thesis would not have been possible without the support, guidance and help of this motivated team(Prof.Carmen, Prof.Laurent, Dr.Benjamin).
I would also like to thank all administrative employees(Mme Sylvie, Mme Agnes and Mme Veronique) at UMR ESPACE DEV, IRD in Montpellier and also, thanks to the administrative em-ployees(Mme Rachelle et Mme Gleide) at the University of French Guiana, they were all supporting me, managing my administrative papers and provided me with everything I could need for my thesis work.
I am thankful to all my colleagues and employees that are working in different projects at house of remote sensing in Montpellier, France and it was my pleasure to meet international interns , doctoral and post-doctoral students of different backgrounds.
I would like to acknowledge the financial, academic and technical support of the University of French Guiana(UG), CNES GUYANE, CTG, UMR ESPACE DEV and IRD and also, thankful to Ecole Doctorale that give me such great opportunity to study this Phd thesis within their support and access to different training courses, workshops, online sessions and others.
Special thanks to my lovely wife HANIN for her strong support during this thesis period.
My thanks and appreciations also go to my family who have willingly supported and motivated me to satisfy my goals.
Résumé
Actuellement, les pénuries d’électricité est un problème mondial majeur à cause de l’augmenta-tion de la demande d’électricité, c’est pourquoi la mise en œuvre des énergies renouvelables est une solution alternative importante pour répondre à nos besoins en électricité, en réduisant les émissions de gaz à effet de serre (GHG) pour lutter contre le changement climatique et d’atténuer la dépendance à l’égard des ressources en combustibles fossiles. Ainsi, la planification de la transition vers les énergies renouvelables est une stratégie permanente essentielle pour répondre à nos besoins de demande, que le réseau électrique soit connecté au réseau nationale ou hors dans les zones rurales. La plupart des pays sont déjà commencé à renforcer leurs infrastructures énergétiques pour les alimenter à partir de ressources énergétiques renouvelables durables, mais les ressources potentielles limitées pourraient arrêter ce déploiement.
Aujourd’hui, l’intégration de différentes ressources d’énergie renouvelable au réseau électrique est un enjeu majeur pour assurer la stabilité du réseau. Ensuite, la mise en œuvre de systèmes d’énergie renouvelable à haut rendement nécessite un soutien important à la prise de décision pour encourager les différentes parties à plus d’investissement. En effet, la planification des énergies re-nouvelables doit être évaluée à partir des critères technico-économiques et socio-environnementaux. Ainsi, la planification énergétique ne peut se faire sans dépendre des modèles énergétiques. Les modèles de systèmes d’énergie renouvelable sont considérés comme une solution importante pour résoudre de nombreux problèmes complexes de planification énergétique dans le monde à différentes périodes où l’intermittence de certaines ressources (PV, éolien ...) pourrait être remplacée par d’autres ressources continues (biomasse, Hydro ...) pour répondre à la demande d’énergie et assurer la stabilité du réseau. Une grande variété de modèles énergétiques sont utilisée pour satisfaire différents objectifs énergétiques, en particulier l’électricité. De plus, ces modèles énergétiques pourraient suivre soit l’approche déterministe utilisant des modèles robustes pour gérer l’incertitude des données, soit l’approche stochastique qui utilise des probabilités dans l’incertitude. Les deux ap-proches sont été largement utilisées et recommandées pour la planification des énergies renouvelables. L’objectif principal de cette thèse est de développer un modèle d’aide à la décision multicritères pour la planification de la transition des énergies renouvelables combinant différentes ressources d’énergie renouvelable assurant une production maximale à des coûts minimes. Cette thèse surligner le concept principal de la transition 100 % énergies renouvelables d’ici fin 2030 en Guyane car il s’agit d’un territoire d’outre-mer où il y a un enjeu dans l’élaboration du scénario énergétique d’ici 2030 et les installations de production d’énergie actuelles ne peuvent pas se nourrir l’augmentation de la demande d’électricité avec des ressources limitées mais aussi, d’autres installations d’énergies renouvelables sont nécessaires pour remplacer les centrales à combustibles fossiles d’ici la fin de 2030. En résumé, cette thèse répondra à la question de recherche suivante : Quels sont les modèles de matrice énergétique (solaire PV et biomasse dans notre cas) qui pourraient être définis comme un plan de base initial pour les secteurs de l’énergie n’importe quelle région ou dans un autre concept, comment optimiser différents scénarios de production d’énergie combinant différentes ressources d’énergie renouvelable de production maximale au coûts minimaux pour satisfaire les besoins énergétiques en tenant compte des dimensions spatio-temporelles du problème et des données ?
Dans la première partie de cette thèse, nous avons développé un framework intégré (GIS-Robust Optimization) comme un excellent outil d’aide à la décision pour déterminer les meilleurs sites optimaux de centrales solaires photovoltaïques et leur utilisation optimisée des surfaces à l’échelle de l’utilité en Guyane, mélanger à des données hétérogènes de géographie (contraintes spatiales),
de coûts associés et de contraintes temporelles. Ce framework est une approche informatique efficace gérant à grande échelle des données spatio-temporelles. De plus, une version mise à jour de la première approche (modèle de parc) appelée modèle d’anneau approche est développée pour fournir de meilleures solutions optimales d’un anneau PV composé de plusieurs centrales solaires photovoltaïques de production maximale et de coûts minimaux ainsi que moins risqués pour le réseau électrique en cas de déconnexion urgente ou de blocage de grands parcs en raison d’incidents qui n’affectent pas l’ensemble de la production d’électricité par rapport à l’approche du parc.
Dans la deuxième partie, cette thèse se axée sur l’application de notre framework développé (GIS-RO) pour la biomasse qui est une ressource continue d’énergie renouvelable en complément de nos études précédentes sur la ressource solaire intermittente. Ce framework sélectionnera également les sites potentiels de biomasse optimaux qui assurent une production maximale et des coûts minimaux soumis à différentes contraintes. En outre, d’autres travaux futurs et améliorations de notre modèle développé pour chaque ressource de planification des énergies renouvelables sont également discutés et traités dans cette partie.
Enfin, notre méthodologie développée est un excellent outil d’aide à la décision pour sélectionner les meilleurs emplacements potentiels de centrales d’énergie renouvelable à mettre en œuvre. Les résultats sont été confirmés pour les ressources énergétiques renouvelables intermittentes (solaire) et non intermittentes (biomasse) intégrées au réseau électrique.
Mots clés :
Planification des énergies renouvelables, échelle spatio-temporelle, SIG, optimisation robuste, sélec-tion de site, Guyane Française
Abstract
Currently, lack of electricity is a major global issue around the world due to the increase in power demand, that’s why implementation of renewable energy is an important alternative solution to feed our electricity needs, reducing Green House Gases (GHG) emissions to fight climate change and to mitigate the dependency on fossil fuels resources. So, renewable energy transition planning is an essential ongoing strategy to feed our demand needs whether the network is grid-connected or off-grid in rural areas. Most countries have already begun to reinforce its energy infrastructure to be fed from sustainable renewable energy resources but the limited potential resources could halt such deployment.
Today, integration of different renewable energy resources to the power network is a major challenge to secure the stability of the grid. Then, implementation of high efficient renewable energy systems requires strong decision making support to encourage different parties for further investment. Indeed, renewable energy planning should be evaluated from the techno-economic-socio-environmental criteria. Thus, energy planning cannot be done without depending on energy models. So, renewable energy system models are considered an important solution to solve many complex energy planning problems around the world at different periods of time where the intermittence of some resources(PV, Wind...) could be substituted by other continuous resources(Biomass, Hydro...) to meet the power demand and ensure the grid’s stability. Large variety of energy models are used to satisfy different energy targets especially electricity. Moreover, these energy models could follow either the deterministic approach using robust models to handle the uncertainty in data or stochastic approach that use probabilities within uncertainty. Both approaches have been widely used and recommended for renewable energy planning.
The main objective of this thesis is to develop a multi-criteria decision support model for renewable energy transition planning combining different renewable energy resources ensuring maximum production at minimal costs. This thesis highlights the main concept of 100 % renewable energy transition by the end of 2030 in French Guiana as it is an overseas French territory where there is a challenge in the development of the energetic scenario by 2030 and the current energy production facilities cannot feed the increase in power demand within limited resources but also, other energy facilities from renewable energies resources are required to replace the fossil fuels plants by the end of 2030. As a summary, this thesis will answer the following research question : What or which are the energy matrix models (Solar PV and Biomass in our case) that could be set as an initial basic plan for the energy sectors in any region or in other concept, how to optimize different energy production scenarios combining different renewable energy resources of maximum production at minimal costs in order to satisfy the energy needs taking into account the spatio-temporal dimensions of the problem and data ?
In the first part of this thesis, we’ve developed an integrated (GIS-Robust Optimization) frame-work as an excellent decision support tool to determine the best optimal sites of PV solar plants and their optimized land use at utility scale in French Guiana mixing the following heterogeneous data of geographic(spatial constraints), related costs and temporal constraints. This framework is an efficient computational approach handling large scale of spatio-temporal data. Moreover, an updated version of the first approach (park model) called ring approach model is developed to provide better optimal solutions of a PV ring composing of multiple solar PV plants of maximum production and minimal costs as well as less risky to the power network in case of urgent disconnection or blocking of large parks due to incidents which does not impact the whole power production as compared to
park approach.
In the second part, this thesis is focused on the application of our developed framework(GIS-RO) for biomass which is dispatchable resource of renewable energy as a complement to our previous studies regarding intermittent solar resource. This framework will also select the optimal biomass potential sites that ensures maximum production and minimum costs which are subjected to different constraints. Also, further future works and improvements of our developed framework for each renewable energy planning resources are also discussed and handled in this part.
Finally, our developed methodology is an excellent decision support tool to select the best poten-tial locations of renewable energy plants in order to be implemented. Results have been confirmed for both intermittent (Solar ) and non-intermittent(biomass) renewable energy resources integrated to the power network.
Keywords :
Renewable energy planning, spatio-temporal scale, GIS, robust optimization, site selection, French Guiana
Table des matières
1 Chapter 1 : General Introduction 1
1.1 State of Art . . . 2
1.1.1 Barriers of renewable energy integration and needs of energy planning scenarios 2 1.1.2 Multi-criteria Decision Making and Energy Planning . . . 5
1.1.3 GIS studies with MCDM . . . 6
1.1.4 Holistic Bottom-up energy approach . . . 7
1.2 French Guiana . . . 10
1.2.1 Location and Climate . . . 10
1.2.2 Structure of electric power system . . . 10
1.2.3 Electricity power production and consumption . . . 10
1.2.4 Renewable energy resources in French Guiana . . . 11
1.3 Objective of the thesis . . . 12
1.4 Methodology and plan . . . 13
2 Chapter 2 : Robust scenarios of spatio-temporal renewable energy planning 14 2.1 Abstract . . . 16
2.2 Introduction and related work . . . 16
2.3 Problem description, application and approach . . . 17
2.4 GIS module : GREECE . . . 19
2.4.1 Spatial placement and partitioning of polygons . . . 20
2.4.2 Contextual data and resource time series de-spatialization . . . 22
2.5 Optimization module - fractional knapsack approach . . . 23
2.6 Experimental study and evaluation . . . 25
2.7 Conclusion . . . 27
3 Chapter 3 : Solar PV plant planning scenarios at utility scale 29 3.1 Abstract . . . 32
3.2 Introduction and related work . . . 32
3.3 General problem and proposed approach . . . 37
3.4 PV sites extraction and spatial data discretization problem : The GREECE model . . 38
3.4.1 Geographical data layers . . . 39
3.4.2 Control parameters . . . 40
3.4.3 Generating the set PS of suitable polygons . . . 40
3.4.4 Output . . . 42
3.5 Optimal planning and sizing of PV parks (OPSPV) . . . 42
3.5.1 Problem specification . . . 42
3.5.2 Problem modeling . . . 43
3.6 Case study : Optimizing PV parks implantation and production in French Guiana . . 46
3.6.1 Data acquisition and processing . . . 46
3.7 Results and analysis . . . 52
3.7.1 Fractional knapsack optimization . . . 53
3.7.2 Impact of the 35 % constraint . . . 53
3.7.3 Spatiotemporal solar GHI patterns and corresponding Pareto solutions . . . . 54
3.7.4 Towards helping decision making and network managing . . . 56
3.8 Conclusion . . . 58
4 Chapter 4 : Ring approach model for Solar PV plant planning 59 4.1 Abstract . . . 62
4.2 Introduction . . . 62
4.3 The GREECE-OPSPV framework . . . 63
4.4 Applying the SONET analogy to RE sources in power systems . . . 64
4.5 Case Study . . . 66
4.5.1 Ring approach model . . . 66
4.5.2 Costs Function . . . 68
4.6 Comparison and results between both approaches . . . 69
4.6.1 Park Approach . . . 69
4.6.2 Ring Approach . . . 69
4.7 Conclusion . . . 73
4.8 Annex . . . 75
5 Chapter 5 : A systemic decision support approach for biomass energy 81 5.1 Abstract . . . 85
5.2 Introduction . . . 85
5.3 Literature Review . . . 86
5.4 Our approach . . . 88
5.4.1 GREECE biomass model . . . 88
5.4.2 Biomass optimization problem model . . . 88
5.4.3 Case Study : French Guiana . . . 96
5.5 Results and discussion . . . 98
5.5.1 With Constraint Rmb= Rm−1,b. . . 99
5.5.2 Without Constraint Rmb=Rm−1,b . . . 100
5.5.3 Technical and Investment risk . . . 100
5.5.4 Impact of technical risk(With/Without Rmb=Rm−1,b) on the total monthly po-wer demand satisfaction . . . 102
5.5.5 Comparison of biomass emissions versus other existing power facilities . . . 102
5.6 Conclusion . . . 103 6 Chapter 6 : General Discussion and Further Approach 105
Table des figures
2.1 GIS-RO integrated workflow . . . 18
2.2 GREECE problem specification . . . 19
2.3 Pruning restricted areas and threshold layers . . . 21
2.4 OPSPV problem specification . . . 24
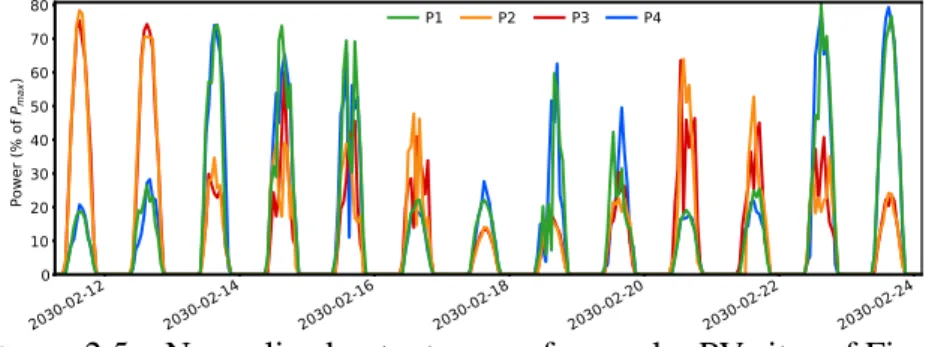
2.5 Normalized output power from solar PV sites of Fig. 2.7 . . . 27
2.6 Pareto charts for both scenarios with respect to (a) generated energy and (b) PV pe-netration. . . 27
2.7 Robustness of the worst-case scenario solution with decreasing resource . . . 28
3.1 Schematic view of the proposed integrated GIS-optimization framework. . . 39
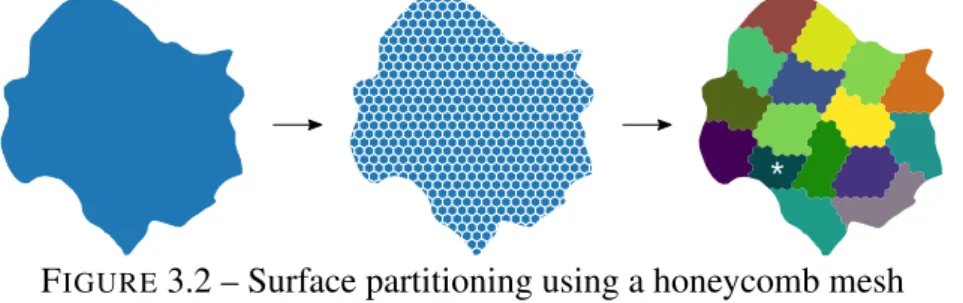
3.2 Surface partitioning using a honeycomb mesh . . . 41
3.3 OPSPV problem specification . . . 44
3.4 Map of French Guiana with corresponding geographical features (constraint layers, networks, etc.). . . 46
3.5 Set of land parcels generated by the GREECE model for French Guiana when consi-dering the permissive scenario. . . 49
3.6 Example of monthly solar potential cluster zones (February) derived from solar GHI raster maps elaborated by Albarelo et al. (ALBARELO et al., 2015) and Fillol et al. (FILLOL et al., 2017), and corresponding generated temporal patterns for candidate PV sites based on the permissive scenario (see section 3.6.1). . . 50
3.7 2030 forecast power demand over daily hours. . . 52
3.8 Worst case scenario Pareto solutions based on fractional (red) and full land use me-thod (blue). . . 53
3.9 Effect of the 35 % constraint on final PV power generation . . . 54
3.10 Evolution of PV site geographical location with Pareto cost. . . 55
3.11 Best vs. worst case scenario. . . 57
3.12 Robustness of the worst-case scenario solution when resource is permeated with dif-ferent uncertainty levels. . . 57
3.13 Output power from solar PV plants of Fig. 3.12 . . . 58
4.1 GREECE-OPSPV integrated model framework. . . 64
4.2 Analogy between SONET typical architecture (PELLEAUet al., 2009) and power net-work. . . 65
4.3 Pareto solutions for park approach scenario within uncertainty . . . 70
4.4 Pareto solutions for ring approach scenario within uncertainty . . . 70
4.5 Without limitation of substation size for ring and park approach . . . 72
4.6 Limitation of substation size for ring and park approach . . . 73
4.7 Park Approach with/without limiting the substation size of park approach . . . 74
4.8 Ring Approach C20 . . . 74
4.9 Park Approach C20 . . . 74
4.11 Park Approach C60 . . . 74
4.12 Solution of 3 PV parks forming one ring at cost level C20 corresponds to FIGURE4.8 76 4.13 Solution of 2 PV parks forming one ring at cost level C50 and C60 correspond to FIGURE 4.10 . . . 76
4.14 Solution of 4 PV parks forming 2 rings at cost level C70 . . . 77
4.15 Solution of 6 PV parks forming 3 rings at cost level C80 . . . 77
4.16 Solution of one PV park at cost level C10 using park approach . . . 78
4.17 Solution of one PV park at cost level C20 using park approach corresponds to FI -GURE4.9 . . . 78
4.18 Solution of 2 PV parks at cost level C50 using park approach . . . 79
4.19 Solution of two PV parks at cost level C60 using park approach corresponds to FI -GURE4.11 . . . 79
4.20 Solution of 3 PV parks at cost level C80 using park approach . . . 80
5.1 Biomass Optimization Problem . . . 90
5.2 Monthly biomass resources restricted for energy use in French Guiana . . . 97
5.3 Location of future biomass resources in French Guiana . . . 98
5.4 Location of new implemented Biomass Plant A at cost level C20 . . . 101
5.5 Monthly power production over the whole year for Biomass Plant A and its % of energy contribution with respect to needed monthly power demand . . . 101
5.6 Location of Biomass Plant A’ at cost level C20 . . . 102
5.7 Monthly power production from Biomass A’ and its contribution w.r.t monthly remai-ning demand without constraint Rmb= Rm−1,b . . . 102
5.8 With Constraint Rmb= Rm−1,b . . . 103
5.9 Without Constraint Rmb= Rm−1,b. . . 103
Liste des tableaux
2.1 Land management scenario used in this study for restricted areas. . . 26
3.1 Example of feature attributes per polygon generated by GREECE. . . 42
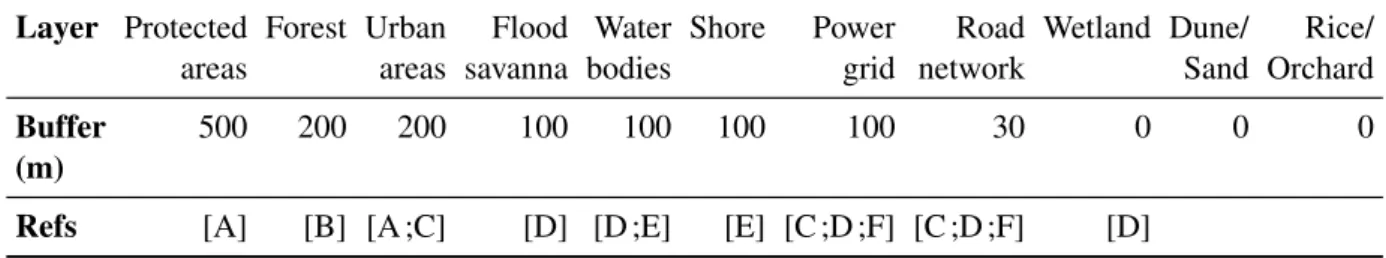
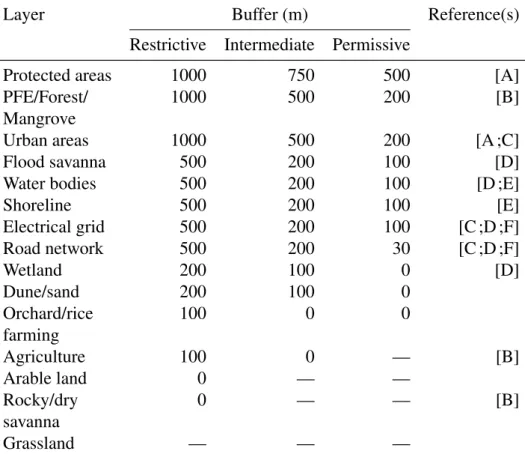
3.2 Restricted areas used in this study according to land management scenarios. . . 47
3.3 Distance threshold. . . 47
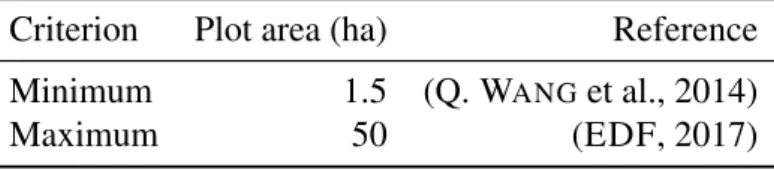
3.4 Min/max surface area of resulting land parcels. . . 48
3.5 Characteristics of one PV unit used in energy simulation. . . 51
3.6 PV plant fixed unit costs. . . 51
3.7 PV plant capital and annual operation cost piece-wise parameters. . . 52
3.8 Effect of the 35 % constraint on final PV generation . . . 54
3.9 Characteristics of the PV parks depicted in Fig. 3.10. . . 56
4.1 PV plant capital and annual operation cost piece-wise parameters. . . 68
4.2 Characteristics of the PV parks . . . 69
4.3 Characteristics of the PV Rings. . . 71
4.4 Ring Approach Limitation : note that one ring is separated from another ring by sym-bol(+) in the column of Set of Installed capacities(MW) . . . 75
4.5 Park Approach Limitation . . . 75
5.1 Capital and annual operation cost piece-wise parameters of biomass power plant . . . 98
5.2 Input parameters for biomass optimization model . . . 99
5.3 The total optimized amount coefficient % with respect to the chosen feeding resource 100 5.4 Total Number of trucks in service each month . . . 100 5.5 Effect of the constraint(Rmb= Rm−1,b) on total remaining monthly power demand (Sm) 102
Liste des abréviations
n Number of candidate sites derived from GREECE m Final number of solar PV plants
h hour of the year
i Site index
Einth Current hourly production from intermittent sources (kWh) E ph Current hourly production from non-intermittent sources (kWh) Ppvh,i Estimated hourly production per PV unit for each site (kWh/m2) Dgi Minimum distance from the grid to the centroid of a candidate (m) Clan Transmission line unit cost (e/m)
Csta Substation power unit cost (e/kW) Demh Estimated hourly power demand (kWh) Smaxi Maximum area for each candidate site (m2)
Smin Minimum area for each candidate site (m2
Ccapi Capital cost for implementation of a new PV power plant (e)
Copi Annual fixed operational cost per new PV plant (e)
Cconi Connection cost for each new PV plant, transmission lines and substa-tion (e)
PS Set of potential candidate sites P Set of selected candidate sites
SAi Surface to consider for a candidate site PSithat is selected (m2)
Bi Boolean variable equal to 1 if site PSiis selected, 0 otherwise
Ccapk Capital cost for implementation of a new PV ring (k) composing PV plants (e)
Cconi Connection cost for each new PV ring of index k (e) Copk Annual fixed operational cost per new PV ring(e) Cstak Capital cost for new substation for each ring k(e) Demh Estimated hourly power demand(KWh)
SAik Optimized fractional area of new selected PV park belonging to ring of index k (m2)
Xik Boolean variable indicates if the new PV plant i belonging to ring k is implemented or not
D Minimum distance threshold parameter between two or more PV parks whether could form one ring or not(m)
pivk Boolean variable ensures that two different new PV parks could form one ring but not necessary implemented
Pnom Nominal power of one PV unit in the energy simulation(KW/m2) Yk Decision Boolean variable corresponds to the formation of one ring of
index k composing of new PV parks
Ppvh,i Estimated hourly power production per PV unit for each site( KWh/m2)
Cp Maximum allowed substation capacity(KW)
Ik Set of boundaries where PV sites belong to each boundary could form at least one ring of index k
N Total number of PV potential sites
M Big number
C f u The unit cost to buy one liter of diesel fuel consumed by the trucks ( e/Liter)
dRrb Total average minimal fuel consumption along the nearest minimal road during the travelling time from each biomass resource to each biomass power plant (Liters)
dNRrb Total average minimal fuel consumption along the nearest minimal road during the travelling time of returning back from each biomass power plant to each resource (Liter)
QT Maximum holding weight of biomass fuel for each truck (typically assumed 16 tons)
Csawrm Unit cost of purchasing one ton of biomass feedstock (sawmill) from different industries(e/tons)
αrbm Decision variable value between 0 and 1 represents the portion (bio-mass) provided by each of the different resources to each one of the biomass potential power plants for each month in the whole year RAmr Total monthly amount of biomass (sawmills) that could be available
each month at the sawmill industry which is variable along the year for each biomass resource site(tons)
EBnewmb Total new monthly power production of the new implemented Biomass power plant (KWh)
EPeh Total hourly power production of existing power plants (KWh) in the baseline year 2016
ALb Total area of the polygon that corresponds to the new potential biomass power plant location(m2)
Astob Number of storage units for the new biomass power plant , each unit has an area Asunit(m2) and Sunit (tons) as a maximum storage capacity of biomass feedstocks per Asunit
Rmb Decision variable indicating the total available monthly amount of sawmill that is necessary by the biomass potential power plant to have a standard operational status(tons/month)
LHV Lower heating value of the sawmill to be burned inside the boilers in the biomass potential power plant b (KWh/tons)
MCmr Moisture content for biomass sawmill residues at each resource site
for each month(%)
Ravm Total average monthly amount of Biomass(sawmill) that are available
in the whole region R (tons/month)
ng Overall electrical efficiency for each Biomass power plant (%)
RSmb Monthly amount of sawmills storage for each biomass power plant (tons/Month)
f max, f min Minimum and maximum range of necessary stored amount of wood biomass at the power plant site
biorate Approximated coefficient(tons/KW) to convert annual burned tons of biomass to installed power capacity(KW)
Cstor cost of storage infrastructure according the used storage method (Euro) dbgb Minimal distance from the centroid of biomass power plant to the
elec-tric grid lines(m)
dbRb Minimal distance from the centroid of the biomass power plant to the nearest road network(m)
CRan Unit cost for road construction (e/m)
closs Coefficient of loss in energy production(% of total energy(KWh)/m) dbWb Minimal distance from the centriod of biomass power plant to the
nea-rest water bodies resources(m)
Fbio Total CO2eq emissions of biomass power plants in the projected year
(KgCO2e)
Ftransp Total CO2eq emissions during the projected year due to the used trucks
(KgCO2e)
QCO2eb Total CO2emissions quantity of biomass power plants(tons CO2)
GW P Global warming potential of CO2
E f Emission electricity factor (CO2/KWh)
Eb Expected Annual energy for each power plant in a year(KWh)
Qerb Unit emission CO2eq which are covered by each truck(KgCO2
/liter-truck) assuming constant for each truck in this problem
nrbm Total number of trucks that are used to transport biomass feedstocks from sawmill industry to each of biomass power plants in one year
Listes de publications
1. Al-Kurdi, N., Pillot, B., Gervet, C., Linguet, L. (2019, September). Towards robust scenarios of spatio-temporal renewable energy planning : A GIS-RO approach. In International Conference on Principles and Practice of Constraint Programming (pp. 729-747). Springer, Cham.
2. Pillot, B., Al-Kurdi, N., Gervet, C., Linguet, L. (2020). An integrated GIS and robust optimization framework for solar PV plant planning scenarios at utility scale. Applied Energy, 260, 114257.
3. Al-Kurdi, N., Pillot, B., Gervet, C., Linguet, L. (2020, July).A systemic decision support approach for biomass energy assessment, storage and delivery. Renewable Energy(Submitted, 2020)
4. Pillot, B., Al-Kurdi, N., Gervet, C., Linguet, L. (2020). SONET analogy for solar PV site selection at utility scale.Renewable Energy (Will be submitted)
5. Ongoing Work : Innovative framework for optimal spatiotemporal site selection for renewable energy plants(Solar, Biomass) at utility scale
Chapitre 1
1.1
State of Art
1.1.1
Barriers of renewable energy integration and needs of energy planning
scenarios
Currently, the integration of renewable energy(RE) resources to the electric grid is a major challenge especially for intermittent resources (Wind, Solar, etc.). It is still a difficult task in isolated or islanded networks for energy planners and network managers from one side and ecologists from other side. This RE integration will be studied according to technical, economical, environmental and societal levels for its success. In isolated networks, since maintaining the stability of the electric grid is of highly concern, for this reason, the intermittent resources which are integrated to electric grid is limited up to a certain limit perhaps 30 or 35 % of the total power demand(EDF, 2017). This issue could halt the excess generated energy to be injected to grid and thus, limiting the deployment of RE resources. But, thanks to dispatchable renewable energy resources and storage techniques to play an important role in keeping the stability of such network.
This thesis work contributes in solving the barriers and issues related to renewable energy inte-gration and its development generally but particularly, in such isolated networks. This contribution of renewable energy (RE) development is different from one region or country to another according to their different geographic distribution of manufacturing, usage and export(SEN et al., 2017) as well
as their different climatic temporal zones.
Many barriers referred to different sectors could halt the RE development in different regions worldwide(PAINULY, 2001). From the technical side, system constraints and lack of information or data unavailability particularly for intermittent resources are the main barriers and limit such development, for the economical side, the high costs of RE systems and lack of financial support from different parties were the main categories. Also, the social acceptance is one of the barriers where people have to accept or oppose such implementation, market failure or lack of suitable infrastructure is still a challenge and ending up with environmental constraints which is now an important barriers that prevents this technology from widespread in case of severe impacts on environment. Currently, decarbonization of energy sector is a basic strategy should be done and managed by several countries throughout RE deployment1. According to IPCC and World Bank, the total emissions issued from the power sector could have been increased by 20% without the integration of renewable energy generation. Thus, it is important to encourage such RE development anywhere to combat climate change and ensure energy needs satisfaction. RE energy deployment is an important stra-tegy for renewable energy transition planning and full independence on fossil fuels resources.Thus, The renewable energy must be evaluated from technical, economical, environmental and social levels. RE deployment remains a main challenge in islanded networks where land scarcity and maintai-ning the stability of electric grid exist. To provide some solutions for isolated networks and maintain their stability, several technical and economical benefits of energy storage have been summarized in this reference(RODRIGUESet al., 2014).In addition, non-intermittent RE resources are still an
impor-tant source of energy production which will be highly recommended to replace fossil fuels resources. Building up scenarios for integrated renewable energy to the power network is highly important to guide decision making for unknown future(BRAUNREITER et al., 2018). Most of organization,
governments, and investors apply this concept of scenario projections to forecast their future planning and decision making strategy.
1. https ://www.irena.org/-/media/Files/IRENA/Agency/Publication/2017/Mar/Perspectives for the Energy Transition 2017.pdf
In our case, most of islands are highly based on fossil fuel to produce their electricity and satisfy their needs but it’s too costly leading islands to look for their full dependency from natural resources and develop their RE systems from economical side as well as ecological one. They want to reach an energy supply/demand balance strategy to protection their network. Thus, integration of intermittent renewable energy resources is still a difficult issue in isolated networks where the international interconnection is absent, and fluctuation of intermittent energy variability exists. So, several restrictions and constraints must be respected to keep this network safe and stable(NOTTON, GILLESet al., 2019).So, the main issue that isolated or islanded networks is the lack of resources or
either land scarcity to deploy renewable energy plants. To achieve a balance among multiple sectors, energy planning strategies must be respected.
To evaluate an uncertain future of energy systems taking into account the following criteria : sustainability, competitiveness, and supply security requires integrating of scenario planning, analysis of energy system and multi-criteria decision(WITT et al., 2020 ; ANTUNES et al., 2016). So, this energy transition from current electric network to full dependency on RE requires techno economic, socio-environmental and policy challenges(WITT et al., 2020). It leads to derive energy planning
scenarios to assess the long-term of future energy sector. Energy scenarios are necessary needs to perform long term planning for energy system sector.
Building up scenarios related to energy sectors from the technical economical side is an important energy planning strategy and we have focused extensively in this direction for this thesis work as a main challenge but it will be completed in order to be assessed from the socio-environmental strategy. Social acceptance for RE projects is also playing a significant role in renewable energy investments. How social acceptance should be evaluated as well the environmental factor. Intensive literature review is illustrated in the next part.
The origin definition of the social welfare is referred to Bergson-Samuelson social welfare function (LUENBERGER, 1995), and has been defined as 3D structure composed of three major parts : Socio-political, community and market acceptance (WÜSTENHAGEN et al., 2007). These three major parts must be considered for the success of RE system investment. Many literatures have illustrated this factor as a successful one in the field of renewable energy . So, (KARDOONI et al., 2018) did a social study about the evaluation of the public opinion on renewable energy technologies and climate change in Malaysia. This study proposed a statistical survey including these main questions (Public opinion about climate change, knowledge about renewable energy technologies and their availability resources, environmental impact of renewable energy, level of effectiveness of the polices and awareness about these policies that are initiated by the government). Results showed that renewable energy is important for Malaysian as well as their willing concern to know about the climate change. (PERLAVICIUTE et al., 2018) showed that the energy transition could not be done without the public opinion. Thus, the social acceptability is an important factor could be evaluated by the public upon the implementation of new energy projects. Public opinions could be (positive, uncertainty, passive, support, etc.). This study confirmed that certain measures could not be neglected as usual, then different projects should include all developers, engineers, governmental parties, environmental research team, professionals, etc., and public members could change decision into acceptance, reducing its implementation schedule’s time and avoiding any vast change during its installation. (ABDMOULEH et al., 2018) presented a survey about the public opinion regarding smart
grid and energy efficiency and renewable energies applications in Qatar. This study completed the missing gap in Qatar based on sample design to estimate the social perception for future perspective of energy efficiency actions. The results of this survey are quite important for decision makers as well as policies of institution for the implementation of energy and new technology especially new concepts and techniques (Smart grid, data security, dynamic pricing, and smart meter services).
Another study is verified by (TANet al., 2017) on a real case power plant in China. Their objective was to maximize the profit as well as the social welfare including environmental, social surplus and governmental subsidies and was applied to a 30 MW large scale biomass power plant where data input has been assumed and investigated in this fields. To avoid governmental supports and to encourage such plants, new combination of renewable hybrid system must be interfered to keep a continuous generation power of electricity even during the intermittence or the maintenance period. (LIU et al.,
2008) evaluated the social welfare maximization in transmission enhancement considering network congestion during the different seasons of the year. The social welfare is evaluated as the total surplus of generators, wholesalers and customers’. The generators’ surplus is when they generate more power to cover the losses in transmission lines, the wholesaler is positive when the price is not at equilibrium status due to congestions and finally, the customer’s utility is the usefulness gain upon using the power.
(HOHMEYER, 1992) highlighted a well explained study about the social costs of electricity
of both renewable and non-renewable resources including (fossil fuels and nuclear). Severe social costs could leads to health damage, cancer incidents, death and radioactivity emissions for instance (Nuclear accidents at Chernobyl). Rather than that, it leads to relocation of population due to war, job creation effects and more. It is noticed that the social costs are changing by the time as well as their corresponding impacts upon the implementation of various energy projects. It has been evaluated as the difference the social costs between the new technology and the conventional technology taking into account certain factors. Many policies should be followed by imposing the social cost to improve and reduce the effects of climate change. It is known that climate change leads to different bad impacts on the planet as (flooding, storms disease dispersion sea-level rise, food security etc.). Another definition of social cost is to measure the economic harm from that impacts. Thus, the value of total damages from emitting one ton of carbon-dioxide into the atmosphere. The average estimate of social cost of carbon is about 40 dollar per ton. Thus, different governmental policies had already included such cost in their plans to face the climate change damages. As a conclusion, evaluation of social acceptance plays an important role in the decision of implementation of renewable energy projects. Before any implementation ; it should be taken into account either modelling that is based on updating the previous definitions or using a survey questions analysis in the regions of implementation to estimate the public acceptance.
With respect to environmental scale, life cycle assessment is a popular technique that has been mostly used by old and recent studies for various applications. It handles different aspects and its corresponding potential effects during the whole project’s lifetime . In the domain of renewable energy, this technique will be used to estimate GHG emissions of power plants beginning from raw material acquisition, manufacturing, operation and eventually till its decommissioning. The IPCC(Intergovernmental Panel on Climate Change) assumed that the global warming potential (GWP) is one for CO2 over a 100-year time span where GWP is the ability of a GHG to trap heat in
the atmosphere relative to an equal amount of carbon dioxide. For renewable energy technologies, the majority of GHG emissions for a PV power plants as well as Wind farms takes place in the upstream of materials operation and at the industries where manufacturing PV modules occurs. Different methodologies are highlighted by (AKELLAet al., 2009) upon presenting in their study the different
impacts of renewable energy systems including the society, environment and their economic situation. Baseline methodologies are followed to estimate the total emissions by the renewable energy plants. Among these methodologies, system average (current emissions from different mix of renewable energy plants to supply the power that are in operation), build margin (estimated emissions of recent new planned or added power plants to the system), and lastly, the operating margin (emissions of power plants that are operated at high costs and could be shut-down due to different alternatives of power supply at lowest cost). This factor was only evaluated at the operational status in our work for biomass including plant’s emissions and transportation sector while, for PV solar plants, it has
negligible emissions during its operation.
This work will answer the questions how could we optimize or find an optimized RE energy matrix which is characterized by its least cost-effective of maximum production efficiency, and also, environmentally and socially accepted by public.
Multi-criteria decision and energy planning have been correlated since longtime to handle energy problems. A brief description of this method is explained in the next section.
1.1.2
Multi-criteria Decision Making and Energy Planning
Multicriteria decision making (MCDM) is a branch of operational research that is used to choose the best suitable optimal solutions among all the other feasible ones. It’s importance has been shown in many fields and energy planning is among one of the them, due to its flexibility to recognize many criteria that are related to different complex scenarios (A. KUMARet al., 2017) .
MCDM is not a method that can be directly applied to solve real life problems in a regular way but it is rather a method of application involving different criteria to assist in making decision. Foundation of modern MCDM was between 1950 and 1960. Classification and observation of inter-national journal article from 2000 to 2014 showed that (Energy, Environmental and Sustainability) and (Operational research and Soft computing) were the most widely domain of applying MCDM tools. Among decision making techniques, Analytic Hierarchy Process(AHP) and MCDM hybrid were the most applied tools to solve real life problems (MARDANIet al., 2015).
According to many definitions, MCDM has been classified into three major groups (MATEO,
2012) : Multi-objective decision making (MODM), Multi-attribute decision making (MADM) and Hybrid which is their combination. Furthermore, MODM and MADM investigate the continuous and discrete decision space problems respectively. MCDM techniques have been applied to different various domains but a lot of common notations are used. A few brief basic description about each terms is represented as follows : alternatives(Different options of available action to the decision ma-ker), multiple attributes(Decision criteria or targets), conflict among criteria(Dimension’s difference), incommensurable units( Different measured units), decision weights(Each criteria must be linked to a weight of importance), and eventually, for more details about the decision matrix , it is represented in this (ZIMMERMANN, 2011) to express MCDM problem.
There is a common procedure for MCDM analysis which is represented and described in (A. KUMAR et al., 2017). Moreover, categorization of MCDM methods can be achieved either by depending on the type of the used data which might be deterministic, stochastic, or fuzzy MCDM methods or in particular cases combination of multiple methods. Other categories classified them according to the number of decision makers included in the decision process(Single and group decision makers MCDM methods). Most of the popular methods that have been used in energy planning fields are mentioned and reviewed exhaustively by (A. KUMARet al., 2017) including their area of application within their strength and weakness.
In order to apply this approach of MCDM methods, a preliminary action of state of art is necessary to review the previous existing MCDM models especially which are applied to energy planning domain. Both approaches(deterministic and stochastic) have been described.
Existing Deterministic MCDM Methods
measu-rement models) includes mainly these methods : Weighted Sum Model(WSM), Weighted Product Model(WPM), Analytic Hierarchy Process(AHP), Multi-Attribute Utility Theory (MAUT), which are mainly used for ranking energy technologies. As a result, AHP was the most applied popular one in the field of energy planning (A. KUMARet al., 2017).
The second category(Goal, aspiration and reference level models) includes mainly TOP-SIS(Technique for Order Preference by Similarity to Ideal Solution) and its updated version(VIKOR). Thus, its main concept is dependent on Euclidean distance(A. KUMAR et al., 2017) in which the shortest distance from the ideal solution(Positive value) referring to the selected alternative and the farthest distance from the negative value (TRIANTAPHYLLOU, 2000).
The last category(OUTRANKING MODELS) includes mainly ELECTRE (Elimination and Choice Expressing Reality) to handle the problem of outranking relations among alternatives corresponding to each one of the criteria in a separate way based on pairwise comparison
(TRIANTAPHYLLOU, 2000) and it was later developed by (Promethee and Gaia,1980) to
PROME-THUS(Preference Ranking Organization Method for Enrichment of Evaluations).These are the two most used popular methods in energy planning which are preferable to be applied for choice of allocating energy in demand side (A. KUMARet al., 2017). Its concept is clarified by dominance of alternatives and their corresponding criteria (TRIANTAPHYLLOU, 2000).
PROBABILISTIC AND FUZZY - STOCHASTIC Methods
Stochastic process is defined as a set random variables ( might be in relation) that are related to a changing factor where a state space represents the potential values(THOMPSON et al., 1985).When there is certainty in the alternatives, using of deterministic models is preferable and if uncertainty is apparent, fuzzy and stochastic MCDM models are useful.
Conclusion
In general, MCDM methods play an important role in solving many real complex problems of different fields in particular energy planning domain. In particular of fuzzy modelling and renewable energy systems was reviewed in (SUGANTHIet al., 2015) and many applications related to renewable energies have been reviewed by (MARDANIet al., 2015).
1.1.3
GIS studies with MCDM
Today, 17% of the earth’s population around the world do not have access to electricity2. So, renewable energy is an important solution to feed the increase in power demand in large cities where these power plants facilities are connected to the power network and also, for remote or rural areas where off-grid or micro-grids exists to handle the lack of electricity. However, implementation of renewable energies at large scale increases in a slow pattern due to high costs as well as missing and unclear concepts about the market potential but in order to encourage countries to shift towards renewable energies, a techno-economic analysis is an important step for the investors and policy makers in parallel of attaining an environmental benefits, i.e. decreasing in the quantity of greenhouse gases(GHG) emissions and to compete the increase of fossil fuel prices(BLECHINGERet al., 2016).
Different studies applied the combination of GIS-MCDM that is widely used as a powerful technique to determine the favourite locations for renewable energies implementation of different technologies (Solar, Wind, Biomass and Hydro. . . ) around the world. For the solar PV sites se-lection : those studies applied GIS-MCDM techniques : (AL GARNI et al., 2017 ;DOORGA et al., 2019 ;PIIRISAAR, 2019 ;GAŠPAROVI ´C et al., 2019 ;DIAZ-CUEVAS et al., 2019 ; etc), even within
fuzzy theory MCDM techniques combined with GIS(DHUNNYet al., 2019 ;AKTASet al., 2019 ;ALI
et WAEWSAK, 2019 ;etc).
For wind sites selection(VILLACRESESet al., 2017 ;ALI, TAWEEKUNet al., 2019 ; etc).
For biomass site selection, these studies applied GIS-MCDM(JEONG et al., 2018 ;WOOet al., 2018 ; TEIXEIRAet al., 2018 ;MORATOet al., 2019 ;C.-N. WANGet al., 2019 ;WUet al., 2019 ; etc).
For Hydro sites selection, these studies applied mainly GIS to assess the optimal hydropower poten-tial locations(ROJANAMON et al., 2009 ;LARENTIS et al., 2010 ;BAYAZIT et al., 2017 ;GAREGNANI
et al., 2018 ;IBRAHIMet al., 2019 ;etc).
Also, for renewable energy planning recommendation, these studies applied MCDM to evaluate the future electricity generation scenario(HUSSAIN MIRJAT et al., 2018)and also for selection of
renewable energy technologies(YAZDANIet al., 2018) respectively.
But this technique is highly based on the opinions of the decision maker to evaluate the impor-tance of major criteria that could have an impact on the realistic deployment of renewable energy projects due to uncertainty in their decisions even though it might handled via fuzzy theory. This method is perhaps useful study in the primarily planning stage.
Implementation of renewable energies is a complex real problem where advanced techniques are also used to solve such problems using artificial intelligence technique that is composed of artificial neural network, fuzzy logic method , genetic algorithm and hybrid models including combination of them. These advanced techniques using baysiean network which is applied into different major renewable energies applications mostly at systemic level such as : forecasting, fault diagnosis, maintenance, operation, planning, sizing and risk management (BORUNDAet al., 2016).
As a summary, this combination(GIS-MCDM) method is not well enough to provide a clear over-view of renewable energy planning due to the ignorance or missing of some different related criteria as compared to each other. As a conclusion, it rather provides a suitability map based on static resource assessment and expert’s decision opinions which could affect the realistic deployment of renewable energies.
1.1.4
Holistic Bottom-up energy approach
Various studies have reviewed the current existing energy modelling systems and tools but the most common classified criteria are : time horizon, temporal and spatial resolution, methodology, analytic approach and programming techniques (LOPION et al., 2018 ;RINGKJØBet al., 2018 ;HALL
et al., 2016).
Energy models and tools are either based on optimization approach(as LP, MILP, NLP, etc.) which the majority of energy models using bottom-up optimization as their analytic approach to describe the engineering aspects of the systems or simulation approach in order to describe the behaviours of a real system using input values to handle their energy problems(HACHEet al., 2019 ;LUND, ARLER
et al., 2017).
Large variety of models (LOPION et al., 2018 ;RINGKJØB et al., 2018 ;HALL et al.,
2016 ;DEBNATH et al., 2018,HACHE et al., 2019) have been used in literature, to satisfy dif-ferent targets such : energy information system, energy demand-supply model and energy emission model (DEBNATH et al., 2018) and the most common used energy models and tools are :
HO-MER (RAJBONGSHI et al., 2017 ;SINHA et al., 2014, MAKHIJA et al., 2019 ;SHAHZAD et al., 2017 ;GARRIDO et al., 2016), ENERGYPLAN (LUND, ARLER et al., 2017), TIMES3(The
ted MARKAL-EFOM System), LEAP4(Long-range Energy Alternatives Planning System), LUT( hourly demand power linear energy model at Lappeenranta University of Technology)(BREYER,
BOGDANOV, KOMOTO et al., 2015), and Other tools5(H2RES, STREAM, energyPRO. . . .) are
summarized and referenced as our aim is not to go deeply in investigating most of energy models but just to highlight the most familiar ones in literature. Thus, the most common target of energy modelling is to forecast or explore or backcast the energy sector in the country for a long-term period (HALL et al., 2016). In addition to that, energy models play a major role at different various levels to develop a basic strategy of future energy planning by making relevant decisions throughout the analysis of energetic scenarios’ concept which is a meaningful tool to handle the uncertainty of the future that might exists.
However, energy models are mainly involved the concept of scenarios in order to explore the future of energetic sector in any country, where other roles of scenario as predictive or anticipa-tive, that might use probabilities, cannot be clearly viewed(BRAUNREITER et al., 2018 ;LUND,
ARLER et al., 2017). This restricts us to follow an explorative methodology of scenario planning described as what-if projections, to explore the desirable futures of the energy sector especially electricity(BRAUNREITERet al., 2018).
Large intense studies in literature have carried out similar key objective to reach a 100% renewable energy transition power system in the next decades. For instance : (AGHAHOSSEINI et al., 2020) studied the possibility for 100 % sustainable renewable energy transition in MENA region( Middle East and North Africa). This study applied the LUT linear energy system model whose objective is to meet hourly the power generation and demand at minimal total annual costs in the year 2030. Also, this study( SELOSSE et al., 2018) analyzes the feasibility of renewable energy revolution in La Reunion french islands. This study applied the bottom-up optimization energy model (TIMES-Reunion) to analyze different scenarios of renewable energy resources towards 100% renewable energy transition. This model aims to allow high possibility of renewable energy integrated to the power network at global minimum costs.Results showed that this transition was feasible by 2030 where biomass could replace the coal power facilities within 50% in addition to other main resources from Solar PV and Hydro. This result was interesting due to economical development of biomass sector which will highly contribute to satisfy governmental targets by 2030.
Further studies (LUND et MATHIESEN, 2009) applied ENERGYPLAN to analyze the feasibility
of renewable energy transition in Denmark. Results confirmed again that the plan for 50 % renewable energy transition by 2030 was feasible and the next plan for 2050 to reach 100% is physically possible depending on domestic resources. These resources are under study by Denmark to reach such target either from biomass (farming areas) or Wind (large share of hydrogen).
Other recent studies like Jordan (KIWANet al., 2020) willing to achieve a 100 % of renewable energy transition by 2050, however at the current status, it is highly dependent on fossil fuels resources. This work proposes four scenarios but the major resources for 100% renewable energy are mainly from Wind (10%), PV(40%) and CSP(50%).This study applied three models (LEAP, Energy-Plan and SAM) for the comparison of different scenarios of Jordan’s electricity production by 2050 .
On other sides, different HRES have been applied to small or rural regions. For instance : (AKRAM et al., 2020) optimized a hybrid renewable energy system using HOMER Pro software.
This study aims to provide a suitable solution to meet the power load in Chaghi city which is a remote area in Pakistan. Climate( GHI, Wind speed,..) and energy data ( Appliances energy demand in single house) have been retrieved from NASA and RETScreen sources respectively. Results showed that
4. https ://www.energycommunity.org/default.asp ?action=introduction 5. https ://www.energyplan.eu/othertools/
the proposed HRES(Wind Turbine, PV, Battery, Diesel generator) with demand side management has a lowest cost of electricity COE(Euro/KWh) which will mitigate the total costs and increase the system’s efficiency in such area as compared to other solutions.
Another study using HOMER done by (ODOUet al., 2020) showing that this HRES PV/DG/battery is the best optimal system among other scenarios(PV/battery ;Hydro ;Hydro/DG ;PV/hydro ;DG) of lowest COE for rural area of Fouay in Benin and Diesel Generator(DG) is used as a back-up when solar radiation is not sufficient due to clouds. This area has three main renewable energy resources(Solar, Wind and Hydro) excluding wind resource of low wind speed that is not adaptable for energy generation.
Despite the fact, that energy models are developed either to handle some specific or general cases or to study the behaviour of different energy systems. Some of them have a limited access as a property while others can be used but are not of free price. Some of them as HOMER and ENERGYPLAN do not handle multiple regions as in our case study although they have a high temporal resolution and they are beneficial tools as other models to handle a small or medium micro-grids systems (HOMER6) or a well-coordinated national energy system(ENERGYPLAN7)(JAMAL, 2016).
Decision-making and forecasting problems are generally linked to a given problem, and can be modeled using either deterministic approach(robust models) or stochastic approach (probabilistic way), depending on the representation of the uncertain data.
Both robust and stochastic programming optimization techniques, have been applied to handle different real world applications (GABRELet al., 2014 ;YANIKO ˘GLU et al., 2019), including energy
planning problems (BABONNEAU et al., 2010 ;MORET et al., 2019 ;WALLACE et al., 2003). Both of them are considered constructive approach (MULVEY et al., 1995). In Robust optimization, no probability density function is introduced to treat the uncertainty(BABONNEAU et al., 2010),
howe-ver, stochastic programming describes a problem class and it is not looking for an optimal solution because mostly, the exact real data is not available allowing the use of stochastic programming to estimate such data using probability density functions to handle the uncertainties that might exist
(WALLACE et al., 2003) while once the real data is available at hand, robust optimization against
uncertainty is a useful technique to look for optimal solutions even such data parameter ‘s changes, the robust solutions do not change(BABONNEAUet al., 2010). This approach is proposed in our work
as our data is real and we want to address the risk adversity of the decision maker for our renewable energy planning problem.
Conclusion
As conclusion, the combination GIS-MCDM studies provides generally a spatial analysis throu-ghout suitability map of static resource assessment, indicating the favourable and unfavourable regions for the exploitation of renewable energy plants whatever its types, but it does not take into account the temporal constraints that are related to the power generation and demand. On other side, using the bottom-up energy models which optimize or simulate an energy profile at regional/national scale for the whole country or small/medium scale for standalone energy systems but it does not provide the exact real location of the plant and its corresponding size. So, our main research work have been performed by integrating the plus of both approaches without the minuses throughout combining geographical and temporal constraints to the renewable energy planning problem using spatio temporal data. Finally, we have developed a new integrated GIS-Robust optimi-zation framework to select the best renewable energy plant sites at a regional scale but we’ve applied
6. https ://www.homerenergy.com/ 7. https ://www.energyplan.eu/
it separately and simultaneously for each renewable energy resource (Solar and biomass in our study).
1.2
French Guiana
1.2.1
Location and Climate
French Guiana is an overseas french department that is located in northern coast of the South Ame-rica’s continent. It has boundaries with Suriname (west), Brazil(south-east) and Atlantic ocean(north-east). The total area of French Guiana is about 83846 km2(EDF, 2017) where about 96% of its total area is covered by the Amazon forests and its population(January,2018) was about 287504 inhabi-tants(IEDOM, 2018).
The climate in French Guiana(FAYAD, BAGHDADI, GOND et al., 2014) is equatorial and it has two
main seasons : dry season(August to December) and rainy season (December to June). Because of its geographic position which is closer to the equator and also, to the Atlantic ocean, gives it a good climatic stability where wind and temperature have slightly annual variation in contrary to the rainfall annual variations(IEDOM, 2018) .
1.2.2
Structure of electric power system
In French Guiana, the national public electric grid(CTG, 2017) is composed of two main electri-cal systems : the first one is the coastal electrielectri-cal power network and the other mini-electrielectri-cal power systems in the interior regions which these systems are totally independent to provide such regions with electricity supply .
The coastal national electric grid(CTG, 2017) is structured around 90 KV as a high voltage trans-mission network where the three main sources of electricity production (Thermal plant at Dégrad Des Cannes, hydroelectric power at Petit Saut and the power plant at Kourou (TAC)) are connected in addition to other facilities that are injected to 11 main substations of this transformation voltage (90KV/20KV). The transmission lines network exists mostly in the eastern part of the coastal region from the Dégrad des-Cannes zone to Saint Laurent du Maroni in the western end and recently it reaches Apatou town in the western part providing more cities with electricity. These transmission lines has 414 km of lines. While, the main distribution lines which begin from the main substations of this transformation voltage(90KV/20KV station). It constitutes of 1150 km of high voltage(HTA at 20 KV)) where 44 % are buried underground and also, about 1193 km of low voltage(BT of 410/227 V) where 47 % are also buried underground in addition to 1158 transformation substations(HTA/BT).
1.2.3
Electricity power production and consumption
The power production profile in the coastal region of French Guiana in 2016(EDF, 2017) is dis-tributed as follows : Thermal(44.7%), PV(6.1%), Hydro(47.9 %) and Biomass(1.3%). While, the electricity consumption in the coastal and interior regions is described where the current and forecast energy demand by EDF is increased from 910 GWh in 2016 to 1200 GWh in 2033 respectively(EDF, 2017).
There is an obvious increase in the energy demand in both coastal and interior regions in French Guiana within the increase in population’s growth, changing of life style activities and development of economy(CTG, 2017). So, more energy production especially from renewable energy resources is required to meet the increase in power demand.
Majority of French Guiana’s populations are settled in the coastal region of the Atlantic ocean among four major municipalities (Matoury, Kourou, Saint Laurent du Maroni and four districts of Cayenne). These cities are connected to the main coastal national electric grid to provide electricity to residen-tial, industrial and transportation sectors while independent power facilities disconnected from the national electric grid provide the other interior regions, where most of them are located in the eastern and western borders of Brazil and Suriname respectively in French Guiana (EDF, 2017).
1.2.4
Renewable energy resources in French Guiana
French Guiana is abundant of renewable energies potential resources. A brief description of each resource is performed as follows.
Solar potential resource
French Guiana has a high potential of solar irradiation especially in the coastal regions. So, this encourages the solar PV market players for more investment.
The solar radiation measurements was performed depending on six major stations located in French Guiana region(Saint Georges, Rochambeau, Kourou CSG, Ile Royale, Saint Laurent, Maripasoula) for a period of five years. It has been shown that the annual averaged variation interval of GHI varies between 4.46 and 5.48 KW h/m2.day , and that for DNI varies between 5.11 and 6.24 KW h/m2.day respectively. This solar potential is estimated based on Heliosat 2 method( by the aid of Meteo data).These estimated data have also been confirmed by Brazilian Atlas data(FILLOLet al.,
2017 ;ALBARELOet al., 2015).
As a result, the deployment of PV solar power plants have been increased due to the abundant avai-lability of such solar potential resource in Guiana Shield and particularly in French Guiana. This explains the increase of PV market players’ deployment there.
Biomass potential resource
According to previous study, done by (ONF-CIRAD, 2007), French Guiana has a vast potential of biomass resource where it is categorized to four different groups with respect to its extraction forms. So, the first one is wood for energy use as well as the dedicated wood for energy use, agricultural residues and the last one is the wood due to the actions of opening new track forest routes(ONF
-CIRAD, 2007).
The annual available potential of biomass is distributed in different regions where the first category has a higher annual potential in the eastern regions as compared to all others , agricultural residues are mainly much available in three parts (Western, Western Center and Eastern Center) as well as limited biomass potential that is dedicated for biomass energy production. Also, this activity of open tracking residues in the forests is only observed in the eastern part region(ONF-CIRAD, 2007).
Mobility of biomass in French Guiana is limited by their transportation costs that might be accounted for a slope of less than 40 % and in the outside of wet lands regions. Rather than that, agricultural biomass to be considered for a slope of less than 30 % and outside of flooding zone(ONF-CIRAD, 2007).
The moisture content (amount of water inside the biomass feedstocks) is variable by time during the year as well as its lower heating value(LHV) with respect to each moisture content(ONF-CIRAD, 2007). The last recent research study done by(FAYAD, BAGHDADI, GUITET et al., 2016) estimates
the aboveground biomass potential mapping in French Guiana based on the combination of remote sensing, forest inventories and environmental data .
According to ADEME8 and Cellule Biomass9 investigations in 2017, the total amount of biomass from different resources of different types for energy uses is estimated to be 475000 tons/year by 2023 and 770000 tons/year by 2030. According to (CTG, 2017 ; EDF, 2017), 42 MW biomass power plants capacity is planned to be build by 2023 and 61 MW by 2030.
Thus, the development of wood energy sector in French Guiana requires an accurate feasibility study to choose the materials such as boilers that is compatible with the variability of biomass quality as wood density and ash content.(ONF-CIRAD, 2007).
8. https ://www.guyane.ademe.fr/expertises/energies-renouvelables/biomasse 9. http ://www.daaf.guyane.agriculture.gouv.fr/Les-acteurs-de-la-filiere-biomasse