HAL Id: tel-03153432
https://hal.univ-lorraine.fr/tel-03153432
Submitted on 26 Feb 2021HAL is a multi-disciplinary open access archive for the deposit and dissemination of sci-entific research documents, whether they are pub-lished or not. The documents may come from teaching and research institutions in France or abroad, or from public or private research centers.
L’archive ouverte pluridisciplinaire HAL, est destinée au dépôt et à la diffusion de documents scientifiques de niveau recherche, publiés ou non, émanant des établissements d’enseignement et de recherche français ou étrangers, des laboratoires publics ou privés.
Characterization of gas transport phenomena in gas
diffusion layers in a membrane fuel cell
Mainak Mukherjee
To cite this version:
Mainak Mukherjee. Characterization of gas transport phenomena in gas diffusion layers in a mem-brane fuel cell. Chemical and Process Engineering. Université de Lorraine, 2020. English. �NNT : 2020LORR0176�. �tel-03153432�
AVERTISSEMENT
Ce document est le fruit d'un long travail approuvé par le jury de
soutenance et mis à disposition de l'ensemble de la
communauté universitaire élargie.
Il est soumis à la propriété intellectuelle de l'auteur. Ceci
implique une obligation de citation et de référencement lors de
l’utilisation de ce document.
D'autre part, toute contrefaçon, plagiat, reproduction illicite
encourt une poursuite pénale.
Contact : [email protected]
LIENS
Code de la Propriété Intellectuelle. articles L 122. 4
Code de la Propriété Intellectuelle. articles L 335.2- L 335.10
http://www.cfcopies.com/V2/leg/leg_droi.php
Caractérisation des phénomènes de transport de gaz dans les
couches de diffusion de gaz dans une pile à combustible à
membrane
THESE
Présentée àL’ Université de Lorraine
de l’obtention du grade de
Doctorat de l’Université de Lorraine
(Spécialité: Génie des Procédés des Produits et des Molécules)
par
Mainak MUKHERJEE
Soutenue publiquement le 17 Décembre 2020 devant le jury composé de :
Rapporteurs
Dr. Bruno AUVITY Professeur LTeN, Université de Nantes
Dr. Jonathan DESEURE Maître de conférences-HDR LEPMI, Université Grenoble Alpes. Examinateurs
Dr. Serguei MARTEMIANOV Professeur ENSIP, Université de Poitiers.
Dr. Melika HINAJE Professeur GREEN, Université de Lorraine.
Dr. François LAPICQUE Directeur de recherche (Directeur de thése)
LRGP, Université de Lorraine.
Dr. Caroline BONNET Maître de conférences (Co-directrice de thése)
LRGP, Université de Lorraine.
Laboratoire Réactions et Génie des Procédés (LRGP)
“Dream, dream, dream. Dreams transform into thoughts and thoughts result in
action”- Dr.APJ Abdul Kalam
“When an idea exclusively occupies the mind, it is transformed into an actual
physical or mental state”- Swami Vivekananda
i
Abstract
In membrane fuel cells, the feed gas must pass through a porous layer of carbonaceous material (GDL, gas diffusion layer) to access the catalyst, enabling the electrochemical reaction and subsequent energy production. In general, this layer consists of a macroporous substrate (MPS) covered by a thinner structural undercoat called a microporous layer (MPL) in contact with the electrode.
The project here focuses on the study of gas transport phenomena in commercially available diffusion layers, which are essentially complex porous media (MPL+MPS). GDLs have a key role in the distribution of gases and the evacuation of produced water: in addition to diffusion and convection, the intrinsic properties of these layers are known to play a significant role on the overall performance of the fuel cell. The present approach relies on various sources of experimental observations to understand and characterize these transport flows in GDL in order to obtain a phenomenological formalism.
To this end, ex-situ measurements using a "diffusion bridge" technique are carried out in a laboratory cell (called a fundamental cell) to estimate the directional permeability of the gas or in a fuel cell to estimate the equivalent permeability under conditions closer to cell operation. Essentially, the conditions for measuring gas transport have been modified, using (i) a single dry gas, (ii) a mixture of dry gases, (iii) humidified gases, (iv) gas flow in the presence of liquid water, and (v) variable cell compression.
The results obtained on gas permeability, first through experimentation and then by using the data in established fundamental models, provide more precise information on the gas transport mechanism in these complex-structured GDLs when placed inside PEM fuel cells, leading to a significant understanding.
ii
Résumé
Dans les piles à combustible à membrane, les gaz d’alimentation doivent passer à travers une couche poreuse à base de matériaux carbonés (GDL) gas diffusion layer pour accéder au catalyseur, rendant possible la réaction électrochimique et la production d'énergie qui s'ensuit. En général, cette couche est constituée d'un support macroporeux (MPS, macroporous substrate) recouvert d'une sous-couche de structure plus fine appelée couche microporeuse (MPL, microporous layer) en contact avec l'électrode.
Le projet porte ici sur l'étude des phénomènes de transport des gaz dans les couches de diffusion disponibles dans le commerce, qui sont essentiellement des milieux poreux complexes (MPL+MPS). Les GDL ont un rôle clé dans la distribution des gaz et l'évacuation de l'eau produite : outre la diffusion et la convection, les propriétés intrinsèques de ces couches sont connues pour jouer un rôle significatif sur la performance globale de la pile à combustible. La présente approche s'appuie sur diverses sources d'observations expérimentales pour comprendre et caractériser ces flux de transport dans la GDL en vue d'obtenir un formalisme phénoménologique.
À cette fin, des mesures ex-situ utilisant une technique de "pont de diffusion", dans une cellule de laboratoire (appelée cellule fondamentale ) pour estimer la perméabilité directionnelle du gaz ou bien dans une pile à combustible, afin d’estimer la perméabilité équivalente dans des conditions plus proches du fonctionnement de la pile. Pour l'essentiel, les conditions de mesure du transport de gaz ont été modifiées, en utilisant (i) un seul gaz sec, (ii) un mélange de gaz secs, (iii) des gaz humidifiés, (iv) un flux de gaz en présence d'eau liquide et (v) une compression variable des cellules.
Les résultats obtenus sur la perméabilité au gaz : d'abord par l'expérimentation et ensuite en utilisant les données dans des modèles fondamentaux établis, permettent d'obtenir des informations plus précises sur le mécanisme de transport du gaz dans ces GDL de structure complexe lorsqu'elles sont placées à l'intérieur des piles à combustible PEM, ce qui permet d'acquérir une compréhension significative.
iii Publication
Mukherjee M, Bonnet C, Lapicque F, Estimation of through-plane and in-plane gas permeability across gas diffusion layers (GDLs) : comparison with equivalent permeability in bipolar plates and relation to fuel cell performance , Int .J. Hydrogen. Energy 2020 ;45 : 13428-13440. https://doi.org/10.1016/j.ijhydene.2020.03.026
Arora D, Bonnet C, Mukherjee M, Arunthanayothin, Shirsath A, Lundgren M, Burkardt M, Kmiotek S, Rael S, Lapicque F, Guichard S. Long term study of directly hybridized proton exchange membrane fuel cell and supercapacitor for transport applications with lower hydrogen losses, J. of Energy Storage 2020, 28 : 101205 https://doi.org/10.1016/j.est.2020.101205 Arora D, Bonnet C, Mukherjee M, Rael S, Lapicque F. Direct hybridization of PEMFC and
supercapacitors : Effect of excess hydrogen on a single cell fuel cell durability and its feasibility on fuel cell stack. Electrochimica Acta 2019, 310 : 213-220
https://doi.org/10.1016/j.electacta.2019.04.073
Communications
Mukherjee M, Bonnet C, Lapicque F . Comparison between microporous layered and non-layered GDLs: experimentally validated in terms of gas transport and performance in membrane fuel cells. At 71 st Annual Meeting of International Society of Electrochemistry (ISE), 2020. Belgrade Serbia.
Mukherjee M, Bonnet C, Lapicque F , Shirsath A, Arora D, Rael S. Comparison of through-plane and in-through-plane gas permeability in the gas diffusion layers (GDLs) with pure and mixed dry gases. At 8 th International Conference on Fundamentals and Development of Fuel Cells (FDFC), 2019 Nantes. France
Mukherjee M, Bonnet C, Lapicque F , Shirsath A, Arora D, Rael S. The effect of permeability and porosity of gas diffusion layer (GDL) on the performance of a membrane fuel cell. At 8 th International Conference on Fundamentals and Development of Fuel Cells (FDFC), 2019 Nantes. France
Mukherjee M, Bonnet C, Shirsath A, Lapicque F . Characterization of gas transport phenomena through a gas diffusion layer in a membrane fuel cell. At 69th Annual Meeting of International Society of Electrochemistry (ISE), 2018. Bologna, Italy.
Mukherjee M, Bonnet C, Shirsath A, Lapicque F . Gas transport phenomena through the gas diffusion layer (GDL) in PEMFC and impact of mechanical degradation on GDL. At 8th European Summer school on Electrochemical Engineering, 2018. Toulouse France
iv
Acknowledgment
I would like to express my sincere gratitude to the thesis director Dr. Francois LAPICQUE and Dr. Caroline BONNET, for being exceptional in guiding me throughout the length of the thesis. A special thanks to Prof. Stephane RAEL, for having helped me set up distinct parts during the project that facilitated my work.
Also, I extend my sincere thanks to the distinguished jury members Prof. Serguei MARTEMIANOV, Prof. Bruno AUVITY, Dr. Jonathan DESEURE, and finally Prof. Melika HINAJE (President of the jury) for accepting to be a part of my Ph.D. journey. I would thank the Université de Lorraine, for the financial support provided during the length of my project, and the staff of the doctoral school ‘SIMPEE” for their continuous support. Besides, sincere thanks to the administrative, engineering, and service staff, at LRGP-ENSIC. A special mention and gratitude towards the workshop at LRGP, Charly KOENIG, and Christian BLANCHARD, who had helped me immensely for the completion of this project. Additionally, engineer J.F. REMY and Roda BOUNACEUR for helping me with various work from time-to-time. Interns Ryan, Deanna, and Laura from WPI, US, and Chen from ENSIC. Most importantly, I would furnish my heartfelt gratitude to my parents Mr. and Mrs. Mukherjee, my wife Meenakshi, and her family Mr. and Mrs. Pundir, my elder brother Dr. and Mrs. Mukherjee.
Finally, some friends out of many, Divyesh, Anantrao, Shantanu, here in Nancy. Aman, Prashant, Arnab, Sanjay, Pal, Srideep, Avishek, Souvik, Sayani, Subhangi, Chandan, Shantanu sir, Rishal, to mention a few back in India.
v
Table of contents
Introduction
A. Preface to the introduction ... 2
B. General context and global energy scenario ... 2
(i) The context of the energy transition ... 2
(ii) The global emission rates ... 3
(iii) The shift to renewable energy sources ... 4
C. Opportunity for hydrogen and the emergence of fuel cells ... 5
(i) Recognition of hydrogen ... 5
(ii) Emergence of the fuel cells ... 5
D. About proton exchange membrane fuel cells (PEMFCs) and the technology ... 7
(i) The PEM Fuel cell ... 7
(ii) Components of PEM fuel cells ... 8
(iii) Prospects and challenges of PEM fuel cells ... 10
E. Identifying the scope of the work and objectives ... 12
(i) The objectives identified are explained here as per their significance. ... 14
(ii) The layout of the thesis ... 15
1.1 The gas diffusion layer (GDLs) ... 18
1.1.1 The role of GDLs ... 18
1.1.2 GDL Manufacturing ... 18
1.1.3 Macro porous substrate (MPS) ... 19
1.1.4 Microporous layer (MPL) ... 20
1.1.5 Hydrophobic and hydrophilic treatments in GDLs ... 22
1.1.6 SGL nomenclature for the GDLs manufactured ... 22
1.2 Characteristics of GDLs ... 23
1.2.1 Porosity of GDLs ... 23
1.2.2 Gas permeability in GDLs ... 24
1.2.3 Anisotropy and tortuosity in GDLs ... 26
1.2.4 Structural strength of GDLs and clamping action on the cell assembly ... 28
1.2.5 Degradations in GDLs ... 29
1.3 Synthesis of few selected works in gas transport measurement and compression in GDLs .. 32
1.4 Conclusion to the chapter ... 35
2.1 Preface to the chapter ... 37
2.2 Measurement devices and experimental benches... 37
vi
2.2.2 The diffusion bridge measurement bench ... 38
2.2.3 Alterations in the cell ... 41
2.2.4 The developments made in the original bench ... 42
2.2.5 The wetting system: for permeability in presence of water ... 45
2.2.6 The real bi-polar plates of 25 cm2 ... 46
2.2.7 The real bi-polar plates of 100 cm2 ... 48
After presenting the devices and permeability measurement benches with the cells, the following description concerns the fuel cell performance test bench. ... 51
2.2.8 The fuel cell performance measurement bench ... 51
2.3 The GDLs used ... 54
2.4 Characterisation techniques and computer-based analysis ... 55
2.4.1 Chronopotentiometry (CP) ... 55
2.4.2 Scanning Electron Microscopy (SEM) for surface imaging ... 55
2.4.3 Mercury Intrusion Porosimeter (MIP) ... 56
2.4.4 Autodesk Interface ... 57
2.5 Data analysis approach ... 58
2.5.1 Lab-based study of GDL properties ... 58
2.5.2 Gas flow velocity in the cells used ... 58
2.5.3 Permeability estimations ... 61
2.6 Conclusion to the chapter ... 64
3.1 Preface to the chapter ... 67
3.2 The results obtained using the fundamental cell ... 67
3.2.1 Working conditions ... 67
3.2.2 Through-plane (TP) permeability estimation ... 68
3.2.3 In-plane (IP) permeability estimation ... 70
3.2.4 Permeability estimation for the MPL ... 73
3.3 The permeability results obtained using the real bi-polar plates ... 78
3.3.1 Working conditions ... 78
3.3.2 The equivalent permeability in the real bipolar plates (BPs) ... 78
3.3.3 The significance of the inertial flow and comparison between the cell patterns used ... 85
3.3.4 Comparison between 25 cm2 BPs with the fundamental cell... 87
3.3.5 Comparison of equivalent permeability between 25 cm2 multiple channels and 100 cm2 parallel flow channel. ... 92
3.4 Conclusion to the chapter ... 94
4.1 Preface to the chapter ... 97
vii
4.2.1 Working conditions for mixed dry gases ... 97
4.2.2 Directional and equivalent permeability estimations using mixed dry gases in the fundamental and 25 cm2 multi-channel cell. ... 99
4.2.3 Equivalent permeability in 25cm2 multi-channel BP with mixed gases ... 103
4.2.4 On the values for mixed gases in general ... 104
4.2.5 The validation of the pressure drop trend by imposing usage of different gases ... 107
4.2.6 Working conditions for humidified gases ... 115
4.2.7 Through-plane and in-plane permeability estimations using humidified gases ... 117
4.3 Permeability estimations in the presence of liquid water ... 122
4.3.1 Working conditions ... 122
4.3.2 Measuring the GDL capacities ... 122
4.3.3 Through-plane and in-plane permeability in the presence of liquid water ... 127
4.3.4 Through-plane permeability by forcing water through the MPL side of GDL ... 131
4.3.5 Permeability estimations with condensation approach ... 131
4.3.6 Comparison between wet and dry GDLs: tortuosity ... 133
4.4 Conclusion to the study ... 135
5.1 Preface to the chapter ... 138
5.2 Gas transport in GDLs under selected applied torque levels ... 138
5.2.1 The working conditions ... 138
5.2.2 Equivalent permeability values at selected applied torque levels ... 139
5.3 Electrochemical performance of GDLs under compression ... 141
5.3.1 Working conditions ... 141
5.3.2 Performance curves ... 142
5.4 Physical changes in the GDL morphology... 145
5.4.1 Thickness and surface morphology ... 145
5.4.2 Effect on the pore size distribution ... 147
5.5 Compression analysis of GDL ... 148
5.5.1 Young Modulus (E) for GDL... 149
5.5.2 For the simulations ... 151
5.5.3 The results for the different simulations on Autodesk Inventor ... 152
5.6 Conclusion to the chapter ... 158
General Conclusion ... 160
Recommendations ... 163
Reference ... 164
Appendix……….…..171
viii List of Figures
Introduction
Fig No Page No
Figure a Global carbon dioxide emission 1850-2050 3
Figure b The emergence of fuel cell technology with a depiction of domestic application
6
Figure c The PEMFC working 7
Figure d Components in a PEM fuel cell expanded view 8 Figure e The typical representation of the polarization curve for a PEM fuel cell 12 Figure f Defining of the scope from the general context 13
Chapter 1
Fig No Page No
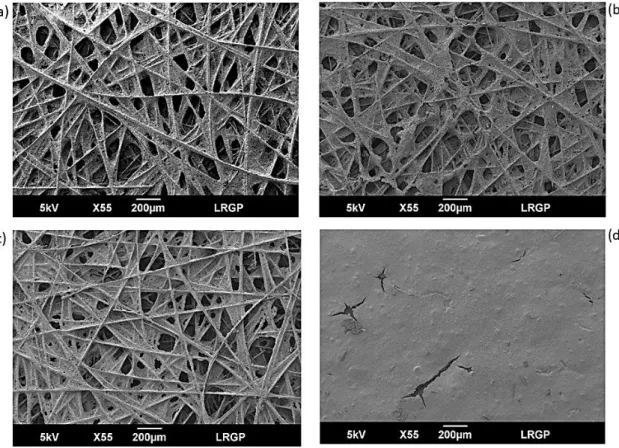
Figure 1.1 GDL manufacturing technique at SGL-Germany 19 Figure 1.2 SEM images taken at LRGP for GDLs (paper-based) procured from
SGL-Germany macroporous substrate side of (a) 24 BA (b) 24 AA (c) 38 BC and microporous side of (d) 24 BC
20
Figure 1.3 The classification of SGL-GDLs 23
Figure 1.4 The gas transport mechanism across the GDL 26 Figure 1.5 For a SGL- GDL (a) Anisotropy of fibers (b) Tortuosity 28 Figure 1.6 Compression SEM images of SGL GDLs (a) Surface of sample 24 BC
pre-compression, (b) Post compression and (c) Cross-sectional image of 24 BC showing rupture post-compression
31
Chapter 2
Fig.No Page No
Figure 2.1 The pictorial description of the fundamental cell designed and developed at the LRGP workshop.
38
Figure 2.2 (a) The ‘diffusion bridge’ technique for pressure drop measurement, and (b) The bench set up for fundamental cell at LRGP facility.
40
Figure 2.3 Modifications in the cell for temperature probe insertion made at the workshop
ix
Figure 2.4 (a) The modification in the existing ‘diffusion bridge’ with provision for (i) dry mixed gases, (ii) humidified gases, and (b) The bench after modification
44
Figure 2.5 (a-b) The wetting system from a commercial filtration system for wetting the GDL leading to (c) placement of wetted GDL in the fundamental cell.
45
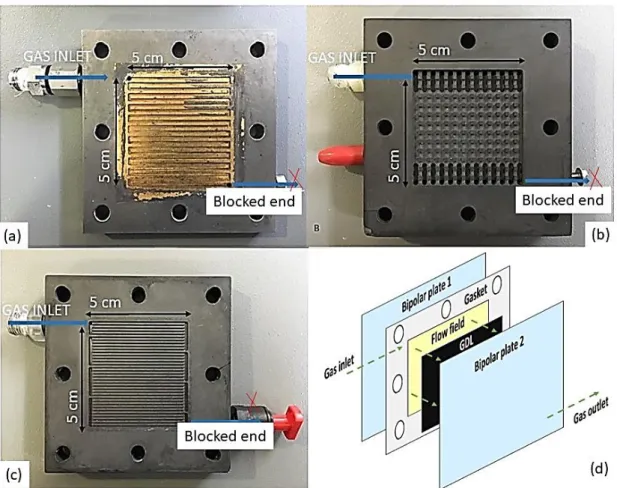
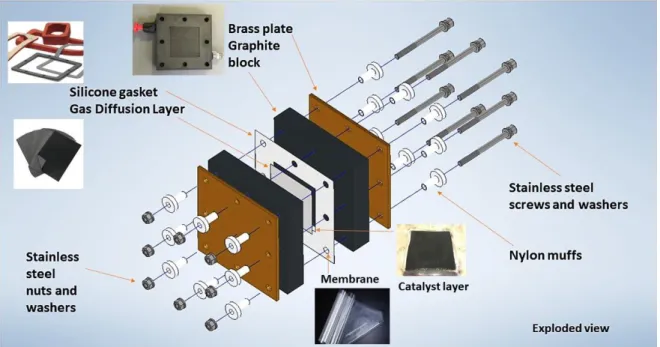
Figure 2.6 The 3 differently designed fuel cell plates (Electrochem) from the inlet side (1st chamber or BP 1) of 25cm2 active area, (a) Single channel, (b) square ribs and (c) multiple channels at LRGP (d) graphical image of BP assembly
47
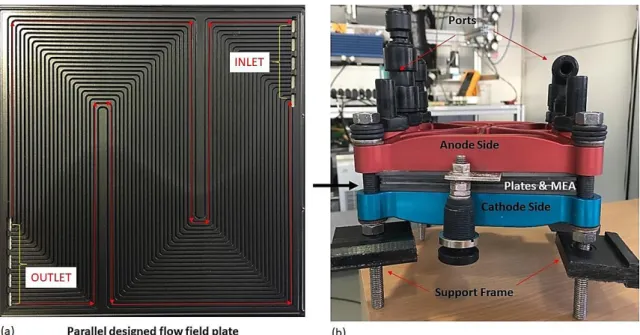
Figure 2.7 The 100 cm2 UBzM cell (a) The plate design and (b) the assembly of the cell at LRGP
48
Figure 2.8 Modification on the bench by replacing fundamental cell with BPs (a) 25 cm2 cell and (b) 100 cm2 cell
49
Figure 2.9 (a) The schematic for the fuel cell performance measurement and (b) The modified bench set up from the previously exiting bench. (Voltmeter was utilised only while setting up the cell and pump utilised only once for filling the humidifier)
52
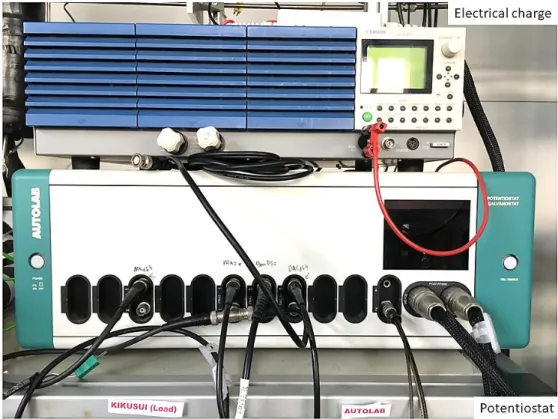
Figure 2.10 The Autolab Potentiostat at the bottom, and KIKUSUI (charge) on the top
53
Figure 2.11 (a-b) The SEM instrument at LRGP, (c) Sample surface image of a 38 BC GDL from the MPS side, and (d) Sample cross-sectional image of MEA with a 29 BC GDL
56
Figure 2.12 (a) The MIP instrument at LRGP and (b) Sample pore distribution graph of a Freudenberg GDL
57
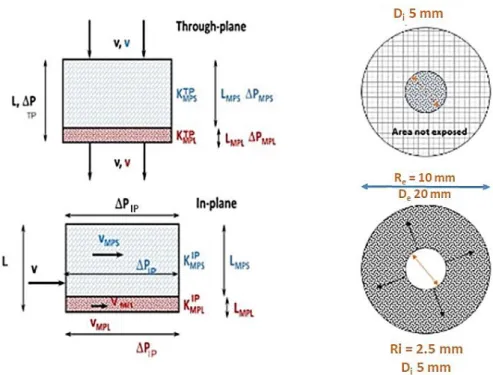
Figure 2.13 Schematic analysis for the through-plane and in-plane transports in GDLs used here
59
Figure 2.14 View of the fuel cell, in operation (a) or used for permeability measurements (b), and with the approach considered here (c) with uniform velocity v0.
61
Figure.2.15 The concept of linear trend (Darcy) and inertial forces at high velocity 63
Chapter 3
Fig.No Page No
Figure 3.1 Compressible pressure gradient vs average flow velocity (Through-plane) for (a) Non-MPL GDLs and (b) MPL based GDLs
68
Figure 3.2 Compressible pressure gradient vs average flow velocity (In-plane) for (a) Non-MPL GDLs and (b) MPL based GDLs
x
Figure 3.3 (a) The sectional view of the MEA showing each layer (b) cross-sectional image of 24 BC sample, and (c) representation of the ‘intersection layer’
76
Figure 3.4 (a) Compressible pressure gradient profile for non-MPL GDLs and (b) for MPL-GDLs (Single channel)
79
Figure 3.5 (a) Compressible pressure gradient profile for non-MPL GDLs and (b) for MPL-GDLs (Multiplr-channel)
80
Figure 3.6 (a) Compressible pressure gradient profile for non-MPL GDLs and (b) for MPL-GDLs (Sq. Ribs)
81
Figure 3.7 (a) Compressible pressure gradient profile for non-MPL GDLs and (b) for MPL-GDLs (UbzM)
83
Figure 3.8 Comparative bar charts depicting the fraction of inertial flow at 1 A/cm2 for the selected GDLs in the cells
85
Figure 3.9 Viscous permeability ratios 89
Figure 3.10 Equivalent permeability ratio 100 cm2/25 cm2 92
Chapter 4
Fig.No Page No
Figure.4.1 Pressure gradient vs average flow velocity TP trends in the fundamental cell
(a) 24 BC and (b) 38 BC samples
100
Figure.4.2 Pressure gradient vs average flow velocity IP trends in the fundamental cell (a) 24 BC and (b) 38 BC samples
100
Figure.4.3 Pressure gradient vs flow velocity trends (a) 24 BC and (b) 38 BC samples (Multi-channels)
103
Figure.4.4 Log differential intrusion vs pore size distribution for 34 BA and 34 BC observed at (a) low pressure and (b) at high pressure .
106
Figure.4.5 Compressible pressure gradient vs flow velocity profiles for the 4 single gases (a) 24 BC and (b) 34 BC
108
Figure 4.6 The permeability terms in a 24 BC-MPL considering the KTheo at 0.11 x 10 -13 m2 for the 4 gases, for the experimental and theoretical values
115
Figure.4.7 Compressible pressure gradient vs flow velocity for TP for RH levels (MPL GDLs) for (a) 24 BC and (b) 34 BC
118
Figure.4.8 Compressible pressure gradient vs flow velocity for IP for RH levels (MPL-GDLs) for (a) 24 BC and (b) 34 BC
xi
Figure. 4.9 The TP and IP profiles in non-MPL GDLs showing an increase with increasing RH level
119
Figure. 4.10 The (a) TP and (b) IP profiles in MPL-GDLs, comparison between the older and newer grades.
119
Figure 4.11 The representation of the fraction of water and gas in the used GDLs. 124 Figure. 4.12 The TP wet profiles in non-MPL GDLs and comparison with the dry case 127 Figure. 4.13 The TP wet profiles in MPL GDLs and comparison with the dry case 128 Figure. 4.14 The IP profiles in MPL GDLs and comparison with the dry case (a) 24 BC
and (b) 29 BC
128
Figure. 4.15 (a) The abnormal TP profile (b) water deposition inside the cell as seen after opening and (c) droplets formation along the gas carrying pipes.
132
Figure. 4.16 Tortuosity values for 2D configuration for wet and dry states (a)TP and (ii) IP
134
Chapter 5
Fig.No Page No
Figure 5.1 Compressible pressure gradient vs average flow velocity for GDLs showing the Darcy-Forchheimer trend obtained using the 25 cm2 bipolar plates at 1.5 Nm and 3.5 Nm (a) 24 BA and 24 BC (b) 28 BC and 38 BC
139
Figure 5.2 Comparison of fuel cell performance at 4 different applied torques (a) 24 BA without GDL with (b) 24 BC with GDL
142
Figure 5.3 Comparison of the MPL based GDLs at 4 different applied torques (a) 38 BC (b) 28 BC (c) 34 BC
143
Figure 5.4 Cell potential vs current density in a comparison between MPL based GDLs indicating the performance advantage of the selected –BC grades at 3.5 Nm
144
Figure 5.5 Surface images on SEM at a magnification of (x55 200 µm) (a) Substrate side of 28 BC before compression (b) Substrate side of 28 BC after compression (2.5 MPa) (c) MPL side of 38 BC before compression (d) MPL side of 38 BC after compression (formation of cracks) after 2.5 MPa. Cross-sectional images of (e) 24 BC with substrate side on top (f) 24 BC compressed
146
Figure 5.6 The Log differential intrusion vs pore size distribution (Low-pressure intrusion) for uncompressed and compressed MPS+MPL layer of (a) 24 BC sample (b) 34 BC
xii
Figure 5.7 The animated image of the 25cm2 Electrochem fuel cell assembly 148 Figure. 5.8 The consideration of applying frictionless constraint pre-simulation. 151 Figure 5.9 (a-b) Average clamping pressure on the GDL and gasket for (TGDL: 0.20
mm, EGDL: 20 MPa) and (TGasket: 0.20 mm EGasket: 30 MPa) (a) 1.5 Nm and (b) 2.5 Nm
153
Figure 5.9 (c-d) Average clamping pressure on the GDL and gasket for (TGDL: 0.20 mm, EGDL: 20 MPa) and (TGasket: 0.20 mm, EGasket: 30 MPa) (c) 3.5 Nm, and (d) 4.5 Nm
154
Figure 5.10 Average clamping pressure on the GDL and gasket at 3.5 Nm for (a) TGDL: 0.19 mm, EGDL: 15MPa, TGasket: 0.20 mm, EGasket: 30 MPa and (b) TGDL: 0.31 mm, EGDL: 20 MPa, TGasket: 0.20 mm, EGasket: 30 MPa
156
Figure 5.11 The trends of the clamping pressure at applied torques on the assembly (From Eqn 1.9 and 1.10) and on the GDL (simulations)
xiii List of Tables
Table No Table title Page No
Table 2.1 Description of the fuel cell plates 46
Table 2.2 The design features and clamping pressure in the various cells 50 Table 2.3 The selected commercial GDLs from SGL-Germany 54
Table 3.1 Working conditions 67
Table 3.2 The through-plane and in-plane viscous permeability values and comparison with available literature
72
Table 3.3 Through-plane permeability in the MPL exclusively for the –BC grade GDLs by deduction approach
75
Table 3.4 Highlights concisely the defined conditions for the measurements. 78 Table 3.5 The synthesis of obtained values of viscous and inertial permeability 84 Table 3.6 Comparison of values obtained in the 25 cm2 cells and the fundamental cell 91 Table 4.1 The working conditions using mixed dry gases 98
Table 4.2 Properties of gases 98
Table 4.3 Viscosity of the N2-H2 mixtures 99
Table 4.4 The through-plane and in-plane permeability for the single and mixed dry configurations
102
Table.4.5 Equivalent permeability using single and mixed gases 104 Table 4.6 Individual properties of the 4 gases used 107 Table 4.7 Working conditions for case validation using Ar and He 108 Table 4.8 Viscous through-plane permeability for 24 BC 109 Table 4.9 Estimated properties of the 4 gases from equations in literature 110
Table 4.10 Knudsen diffusivity in the –BC GDL 113
Table 4.11 Kapp , K (Darcy) and Knudsen term values for 24 BC 114 Table 4.12 Working conditions for the humidified gases 116
Table 4.13 Viscosity values at various RH level 117
Table 4.14 The directional permeability values for different RH levels and comparison to dry state.
121
Table 4.15 The working conditions in the case of the presence of liquid water 122 Table 4.16 The values of various properties of GDLs for dry and wet conditions are
estimated.
xiv
Table 4.17 The directional permeability in the presence of liquid water, losses in permeability and difference in porosity
130
Table 4.18 The Kv values for MPL reversal 131
Table 4.19 The constant values depending on the GDL structure and direction of flow 133 Table 5.1 The working conditions for pressure drop measurements 138 Table 5.2 Equivalent permeability of the selected GDLs 140 Table 5.3 The working conditions for the fuel cell performance 141 Table 5.4 The physical data of the components in the multichannel fuel cell 149
Table 5.5 The calculated E value for the GDLs 150
Table 5.6 The cases for this work 152
List of Abbreviations
AFC Alkaline electrolyte fuel cells BPs Bi-polar plates
BFM Binary fraction model
CP Chronopotentiometry
CL Catalyst layer
EU European Union
EIS Electrochemical impedence spectroscopy FEM Finitie element analysis
FC Fuel cell
FEP Fluorinated ethylene propylene GDL Gas diffusion layer
GHG Green house gases
G20 Great 20 nations
GE General Electric
IP In-plane
xv MMT Million metric tonnes
MDFC Direct methanol fuel cells MCFC Molten carbonate fuel cells MEA Membrane electrode assembly MPS Macroporous substrate
MPL Microporous layer
MIP Mercury intrusion porosimetry
NASA The National Aeronautics and Space Administration
OCED Organization for Economic Co-operation and Development PEMFC Proton exchange membrane fuel cell
PV Photovoltaic
PAFC Phosphoric acid fuel cells PTFE Polytetrafluoroethylene PFPE Perfluoropolyether
PFA Perfluoroalkoxy
PVDF Polyvinylidene fluoride R&D Research and development
RH Relative humidity
SOFC Solid oxide fuel cells
SGL Smart solutions in graphite and fiber composites SEM Scanning electron microscope
TP Through-plane
TS Tomadakis-Sotirchos model
xvi List of Symbols/Nomenclatures
A Total pore area m2/g
AreaGDL Area of GDL exposed to gas flow m2
BPArea Bipolar plate area m2
Db Bolt diameter m
D Diameter of the screw head m
D Effective diameter (on the flank) of a screw m
dp GDL pore diameter nm
𝐷𝐾 Knudsen diffusivity m2/s
EGDL Young modulus MPa
KMPL Viscous permeability in MPL m2
KMPS Viscous permeability in MPS m2
KGDL Viscous permeability of overall GDL m2
Kv FC Viscous permeability in real bi-polar plates m2
Kv Fundamental Viscous permeability in fundamental cell m2
Kn Knudsen number
Kapp Apparent viscous permeability m2
LMPL Length of MPL m
LMPS Length of MPS m
LGDL Length of GDL m
Mi Molecular weight of the ith gas component g/mol
Ngas Total moles of gas mol/s
Nvap Total moles of vapour mol/s
N Number of bolts in fuel cell assembly
P Power Watts
P Mean average of pressure bar
Ptotal Total pressure exerted in cell assembly MPa
P Thread of screw m
xvii
Pin Inlet pressure mbar
PTorque Stress applied
Pout Outlet pressure mbar
P(s)T Saturation vapour pressure kPa
P Mean average of pressure bar
𝑄̇ Flow rate NL/min
Q0 Flow rate of gas at T0 and P0 NL/min
R Resistance Ohms
Schannel Channel area for gas flow m2
Tapplied Torque applied Nm
T0 Ambient temperature °C TGDL Thickness of GDL m TGSK Thickness of gasket m Vtot Volume of GDL cm3 VL Volume of water cm3 VMPL Volume of MPL cm3
Vpores Volume of pores cm3
v0 Flow velocity of gas in through-plane direction m/s
vav,0 Average velocity of gas in the in-plane direction m/s
Xi Inertial factor
XLpores Pore filled fraction %
𝑦𝐻2𝑂 Molar fraction of the water vapour
xviii
𝜂
𝑚𝑎𝑥 Maximum efficiency for fuel cells %ΔG Gibbs free enthalpy kJ/mol
ΔH Heating vale or enthalpy kJ/mol
ɸ Porosity %
Ρ density kg/m3
specific weight kg/m2
Η Viscosity of gas Pa.s
Ω Cross-sectional area m2
𝜏 Tortuosity of porous media
ƞmix Viscosity of the gas mixture Pa.s
λ Mean free path of gas nm
𝛷𝐿 Volume fraction of water %
𝛷𝐺 Volume fraction of gas %
ɸ non compressed Porosity not compressed %
ɸ compressed Porosity compressed %
µpore Pore mean area m2
µd Fiber diameter m
xix List of Constants
Friction factor Kff 0.2
Friction coefficient in filets of a screw µ𝑡 0.2 Friction coefficient under the head of the screw on
washer
µℎ 0.2
Universal gas constant R 8.314 J/mol/K
Sutherlands constant C 111
Ambient pressure P0 101.32 kPa
Avogadro’s number Na 6.02 x 10²³/mol
Fiber arrangement in GDLs α (IP) 0.521, (TP) 0.785 ɛp 0.11
Co-efficient of variation in fiber Cl
Cd
0.4 0.08
1
General Introduction
A. Preface to the introduction ... 2 B. General context and global energy scenario ... 2
(i) The context of the energy transition ... 2 (ii) The global emission rates ... 3 (iii) The shift to renewable energy sources ... 4
C. Opportunity for hydrogen and the emergence of fuel cells ... 5
(i) Recognition of hydrogen ... 5 (ii) Emergence of the fuel cells ... 5
D. About proton exchange membrane fuel cells (PEMFCs) and the technology ... 7
(i) The PEM Fuel cell ... 7 (ii) Components of PEM fuel cells ... 8 (iii) Prospects and challenges of PEM fuel cells ... 10
E. Identifying the scope of the work and objectives ... 12
(i) The objectives identified are explained here as per their significance. ... 14 (ii) The layout of the thesis ………15
2
A. Preface to the introduction
At first, a general context about the global energy scenario is introduced. Additionally, the crisis caused by the collective carbon dioxide (CO2) emissions into the atmosphere so far has
also been discussed particularly for the European Union (EU). Following the general context, the potential of hydrogen as an alternate fuel, and the emergence of fuel cells are emphasized. Further, the study focuses on typical proton exchange membrane fuel cells (PEMFCs), where its potential scope and the existing limitations are discussed. Amongst several factors that are accountable for an efficient fuel cell performance, the significance of gas diffusion layers (GDLs) which serve as a critical component primarily aiding in gas transport inside the fuel cell is recognized and elaborated. Henceforth, an emphasis is made to study and investigate the gas transport in the GDLs that are commercially available.
B. General context and global energy scenario
(i) The context of the energy transition
The world is witnessing a transition from conventional energy sources to the non-conventional ones. The reason to justify this meaningful shift can be explained by two simple reasons. First, the world is slowly running out of natural resources (ex. fossils, coal, oil, natural gas, etc.) which are expected to last approximately 100 years from now. Second, the extensive use of conventional fuels over the years has led to massive emissions of pollutants and heat, thereby increasing the greenhouse gas (GHG) content in the atmosphere and consequently climate change [1-4]. Therefore, demand to address this challenge, and find alternative routes for energy generation which would be essentially non-polluting and sustainable has seen some unprecedented progress already. The global emission rates discussed in the next sub-section serve as a vital indicator in support of the largely required energy transition [5-9].
3
(ii) The global emission rates
The global emission rates, particularly of carbon dioxide (CO2), have been staggering over the
last decade (2010-2020) with an addition of approximately 5000 million metric tonnes (MMT; a unit often used to describe CO2 equivalent in climate change documentations) alone.
Understandably, with the influx of industrialization (for example, manufacturing sectors or power generation sectors), besides rapid expansion in the automobile sector, domestic emissions from generation sets, constructions, air-conditioning systems, the emissions are uncontrollably on the rise and hence, the projection for the next decade (2020-2030) does not appear to be in the right interest of bio-diversity. Further, an addition of approximately 3500 MMT of carbon dioxide is expected during this current phase as shown in Figure a [6- 11].
Figure a. Global carbon dioxide emission 1850-2050. [1,2]
Also, as represented by the ‘Organization for Economic Co-operation and Development’ (OCED), the various sources of carbon dioxide in the EU were identified over the last few years. It was implicit that sectors like ‘Energy’ and ‘Manufacturing’ alone contributed more than 50% of the overall emissions. However, household and transportation sectors, which are domestic, contributed just over more than 30-40% to the overall tally. As a result, it can be concluded that these consequences, are justifiably unsafe and thus are largely affecting the overall bio-diversity, in other words creating a severe imbalance in the ecosystem. Since,
4 having realized the repercussions that the world is already facing today, and is expecting the worse, the transition in making a collective shift to renewable energy sources can, therefore, be justified as further explained in the following sub-section [7-14].
(iii) The shift to renewable energy sources
The global energy scenario is presently undergoing a strong disparity, mostly concerning energy access and use. The global energy demand tends to increase by the day, which is stated to be approximately 1.3% every year until 2040. The policies governing the energy dynamics are an exclusive affair for the countries, where policies to address energy-saving and rural electrification have been focussed upon. While few countries have been found to follow stricter rules, many are yet to configure the issues at hand. The sustainable development goals laid out are to be met, requiring an impetus and widespread awareness. Hence, for that reason, the promotion and implementation of renewable sources are now being widely recognized and implemented [14-16].
The last decade has witnessed a strong growth in the deployment of renewable energy systems. Essentially with policy-driven frameworks established by levying high subsidies for Photovoltaic (PV) systems, the deployment has so far faired well. A remarkable implementation of renewable energy sources (wind, solar PV, bioenergy, small hydro, and others) was seen in China and is expected to reach 81 % of their target by 2040 as per their stated policy scenario of emission control targets. The European Union is expected to reach 79 % out of its proposed deployment. However, the implementation of the renewables has struggled to pick up in the basic end-use sectors like small scale industries, buildings, the auto sector that is essentially on the domestic front [12-16].
Therefore, it can be said that since the larger struggle for renewable energy deployment has been witnessed in the domestic front, small scale or indigenous power generation can prove to be beneficial if done appropriately. Such small scale power generation systems like that of the ‘fuel cells’ can categorically make a crucial contribution to the alternative energy sector.
5
C. Opportunity for hydrogen and the emergence of fuel cells
As mentioned previously, with renewable energy gaining momentum, and to further intercept the domestic front, the importance of hydrogen fuel cells is already being accepted and is used.
(i) Recognition of hydrogen
Hydrogen is seen as one of the potential sources of alternate energy which would eventually gain a footprint stretching from the industrial sector to the domestic segment. The prospect of hydrogen as fuel was being exploited over the last 2 decades vigorously, however, ‘The government of Japan’ under its G20 presidency in 2019 offered to explain the unprecedented political and business momentum hydrogen as an energy carrier can have. With a suggestion to decarbonize the industrial sectors, and make it a viable source to power homes, fuel commercial vehicles, hydrogen needs to be established for a role under long-term energy strategies. This has served as an eye-opener for many energy enthusiasts across the globe. Though full-fledged commercialization of hydrogen as a suitable energy source suffers from limitations, mainly concerning its production (which is not a clean process) and storage (storage pressure points and capacity development), nevertheless an increase in the deployment is at least expected in the next decade [11-15].
Few crucial pathways that can help hydrogen to get familiarised are by ; (1) addressing the investment risks, (2) eliminating the unnecessary regulatory barriers, (3) providing necessary support to R&D in cost-cutting, (4) engaging internationally to harness opportunities and track progresses made with time, (5) identifying and implementing easier hydrogen production routes and (6) developing strong transport and storage pathways [14-15].
(ii) Emergence of the fuel cells
Having acknowledged the potential of hydrogen as a crucial source of energy, bringing it to use was essentially designed for example in fuel cells. The emergence of fuel cells, however, dates back to the 19th century, precisely in 1839 when Sir William Grove invented ‘gas battery’ or the first fuel cell. Later, in the century in 1889, Charles Langer and Ludwig Mond further developed Grove’s invention and called it “fuel cell”. Thus, started the timeline of fuel cells and their consequent evolution is shown in Figure b. During the 1950s General Electric (GE) developed the proton exchange membrane fuel cell. During the 1960’s NASA first used fuel cells for their space missions [10-12].
6
Figure b. The emergence of fuel cell technology with a depiction of domestic application [10]
With an impetus to develop fuel cells, the technology has seen some considerable advances. Various types of fuel cells can be used depending on the desired application. Fuel cells are classified based on the electrolyte used as well as the temperature they operate at.
There are six principal types of fuel cells. (i) Alkaline electrolyte fuel cells (AFC), (ii) proton-exchange membrane fuel cells (PEMFC), (iii) direct methanol fuel cells (MDFC) operate at low temperatures between 50-100°C, (iv) Phosphoric acid fuel cells (PAFC) operate in the medium temperature range around 200°C, (v) Molten carbonate fuel cells (MCFC) and (vi) solid oxide fuel cells (SOFC) operate in the high-temperature range from 600-1000°C. Different fuels are used for different FCs nevertheless, H2 remains to be the most common.
Recently, biological fuel cells like enzymatic (up to 10 mV/cm2) or microbial fuel cells (0.01 mV/cm2) are becoming more important essentially because of the constant progress that is being made in the direction of improving fuel cell systems. Nonetheless, other advances concerning catalyst or cell design features are simultaneously progressing [12-14].
7
D. About proton exchange membrane fuel cells (PEMFCs) and the
technology
Though significant studies are continuously contributing to the establishment of fuel cells as a feasible source of energy, this present work explicitly discusses the proton exchange membrane fuel cells (PEMFCs) or the PEM fuel cells with the focus on its component the ‘GDL’.
(i) The PEM Fuel cell
Proton-exchange membrane fuel cells (PEMFCs) have been one of the most promising types of fuel cells for commercial implementation. PEM fuel cells also called, polymer electrolyte membrane fuel cells are emerging energy devices for the future, which leverages its technology from the fundamentals of energy conversion and electrochemistry [11-13].
Figure c. The PEMFC working
In PEM fuel cells, there are 2 chambers: (i) the anode and (ii) the cathode and an electrolyte at the center generally surrounded by platinum-containing electrodes. Hydrogen (H2) is fed from
the anode side where electrons are separated from the protons on the surface of the platinum-based catalyst, further the protons pass through an ionomeric membrane to the cathode side, whereas the electrons travel in an external circuit generating an electrical output from the cell. On the cathode end, the electrode combines the protons and electrons with incoming oxygen
8
to produce water, which is expelled as the only waste product as shown in an illustrative depiction in Figure c.
(ii) Components of PEM fuel cells
The components of a typical PEMFC are shown here in Figure d. Since PEMFCs are in general Polyfluorosulphonated polymer-based and are low temperature operating fuel cells (60-80°C), all components are selected or designed depending upon the limits of operating temperature. PEMFCs are made up of several components assembled. The heart of the PEMFC is the membrane electrode assembly (MEA). This MEA comprises (i) the membrane, (ii) the two catalyst layers, and (iii) the gas diffusion layers.
Figure d. Components in a PEM fuel cell expanded view
The membrane; The polymer electrolyte membrane is commonly made of Nafion ®, which is a sulfonated tetrafluoroethylene based fluoropolymer. The membrane conducts positively charged ions and disallows the electrons, ensuring only necessary ions to pass between anode and cathode. The flux of H2 or other gases through the membrane has to be as low as possible
and the water present in the membrane remains in the liquid state. Generally, the membranes are thin with thicknesses around 20 micrometers to limit the energy loss caused by the Joule effect given in Eqn 1.1 as,
9 𝑃 = 𝐼2𝑅 (1.1)
Where, P: Power in Watts, I: current in Amperes, and R: resistance in ohms, caused by the finite conductivity of the ionomer [13].
Catalyst layer (CL); A layer of catalyst is applied on either side of the membrane i.e anode and cathode facing respectively. Presently, most conventional catalyst layers have nanometer-sized particles of platinum dispersed on a high-surface-area carbon support. This supported platinum catalyst is usually mixed up with an ion-conducting polymer (ionomer) and is sandwiched between the membrane and the gas diffusion layers. At the anode end, the deposited platinum allows hydrogen molecules to be split into protons (H+) and electrons (e-). At the cathode end, the catalyst allows oxygen reduction by reacting with the protons and the electrons generated at the anode side, thereby producing water as shown previously in Figure c [25].
Gas diffusion layers (GDLs); The GDLs are placed between the bipolar plates and the catalyst layer on either side i.e facing anode and cathode separately. These layers are porous which allows the reactants to pass from the flow channels to the catalyst layer. These layers are electrically and thermally conductive. Usually made from carbon paper or cloth sheets, they are often coated with a hydrophobic polytetrafluoroethylene (PTFE) as this allows ease in the removal of water buildup inside the cell. With the latest developments, these GDLs are now being additionally coated with a thin layer of high-surface-area carbon-containing PTFE called as a microporous layer (MPL), which supposedly is aimed at maintaining a water balance inside the cell, and avoid water flooding [21-39]. This component will be largely presented in
Chapter 1.
The bi-polar (distribution) plates (BPs); Generally, the size and design of bi-polar plates are known to vary depending upon the use. Their main function is to allow even distribution of the reactant gases from the inlet pipes towards the catalyst layer through the GDL. These plates, which are made of either metal structures, graphite, or carbon-based composites provide electrical conduction and also serve as a means for providing physical strength to the assembly.The plates also needs to be chemically inert and resistant against corrosion. The internal surface of these plates is designed with the ‘flow pattern’ which is usually the set of channels machined or stamped onto the plate that provides access to the reactant gases to flow
10 along the channels and further transport across the GDL to the catalyst layer (CL). In many cases, additional plates or channels on either side of the BPs may be used for the circulation of coolant [25-33,54-57].
The gaskets; The gaskets or seals, basically are used to provide sufficient tightness, by eliminating possible leakages between the various plates. The seal selection requires careful consideration, as it is placed under stringent operating conditions. Ideally, seals should show good stability, be non-reactive, and resistant to compression, shock, and vibrations. The most commonly used seals are made from silicon. A few of the many advantages that it offers are considerable compressibility and cost-effectiveness [13,20].
Other features; Some of the other relevant features include the electrical connections, wires, gas pipes connected to ports, heating plates and cooling plates, and finally bolts and screws for assembling. All these features largely depend upon the scale of set-up and, the robustness of the system [13,24].
(iii) Prospects and challenges of PEM fuel cells
Prospects of PEM fuel cell generally relies upon the consistency with which it can perform. Now, that takes into account the overall efficiency of the system. PEM fuel cells, in its course of evolution, if commercialized completely, can prove to be an excellent alternative for commercial vehicles along with battery-powered vehicles. Similarly, stand-alone systems can make a way, by replacing diesel-powered generation sets for domestic applications. The development of the technology, along with creating a robust infrastructure with refueling stations, hydrogen storage, transportation, could well be an opportunity starting from the present and leading to the future, to offset conventional systems. For instance, ‘Fuel Cells and Hydrogen Joint Undertaking-EU’ has mentioned one of the pivotal aims is addressing emissions, as it is projected to have the highest growth rate in the automotive fuel cell market causing energy transition and account for 24% of final demand by 2050 in the EU [3-7,15].
11 One of the major challenges with fuel cells is improving its energy efficiency which currently is estimated to be around
𝜂
𝑚𝑎𝑥(
40-60%), at the cell level i.e. feed with pure H2 and obtain adirect current, from the general estimation, made using the value of Gibbs free enthalpy (ΔG) and the heating vale or enthalpy (ΔH): the maximum or ideal efficiency is the ratio stated by the Eqn 1.2 Mench 2008 [17]:
𝜂
𝑚𝑎𝑥=
𝛥𝐺𝛥𝐻 (1.2)
However, the performance is known to be affected from the start of the operation, and further during the stretch of the operational period the performance declines. The challenges concerning the PEM fuel cell can be classified into 2 categories ;
Challenges related to the technology; The losses in a typical PEM fuel cell are described under the following categories Figure e ;
(a) Activation; where a certain proportion of energy is needed to allow the occurrence of electrochemical reaction. This phenomenon produces a non-linear voltage drop called activation polarization. These losses occur on both anode and cathode catalysts, though anode overpotentials are usually very low with hydrogen as fuel.
(b) Ohmic; The resistance to (i) the flow of electrons through the electrically conductive fuel cell components and (ii) to the flow of ions through the membrane causes a voltage drop, which can be expressed as Ohmic drop.
(c) Mass transport; The consumption of reactant gases at the catalyst layers leads to concentration gradients and thus changes the partial pressure of the reactants, which affects the fuel cell voltage.
The above 3 regions of cell performance are valid for any operating range of applied current
Figure e. The fuel cells are prone to severe degradations of its parts like MEA and its related components. Degradations are largely caused in its due course of operational hours, depending on the operating conditions like pressure, temperature, flow rates, and humidity of reactants to name a few. Wearing out and weakening of parts is normally observed throughout the operation
12
Figure e. The typical representation of the polarization curve for a PEM fuel cell
Challenges related to commercialization; PEM fuel cells need to be developed in pursuit of being competitive with the already established energy sources. Under the banner of ‘green energy’, fuel cell needs a positive thrust to address the larger sections of the market who demands energy. Costs involved in hydrogen production and its subsequent transportation and storage still need an impetus. Further, costs related to installation and maintenance too, need a structured reform before making the technology completely viable [15,17].
E. Identifying the scope of the work and objectives
From the various crucial components mentioned before in Section D (ii), the gas diffusion layers remain to be one of the most crucial components in the fuel cell. The main area of focus in this present research is on the GDL. Hence, the narrowing down from a larger perspective until purpose identification is shown in Figure f.
13
Figure f. Defining of the scope from the general context
In addressing the limitations in the region on ‘concentration polarization’, as mentioned previously in Section D, this study deals with the investigation of the gas transport phenomena through the gas diffusion layers in PEMFC. The work is aimed to compare the transport rate in terms of permeability of a GDL to gases, depending on whether the gas is flowing perpendicular to the layer (through-plane-TP) or more along the fiber direction (in-plane-IP). The present approach used in the study relies on various sources of experimental observations to understand and characterize these transport fluxes in the GDL in view of obtaining a phenomenological formalism.
Limitations from existing literature were carefully considered, where obscurity in the representation of the gas transport could be recognized. In most of the cases, permeability through the GDLs is either measured using indigenously designed devices or has been discussed by modeling and simulation approach. Few of the selected works have been reported later in (Section 1.3). Under the scope of this present work, what has been done differently is performing the gas transport measurements by referencing more to the actual working conditions like that in a fuel cell. For doing so, the objectives that have been addressed here are given:
14
(i) The objectives identified are explained here as per their significance.
The estimation of directional permeability in the GDLs (Ex-situ) in the fundamental cell: Design and development of a measurement device: “fundamental cell” (at LRGP
workshop) that enables pressure drop measurement across commercial GDLs from (SGL-Germany) in the through-plane and in-plane directions independently.
Estimation of directional permeability (TP and IP) by employing Darcy’s law, with the use of single dry gas.
Estimation of directional gas permeability exclusively for the microporous layer in the MPL-based GDLs.
Additionally, reflecting on the real conditions that occur in the fuel cell, the through-plane and in-through-plane permeability estimations for the following cases: (a) mixed dry gases, (b) humidified gases, and (c) forcing dry gas in the presence of liquid water in GDLs.
The estimation of permeability in the GDLs (Ex-situ) in real bi-polar plates:
Stacking GDLs, in the (i) three differently designed bi-polar plates of 25cm2
(Electrochem) and using single dry gas and later mixed dry gases, and then in (ii) 100 cm2 (UBzM) cell using single dry gas, only for transport measurements in the two
cases mentioned above. The intent here is to represent a realistic scenario of gas transport like that of actual fuel cell operation (without current connections).
Estimating permeability using the fundamental laws relating pressure gradient to gas velocity (Darcy-Forchheimer), for all the GDLs investigated, and comparing the values obtained with the fundamental cell.
The effect of compression on gas transport and relation fuel cell performance:
To understand the effect of compression on the GDL and its consequence on the gas transport, for which three different approaches were proposed. (a) ex-situ measurement of gas transport using real bi-polar plate at different applied torques, (b) in-situ fuel cell performance measurements at different applied torque levels, to account for a suitable operating torque, and to (c) a software-based simulation study to depict the pressure distribution on the GDLs.
15
(ii) The layout of the thesis
Chapter 1: State-of-art
This chapter will deal mainly with GDL, starting with the manufacturing process of its layers such as MPS and MPL, to properties such as porosity, permeability, tortuosity, and mechanical strength. It also discusses the theory of gas transport in these layers. Then, a summary of previous studies on gas transport from the available literature is discussed. This essentially allows us to find the various gaps related to the previous works and opens the possibilities that have been made in this work.
Chapter 2: Materials and methodology
This chapter opens with an overview of the different devices used for measuring gas transport. The internally designed cell (at the lab), derived from the work in the literature for the measurement of directional permeability, focussing on its uniqueness. Besides, real bipolar plates for gas transport measurements of different patterns and sizes are presented. Then, the different experimental benches developed throughout the work are described. Finally, the different microscopic and electrochemical characterizations and the approach adopted for data analysis are explained.
Chapter 3: Measurement of gas transport in GDL using the fundamental device and bipolar plates
In this chapter, the first set of results performed with pure and dry gas is presented and explained. Measurements of directional permeability (in-plane and through-plane) are carried out in the fundamental cell and are validated using the available literature. Then, the values of equivalent permeability obtained between the bipolar plates are determined, and a comparison with those obtained in the fundamental device is made.
Chapter 4: Gas transport measurements in the GDL for mixed, humidified gases and in the presence of liquid water
In this chapter, the gas transport measurements have been carried out trying to relate to conditions closer to reality with the use of mixed gases, humidified gases, and in the presence of liquid water, carried out in the fundamental cell. This chapter also tries to explain the different results obtained during the tests and to reflect on the different factors that affect the overall gas transport.
16 Chapter 5: Gas transport measurements in GDL under compression and electrochemical performance of fuel cell
In the last chapter of the thesis, measurements of the transport of gas under compression and its relation to the performance of the fuel cell were carried out. Besides, modeling and software simulation was carried out to predict the impact of compression on GDL.
17
Chapter 1
State-of-Art
1.1 The gas diffusion layer (GDLs) ... 18 1.1.1 The role of GDLs ... 18 1.1.2 GDL Manufacturing ... 18 1.1.3 Macro porous substrate (MPS) ... 19 1.1.4 Microporous layer (MPL) ... 20 1.1.5 Hydrophobic and hydrophilic treatments in GDLs ... 22 1.1.6 SGL nomenclature for the GDLs manufactured ... 22
1.2 Characteristics of GDLs ... 23 1.2.1 Porosity of GDLs ... 23 1.2.2 Gas permeability in GDLs ... 24 1.2.3 Anisotropy and tortuosity in GDLs ... 26 1.2.4 Structural strength of GDLs and clamping action in the cell assembly ... 27 1.2.5 Degradations in GDLs ... 29
1.3 Synthesis of few selected work in gas transport measurement and compression in GDLs .... 31
18
1.1 The gas diffusion layer (GDLs)
The gas diffusion layer is discussed in this section emphasizing on the available literature.
1.1.1 The role of GDLs
For the fuel cell to yield ideal performance, the reactant gases must be able to travel along the GDLs and involve in the electrochemical reaction at the catalyst layer. In brief, the main role of GDLs can be listed as;
(i) to regulate or efficiently distribute reactant gases to the catalytic layer by allowing the gases to transfer from the channels to the catalyst layer.
(ii) to provide structural support to the overall MEA, by providing backing to the membrane and catalyst layer.
(iii) to optimize water content within the MEA by balancing in driving away excess water accumulated during continuous operation, and retaining some amount, and (iv) to conduct charges in and out from the cell to the current collector plates.
All of these together improve fuel cell performance and can also increase the cell's structural lifespan. Having listed the significance of GDLs in PEM fuel cell performance, the next part discusses the manufacturing of these GDLs [17-25].
1.1.2 GDL Manufacturing
GDL manufacturing is an independent process followed by manufacturers (E.g. SGL or Freudenberg in Germany) which are essentially confidential owing to the fact of company privacy. However, a basic outline is often provided by manufacturers to give an overview of the operations that are undertaken in the manufacturing process of these diffusion layers [26].
Since, in this work, commercial GDLs manufactured by SGL-Carbon, Germany were broadly used, therefore their basic manufacturing steps are highlighted. The process gives an overview of the method and the procedures presented in Figure 1.1.
19
Figure 1.1 GDL manufacturing technique at SGL-Germany [26]
The gas diffusion layer (GDL) is normally categorized into (i) the macroporous substrate (MPS) and (ii) the macroporous substrate and microporous layer (MPL). Figure 1.1 shows the basic outline maintained in the manufacturing of MPS+MPL base GDLs. The description of MPS is explained first.
1.1.3 Macro porous substrate (MPS)
The MPS comes in two forms: carbon paper and carbon cloth. Carbon paper MPSs are typically thinner than carbon cloth [26]. Normally a carbon paper is generalized as carbon-carbon composite. In this, the fibers making up the region are oriented with randomly dispersed carbon fibers with an average diameter of 8-9 μm [19]. These carbon fibers, are produced from polyacrylonitrile pyrolysis and are assembled in various forms. In carbon paper-based GDLs, the fibers are bound in a plane structure by using binding material like polyvinyl alcohol. Thereafter, it is infused in resin to consolidate the overall structure. After this, the entire batch is subjected to heat treatment at an elevated temperature of 2000°C, for the carbonization of the matrix. The carbon felts in the strata are usually found to be non-planar and hence a heat treatment is carried out at a lower temperature. The MPS layers are generally 180-400 μm in thickness and have high porosity (80% or above). Essentially the pores in this structure range between 10-30 μm, and 20-100 μm, and the surface images are shown in Figure 1.2 a,b and c .
20 The physical structure of the layer is usually characterized and explained in terms of (i) porosity, (ii) pore size distribution, (iii) thickness, (iv) gas path lengths, and (v) structural strength [61,98]. These properties changes or are otherwise affected when they are placed under operation inside a fuel cell. In dealing with the water accumulation in the cell, and the consequent flooding, advancements in the GDL were made by adding a layer called as the microporous layer (MPL) on the existing substrate [18]. The MPL is described in the next Sub-section 1.1.4.
Figure 1.2 SEM images taken at LRGP for GDLs (paper-based) procured from SGL-Germany macroporous substrate side of (a) 24 BA (b) 24 AA (c) 38 BC and microporous side
of (d) 24 BC
1.1.4 Microporous layer (MPL)
To improve the performance of the fuel cell dealing with water flooding issues, the MPL is added to the GDL to increase the functionality and durability of the layer. The MPL can be well described as either a simple composite of carbon powder and a hydrophobic agent (PTFE) or a combination of C particles, graphitized resins, and PTFE, most of them with a tailored hydrophobicity depending on the targeted application. MPL is a layer but is not distinct in
21 nature (sprayed or coated). The MPL comprises minimal carbon powder and hydrophobic agent agglomerates, with pore sizes in several orders of magnitude lower than the substrate (2-200 nm) whose surface is shown in Figure 1.2 d. Generally, MPL is manufactured by normally following three steps; (i) MPL slurry preparation, (ii) MPL deposition, and (iii) sintering
[27- 30] .
In the first two stages, the carbon or graphite particles are mixed mechanically with hydrophobic agents dispersed in water or sometimes organic additives, and this slurry is deposited onto the MPS surface. The deposition technique may vary consisting of either; brushing, blading, spraying, or dipping. However, recently after having understood the several advantages of the MPL, this layer is prepared separately in some facilities which are further assembled onto the existing substrate [18,27]. However, the former technique has shown better adaptability compared to the latter one. Post completion of the MPL deposition, the entire GDL sheet is subjected to heat-treatment, normally at 240-250°C, for around 40-50 minutes under an inert atmosphere. This is done to remove any unnecessary moisture. The fully dried out GDL is now sintered at a higher temperature (350-400°C), for 40-60 minutes, to ensure that the hydrophobic agent is dispersed completely throughout the MPL [18,27].
The MPL provides the GDLs with several advantages over the non-layered ones ; (i) restricted but uniform gas distribution to the catalyst layer, (ii) improved interfacial interactions and mechanical compatibility between the catalyst layer and the substrate, (iii) reduced water accumulation by having strong hydrophobicity [18,25-30].Though MPL gives advantages, it also generates an additional layer ‘intersection’ or ‘penetration’ layer which can often be complex due to the deployment technique.
Intersection region between MPS and MPL
The smaller agglomerates of the MPL can easily occupy the larger pores on offer from the MPS, leading to the formation of the intermediate layer. This surface penetration is usually caused by (i) specification of the carbon powder, (ii) presence of hydrophobic agent, (iii) deposition of MPL slurry, and (iv) manufacturing process. This mixing causes, the pore size distribution to significantly get compromised (lowering), and thus may pose a greater resistance to the flow of gas. No definite range of pore size and thickness of this intersection is known. However, often by using cross-sectional images using SEM, attempts have been made to at least identify the region.
![Figure a. Global carbon dioxide emission 1850-2050. [1,2]](https://thumb-eu.123doks.com/thumbv2/123doknet/14547759.725480/27.892.123.761.499.849/figure-a-global-carbon-dioxide-emission.webp)

![Figure 2.1 The pictorial description of the fundamental cell designed and developed at the LRGP workshop [52]](https://thumb-eu.123doks.com/thumbv2/123doknet/14547759.725480/62.892.123.788.223.523/figure-pictorial-description-fundamental-designed-developed-lrgp-workshop.webp)