RESEARCH OUTPUTS / RÉSULTATS DE RECHERCHE
Author(s) - Auteur(s) :
Publication date - Date de publication :
Permanent link - Permalien :
Rights / License - Licence de droit d’auteur :
Bibliothèque Universitaire Moretus Plantin
Institutional Repository - Research Portal
Dépôt Institutionnel - Portail de la Recherche
researchportal.unamur.be
University of Namur
Towards more predictive and interdisciplinary climate change ecosystem experiments
Rineau, Francois; Malina, Robert; Beenaerts, Natalie; Arnauts, Natascha; Bardgett, Richard
D.; Berg, Matty P.; Boerema, Annelies; Bruckers, Liesbeth; Clerinx, Jan; Davin, Edouard L.;
De Boeck, Hans J.; De Dobbelaer, Tom; Dondini, Marta; De Laender, Frederik; Ellers,
Jacintha; Franken, Oscar; Gilbert, Lucy; Gudmundsson, Lukas; Janssens, Ivan A.; Johnson,
David; Lizin, Sebastien; Longdoz, Bernard; Meire, Patrick; Meremans, Dominique; Milbau,
Ann; Moretti, Michele; Nijs, Ivan; Nobel, Anne; Pop, Sorin; Puetz, Thomas; Reyns, Wouter;
Roy, Jacques; Schuetz, Jochen; Seneviratne, Sonia I.; Smith, Pete; Solmi, Francesca; Staes,
Jan; Thiery, Wim; Thijs, Sofie; Vanderkelen, Inne; Van Landuyt, Wouter; Verbruggen, Erik;
Witters, Nele; Zscheischler, Jakob; Vangronsveld, Jaco
Published in:
Nature Climate Change
DOI:
10.1038/s41558-019-0609-3
Publication date:
2019
Document Version
Peer reviewed version Link to publication
Citation for pulished version (HARVARD):
Rineau, F, Malina, R, Beenaerts, N, Arnauts, N, Bardgett, RD, Berg, MP, Boerema, A, Bruckers, L, Clerinx, J, Davin, EL, De Boeck, HJ, De Dobbelaer, T, Dondini, M, De Laender, F, Ellers, J, Franken, O, Gilbert, L,
Gudmundsson, L, Janssens, IA, Johnson, D, Lizin, S, Longdoz, B, Meire, P, Meremans, D, Milbau, A, Moretti, M, Nijs, I, Nobel, A, Pop, S, Puetz, T, Reyns, W, Roy, J, Schuetz, J, Seneviratne, SI, Smith, P, Solmi, F, Staes, J, Thiery, W, Thijs, S, Vanderkelen, I, Van Landuyt, W, Verbruggen, E, Witters, N, Zscheischler, J & Vangronsveld, J 2019, 'Towards more predictive and interdisciplinary climate change ecosystem experiments', Nature Climate
Change, vol. 9, no. 11, pp. 809-816. https://doi.org/10.1038/s41558-019-0609-3
General rights
Copyright and moral rights for the publications made accessible in the public portal are retained by the authors and/or other copyright owners and it is a condition of accessing publications that users recognise and abide by the legal requirements associated with these rights. • Users may download and print one copy of any publication from the public portal for the purpose of private study or research. • You may not further distribute the material or use it for any profit-making activity or commercial gain
1
Improving the predictive power and interdisciplinarity of climate change experiments
1 2
Francois Rineau 1*, Robert Malina 2, Natalie Beenaerts 1, Natascha Arnauts 1, Richard D. Bardgett 3, 3
Matty P. Berg 4,5, Annelies Boerema 6, Liesbeth Bruckers 7, Jan Clerinx 1, Edouard L. Davin 8, Hans J 4
De Boeck 9, Tom De Dobbelaer 10, Marta Dondini 11, Frederik De Laender 12, Jacintha Ellers 4, Oscar 5
Franken 4, Lucy Gilbert 13, Lukas Gudmundsson 8, Ivan A. Janssens 9, David Johnson 3, Sebastien 6
Lizin 2, Bernard Longdoz 14, Patrick Meire 6, Dominique Meremans 6, Ann Milbau 10, Michele 7
Moretti 2,15, Ivan Nijs 9, Anne Nobel 2, Sorin Pop 16, Thomas Puetz 17, Wouter Reyns 1,12, Jacques 8
Roy 18, Jochen Schuetz 16, Sonia I. Seneviratne 8, Pete Smith 11, Francesca Solmi 7, Jan Staes 6, Wim 9
Thiery 8,19, Sofie Thijs 1, Inne Vanderkelen 19, Wouter Van Landuyt 10, Erik Verbruggen 9, Nele 10
Witters 2, Jakob Zscheischler 8,20,21, Jaco Vangronsveld 1, 22 11
* Corresponding author: Francois Rineau, Environmental Biology, Centre for Environmental Sciences, 12
Hasselt University, Diepenbeek, Belgium. Email: francois.rineau@uhasselt.be 13
14
1Hasselt University, Environmental Biology, Centre for Environmental Sciences, Agoralaan Gebouw 15
D, 3590 Diepenbeek, Belgium 16
2 Hasselt University, Environmental Economics, Centre for Environmental Sciences, Agoralaan 17
Gebouw D, 3590 Diepenbeek, Belgium 18
3 The University of Manchester, School of Earth and Environmental Sciences, Michael Smith Building, 19
Manchester M13 9PT, UK 20
4 Vrije Universiteit Amsterdam, Department of Ecological Science, De Boelelaan 1085, 1081HV 21
Amsterdam, The Netherlands 22
5 Groningen University, Groningen Institute for Evolutionary Life Science, Community and 23
Conservation Ecology Group, Nijenborgh 7, 9747AG Groningen, The Netherlands 24
6 University of Antwerp, Ecosystem Management research group (ECOBE), Universiteitsplein 1C, 25
2610 Antwerp, Belgium 26
2 7 Hasselt University, Interuniversity Institute for Biostatistics and Statistical Bioinformatics, Agoralaan 27
Gebouw D, 3590 Diepenbeek, Belgium 28
8 ETH Zurich, Institute for Atmospheric and Climate Science, Universitaetstrasse 16, 8092 Zurich, 29
Switzerland 30
9 University of Antwerp, Plants and ecosystems (PLECO), Universiteitsplein 1, 2610 Wilrijk, Belgium 31
10 Research Institute for Nature and Forest (INBO), Herman Teirlinckgebouw, Havenlaan 88 box 73, 32
B-1000 Brussels, Belgium 33
11 University of Aberdeen, Institute of Biological and Environmental Sciences, 23 St Machar Drive, 34
Aberdeen, AB24 3UU, UK 35
12 Namur University, Namur Institute of Complex Systems, and the Institute of Life, Earth, and 36
Environment, Research Unit in Environmental and Evolutionary Biology, Rempart de la Vierge 8, 37
5000 Namur , Belgium 38
13 University of Glasgow, Institute of Biodiversity, Animal Health and Comparative Medicine, Graham 39
Kerr Building, G12 8QQ, UK. 40
14 University of Liege, Gembloux Agrobio Tech, TERRA, Res Ctr Atmosphere Ecosyst Exchanges, B-41
5030 Gembloux, Belgium 42
15 University of Liege, Gembloux Agrobio Tech, Department of Agricultural Economics and Rural 43
Development, B-5030 Gembloux, Belgium 44
16 Hasselt University, Faculty of sciences, Agoralaan Gebouw D, 3590 Diepenbeek, Belgium 45
17 Forschungszentrum Juelich, Inst Bio & Geosci IBG-3: Agrosphere, Juelich, Germany 46
18 Ecotron Européen de Montpellier, Centre National de la Recherche Scientifique, 34980 47
Montferrier-sur-Lez, France 48
19 Vrije Universiteit Brussel, Department of Hydrology and Hydraulic Engineering, Pleinlaan 2, 1050 49
Brussels, Belgium 50
20 University of Bern, Climate and Environmental Physics, Sidlerstrasse 5, 3012 Bern, Switzerland 51
21 University of Bern, Oeschger Centre for Climate Change Research, Switzerland 52
3 22 Department of Plant Physiology, Faculty of Biology and Biotechnology, Maria Curie-Sklodowska 53
University, Lublin, Poland 54
55
Preface (100 words)
56
While the general direction of ecosystems’ responses to a variety of climate change scenarios has 57
been well investigated, insights in the potential amplitude and dynamics of this response are scarce 58
and the societal impacts often remain unquantified. Drawing on the expertise of researchers from a 59
variety of disciplines, this paper outlines how methodological and technological advancements can 60
help design climate experiments that better capture the dynamics and amplitude of ecosystem 61
responses provoked by climate change and translate these responses into societal impacts. 62
63
1. Introduction
64
Climate change is expected to impact ecosystem communities and ecosystem functioning1. Crop 65
yields2, carbon (C) sequestration in soil3, and pollination rate4 are generally predicted to decrease, 66
while land evapotranspiration5 and tree mortality, especially in the Boreal region, are expected to 67
increase6. At the same time, the redistribution of species will increase opportunities for pest and 68
pathogen emergence1..
69
These functions are crucial for human well-being through their contribution to ecosystem services, 70
and so impacting them will have important consequences for society7. However, refining the societal 71
cost estimations remains a challenge, partly because large knowledge gaps regarding the amplitude 72
and dynamics of these responses that make it difficult to plan for climate adaptation. Specifically 73
designed climate change experiments are necessary to address these issues. The goal of this 74
perspective paper is fourfold. First, while acknowledging the great advances achieved by climate 75
change-ecosystem responses experiments so far, we also identify the challenges that many of them 76
currently face: high complexity of climate change in terms of environmental variables, constraints in 77
the number and amplitude of climate treatment levels, and the limited scope with regard to 78
4 responses and interactions covered (Section 2). Second, to overcome these challenges we propose 79
an experimental design that can leverage the increased computational and technological capabilities 80
to more accurately capture the complexity of climate change in experiments; increase the number 81
and range of climate treatment levels, and employ an interdisciplinary approach to broaden the 82
range of responses and interactions covered (Section 3). Third, we outline an experiment that applies 83
these design recommendations to demonstrate how it can enhance our capacity to understand and 84
predict ecosystem responses to climate change. We describe the technical infrastructure used in this 85
experiment, the climate manipulations, and the analysis pathway all the way to the valuation of the 86
changes in ecosystem services (Section 4). Fourth, we place this design within the larger context of 87
climate change experiments and pinpoint its complementarity to other designs (Section 5). 88
89
2. Challenges of climate change experiments
90
The complexity of climate change
91
The first challenge for research on climate change-ecosystem responses lies in the complex manner 92
in which global climate change will affect local weather. To mimic a future climate, factors such as air 93
temperature, atmospheric CO2, and precipitation need to be manipulated in combination, which can
94
be both conceptually and technologically challenging8. Therefore, a significant proportion of climate
95
change experiments have focused on measuring the effects of specific combinations of climate 96
factors (such as warming plus drought), manipulated using technology that was available or 97
affordable at that time (such as passive night-time warming and rain exclusion curtains)9. Although 98
these experiments have led to many invaluable outcomes, such approaches cannot fully cover the 99
complexity of climate projections or the covariance of meteorological variables. As such, they may, 100
for example, under- or overestimate the effects on ecosystem functioning of changes in the 101
frequencies of frosts and heat waves, drought-heat-wave reinforcements10, interactions between soil 102
moisture conditions and subsequent precipitation occurrence11, increased frequencies of mild 103
droughts (including in spring and autumn), and increased frequency of heavy precipitation events12. 104
5 These climate alterations can have a strong influence on ecosystem functioning: for example, 105
decreased frost frequency may have a significant impact on plant mortality13 and more frequent mild 106
droughts can trigger plant acclimation and hence resistance to drought stress14. Therefore, many 107
climate change experiments did not simulate (i) an extreme event instead of a change in the mean 108
for a given single factor, (ii) regimes of events instead of a single event for a given single factor, and 109
(iii) complex coupling between multiple factors. This lack of refinement in climate manipulations 110
likely compromised the reliability of the estimation of ecosystem responses. Some steps have already 111
been taken to address this, by applying treatments of precipitation regime or heatwaves as observed 112
in the field15,16 and by using translocation experiments, where macrocosms are displaced across
113
geographic gradients in order to expose them to other climates that match possible future conditions 114
at the location of origin (space for time approach)17. However, such an issue cannot be solved by 115
modelling alone, because it requires testing too many possible interactions between factors, as well 116
as changing regimes of single factors. 117
118
Climate treatment levels: number and range
119
Because of the cost of specialized infrastructure, scientists are often limited in the number of 120
experimental units they can set up within a given experiment. Hence, climate factors are often 121
applied at only two levels: ambient and future projections9. This provides useful estimations on the
122
direction of ecosystem responses but does not provide insights into the shape of the responses to 123
these factors or how far away current conditions are from potential tipping points to alternative 124
stable states18. Moreover, ecosystem responses to multifactor global change drivers are regulated by 125
complex, nonlinear processes19, which makes modeling difficult with experimental data that comes 126
only from the two-level manipulation of environmental factors20. 127
Also stemming from high equipment costs is the narrow range of climate treatments. Most 128
experiments have kept this range within conservative boundaries21, presumably because more 129
drastic (though realistic) climate treatments may have a catastrophic impact on a studied ecosystem, 130
6 potentially leading to the loss of expensively equipped replicates. The truncation of more extreme 131
climate conditions has, in turn, led to a lack of evidence regarding their effects on ecosystem 132
functioning. 133
Finally, low temporal resolution is also an issue. Because it requires an extensive and high frequency 134
monitoring of ecosystem functions, a substantial proportion of climate change experiments have 135
only measured the ecosystem dynamics or trajectories annually or seasonally. Such experiments may 136
fail to detect short-term dynamics of ecosystem responses22 or trajectories leading to a transition to
137
an alternative stable state23,24. However, trends related to ecosystem dynamics often appear on
138
decadal time scales, because of the time needed to alter biogeochemical cycles and the properties of 139
soil organic matter. Therefore the duration of the monitoring should be prioritized over its frequency 140
if the setup does not allow a good coverage of both. 141
142
Integration among disciplines
143
The very nature of climate change and its impacts is discipline-spanning and therefore requires an 144
integrated approach25. Althought the number of interdisciplinary studies related to climate change is 145
increasing steadily26, there are still many challenges related to interdisciplinary research. These 146
include establishing common terminology, concepts and metrics25,27,28, a consistently lower funding
147
success for interdisciplinary research projects29, and a general lack of interdisciplinary research
148
positions25. The barriers depend largely on the purpose, forms and extent of knowledge integration, 149
and their combination30. Although climate change research developed from multidisciplinarity to 150
interdisciplinarity, and further to transdisciplinarity31, most collaborative work in environmental 151
research is small-scale rather than large-scale interdisciplinary work30. Small-scale integration refers 152
to collaborations between similar partners (for example, different natural science disciplines), while 153
large-scale integration crosses broader boundaries (such as between natural and social science)30. 154
Currently, ecosystem services studies are mostly limited to either the natural science aspects or the 155
socio-economic science aspects and rarely cover the entire ecosystem services cascade32. This lack of 156
7 large-scale knowledge integration results in errors along this cascade; both when moving from 157
biodiversity and ecosystem functions to ecosystem services, and when moving from ecosystem 158
services to societal values. 159
160
3. Recommendations
161
Using climate model outputs and technology to refine climate change treatments
162
A first option to prescribe a projected change in weather dynamics is to alter specific characteristics 163
(such as drought duration, heat wave intensity) in isolation using high-frequency data of ambient 164
weather conditions so that they match future projections. The advantage of this method is that 165
atmospheric conditions can be modified with high-quality field data instead of relying upon less 166
precise regional climate model outputs with lower spatial and temporal resolution. Moreover, if used 167
to manipulate one climate factor at a time, such an approach facilitates a mechanistic understanding 168
of ecosystem responses that can be further extrapolated through modeling. This design may 169
combine two or more factors to provide information about interactions between climate 170
parameters. 171
Incorporating the complexity of projected changes can also be achieved by using outputs of state-of-172
the-art climate models. Due to model biases, the appropriate model must be selected very carefully. 173
Global climate models (GCMs) are useful tools for assessing climate variability and change on global 174
to continental scales, typically with a spatial resolution of 100−250 km. To es mate climate variability 175
at more local scales, GCMs are dynamically downscaled using regional climate models (RCMs), which 176
resolve the climate at higher resolutions (typically 10−50 km). The GCM/RCM combina ons can then 177
be chosen based on (i) how well models perform against local climate and weather characteristics in 178
the studied ecosystem and (ii) how representative future projections are to the multi-model mean. In 179
this case, one can simulate an ecosystem response to a given climate setup with higher accuracy. 180
However, unlike with a full factorial experiment, it is not possible to attribute an ecosystem response 181
to a given climate factor. Nevertheless, the model-output approach does facilitate the application of 182
8 increasingly high warming levels by using a global mean temperature gradient (see Section 4). It also 183
addresses the issues of covarying variables, and it can be directly linked with a scenario from the 184
Intergovernmental Panel on Climate Change which would represent a major step towards bridging 185
the gap between climate and ecosystem science. 186
187
However, to implement these options it is necessary to control climate conditions and atmospheric 188
composition with high frequency and high accuracy. This can be achieved only with dedicated and 189
advanced equipment. Ecotron infrastructures, which consist of a set of replicated experimental units 190
where environmental conditions are tightly controlled and where multiple ecosystem processes are 191
automatically monitored, are well-suited to fulfill these needs33. Such infrastructures have been 192
historically limited to a handful across the world9,but are becoming increasingly widespread34–36. 193
They also offer the opportunity to monitor ecosystem responses at sub-hourly frequencies, making it 194
possible to simultaneously discriminate between short- and long-term ecosystem responses. 195
196
Increasing the number and range of climate treatment levels
197
A gradient design, in which one or several climate factors are applied at increasingly high levels, can 198
substantially increase the resolution of a climate change experiment. This is better suited to 199
quantitatively describing the relationship between a response variable and a continuous climate 200
factor than the more traditional approach of testing ambient versus a single future projection, and 201
allows the collection of quantitative data for ecological models37. It also makes it possible to detect 202
nonlinearity, thresholds, and tipping points, and to interpolate and extrapolate ecosystem 203
responses18. While such gradient designs should ideally be replicated, unreplicated regression 204
designs can be a statistically powerful way of detecting response patterns to continuous and 205
interacting environmental drivers, provided that the number of levels in the gradient is large 206
enough37. 207
9 To ensure appraisal of the largest possible range of ecosystem responses, the gradient should be as 208
long as possible, even extending beyond the most extreme conditions. Broader treatment modalities 209
can also inform how far a specific ecosystem response is situated relative to its upper or lower 210
tolerance limit. In addition, the levels of the gradient may be spread in a non-linear manner to 211
achieve the highest resolution in the range where the strongest ecosystem responses are expected. 212
213
Employing an interdisciplinary approach to better capture responses and interactions
214
We argue that an overarching objective of climate change experiments is to contribute to the 215
understanding of the impacts that climate change has on nature and society as well as to enlarge our 216
potential for climate adaptation. However, as outlined in Section 2, the lack of large-scale knowledge 217
integration can result in errors along the ecosystem services cascade; first in the step from 218
biodiversity and ecosystem functions to ecosystem services and second from ecosystem services to 219
societal values. 220
Regarding the first step, thorough quantification of ecosystem services should be based on specific 221
data regarding how the ecosystem is functioning. Many ecosystem service studies use land use as an 222
indicator of ecosystem service delivery32, but often land use classification cannot capture differences 223
between abiotic conditions and ecological processes that explain differences in service delivery38. 224
Therefore, using land use as a simple indicator will result in inappropriate management decisions38. 225
Regarding the second step, economists need to be involved early in the process. Although there are 226
many ways in which ecosystem function changes can affect the provision of ecosystem services to 227
society39. However, budget constraints necessitate the selection of those ecosystem functions and 228
services that are considered most important to society. A common selection approach is to consider 229
the potential impact of ecosystem changes in terms of human welfare endpoints, often by means of 230
monetary valuation. Ecologists and economists must interact across disciplinary boundaries if 231
ecological experiments are intended to predict these endpoints within an ecosystem services 232
context40. Hence, economists need to be involved during the design of ecological experiments in
10 order to ensure that those ecosystem service changes that are most relevant for human welfare are 234
measured and predicted. 235
We suggest that, the desired large-scale integration can be achieved in several steps, organized in a 236
top-down approach. The first step is to identify the key ecosystem services to value based on welfare 237
endpoints41. For most terrestrial ecosystems, this would imply assessing services from the following 238
list: food and raw material production and quality, water supply and quality, C sequestration, 239
depollution, erosion prevention, soil fertility, pest and pathogen control, pollination, maintenance of 240
biodiversity and recreation. The second step consists of identifying the set of variables that best 241
describes the ecosystem functions, processes and structures associated with these services. Based on 242
the literature42, we suggest the following measures (see also Table 1): (i) vegetation variables (plant
243
community structure, above/belowground biomass, litter quality), (ii) atmospheric parameters (net 244
ecosystem exchange, greenhouse gas emissions), (iii) soil abiotic (pH, texture, electrical conductivity, 245
macro-, micronutrient and pollutant content) and biotic (fauna and microbial community structure, 246
respiration, and biomass) variables, and (iv) all parameters that describe movements of water in the 247
soil-plant-atmosphere continuum (precipitation, leaching, air relative humidity, evapotranspiration, 248
water potential). Air and soil temperatures should also be monitored, since they determine 249
biogeochemical reaction rates. Finally, ecosystem processes, structures and functions need to be 250
translated into services, and ultimately into societal value by expressing them in monetary and non-251
monetary terms. Measuring all of these variables, integrating them in an ecosystem service 252
framework, and estimating the societal value of these services would require expertise from plant 253
ecologists and ecophysiologists, hydrologists, soil biogeochemists, animal ecologists, microbiologists, 254
pedologists, climatologists, as well as modelers and environmental economists43. 255
256
4. An initial application of the recommendations: The UHasselt Ecotron experiment
257
Here we describe our proposed interdisciplinary approach in the context of a climate change 258
manipulation using the UHasselt Ecotron experiment. 259
11 260
Ecotron infrastructure
261
The UHasselt Ecotron facility consists of tightly controlled climate change manipulations of 12 262
macrocosms (soil-canopy columns of 2 m in diameter and 1.5 m depth), extracted without significant 263
disruption of the soil structure from a dry heathland plot in the ‘Hoge Kempen’ National Park (50° 59' 264
02.1" N, 5° 37' 40.0" E) in November 2016. The plot was managed for restoration six years before the 265
sampling. The design of this infrastructure benefited from exchanges through the AnaEE (Analysis 266
and Experimentation on Ecosystems)/ESFRI (European Strategy Forum on Research Infrastructure) 267
project. Some of the infrastructure’s features were inspired by the Macrocosms platform of the CNRS 268
Montpellier Ecotron16. Each UHasselt Ecotron unit consists of three compartments: the dome, the 269
lysimeter, and the chamber. The dome consists of a shell-shaped dome made of highly PAR 270
(photosynthetically active radiation) transparent material, where wind and precipitation are 271
generated and measured and where the concentration of greenhouse gases (CO2, N2O, CH4), PPFD
272
(photosynthetic photon flux density) and difference between incoming and outgoing short- and long-273
wave radiation are measured. The lysimeter (equipment for measuring hydrological variations 274
undergone by a body of soil under controlled conditions) contains the soil-canopy column, where 275
soil-related parameters are controlled (including the vertical gradient of soil temperature and water 276
tension) and measured, and is weighed every minute. Suction cups and soil sensors are installed 277
following a triplicated 5 depth design (Fig. S1). The chamber is a gastight room that encloses the 278
lysimeter, where air pressure, air temperature, relative humidity, and CO2 concentration are
279
controlled and key variables measured in each unit (Fig. S1). The UHasselt Ecotron is linked with a 280
nearby Integrated Carbon Observation System (ICOS) ecosystem tower (https://www.icos-281
ri.eu/home), which provides real-time data on local weather and soil conditions, with a frequency of 282 at least 30 minutes. 283 284 Climate manipulations 285
12 A double-gradient approach is adopted: one approach (six units) measures the effect of an altered 286
single factor (here, precipitation regime), while maintaining the natural variation of other abiotic 287
factors, and the other approach (six units) manipulates climate by jointly simulating all covarying 288
parameters, representing increasingly intense climate change. The two approaches are described 289
below. Because they sit isolated in an enclosed facility, it is possible that small initial differences in 290
the soil-canopy core in a given unit will increase with time to the point where it becomes statistically 291
different from the others. Therefore, the units were first distributed within the two gradients using a 292
cluster analysis to minimize the noise in ecosystem responses measured during a test period (see Fig. 293
S2) due to small-scale soil heterogeneity. This clustering was used to distribute the units according to 294
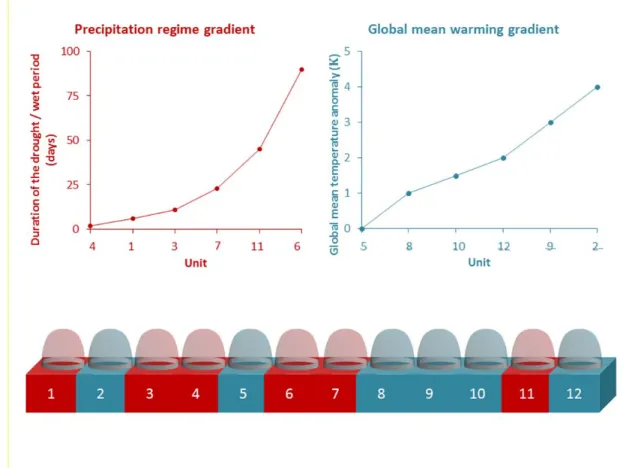
the pattern shown in Fig. 1. 295
296
Figure 1. Overview of the two climate change gradient designs in the UHasselt Ecotron experiment.
297
The units have been redistributed to maximize statistical similarity within a gradient prior to the
13
treatment. Global mean temperature anomalies are computed with respect to the reference period
299
1951-1955.
300 301
Climate change projections for the NW Europe region predict higher probability of both heavier 302
precipitation and longer droughts, without a significant change in yearly precipitation44. The 303
precipitation regime gradient uses real-time input from the ecosystem tower nearby, and only alters 304
precipitation events: across the gradient, increasingly long periods (2, 6, 11, 23, 45 and 90 days), 305
based on local climate records from Maastricht, NL45) in which precipitation is withheld (dry period)
306
are followed by increasingly long periods in which precipitation is increased (wet period), with the 307
duration of the two periods kept equal within a unit (Fig. 1). Precipitation events during the wet 308
period are increased twofold and are adjusted at the end of the period to avoid altering the yearly 309
precipitation amount. 310
To drive the second gradient of the UHasselt Ecotron experiment, we use the climate variables 311
produced by an RCM following Representative Concentration Pathway (RCP) 8.5, a high-emission 312
scenario46. The gradient itself is determined based on global mean temperature anomalies. In the six 313
units, climates corresponding to a +0 ° to +4 °C warmer world (projected for periods ranging from 314
1951−1955 to 2080−2089) are simulated (Fig. 1, Fig. S3), by extrac ng local climate condi ons from 315
the RCM for periods consistent with these warming levels (Fig. S3)47. This set-up also facilitates 316
comparison of the ‘present-day’ climate as simulated by the RCM (the +1 °C unit), to the unit driven 317
by ICOS field observations. Moreover, the climate simulated in the +1.5° C unit is reasonably 318
consistent with the lower end of the long-term temperature goals set by the Paris Agreement48. 319
14 320 321 322 323 324 325 326 327 328 329 330 331 332 333
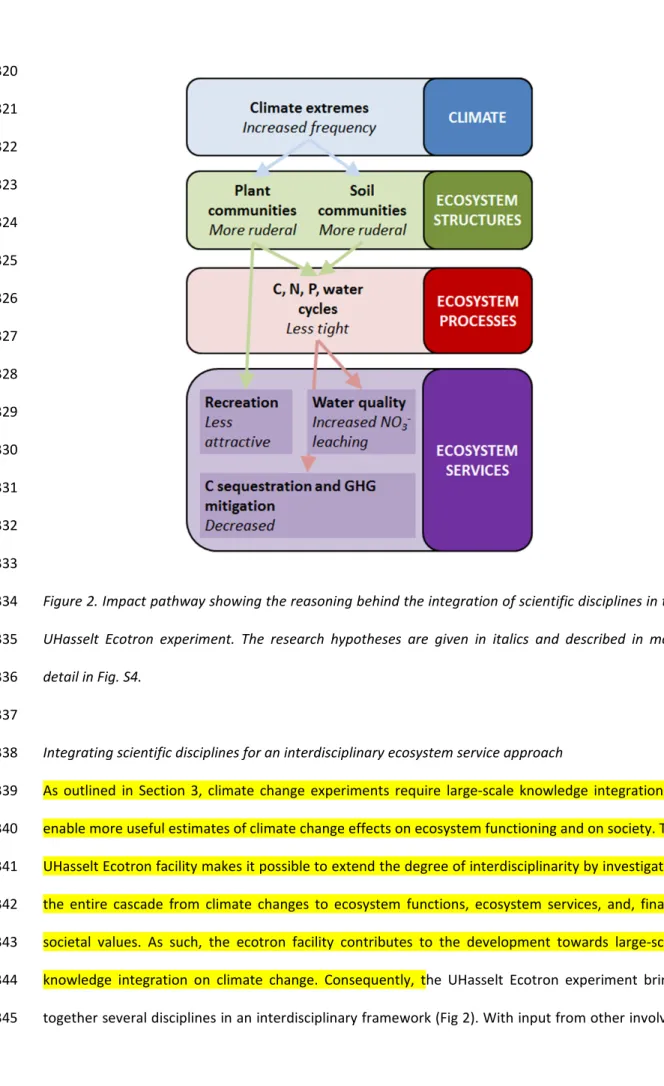
Figure 2. Impact pathway showing the reasoning behind the integration of scientific disciplines in the
334
UHasselt Ecotron experiment. The research hypotheses are given in italics and described in more
335
detail in Fig. S4.
336 337
Integrating scientific disciplines for an interdisciplinary ecosystem service approach
338
As outlined in Section 3, climate change experiments require large-scale knowledge integration to 339
enable more useful estimates of climate change effects on ecosystem functioning and on society. The 340
UHasselt Ecotron facility makes it possible to extend the degree of interdisciplinarity by investigating 341
the entire cascade from climate changes to ecosystem functions, ecosystem services, and, finally, 342
societal values. As such, the ecotron facility contributes to the development towards large-scale 343
knowledge integration on climate change. Consequently, the UHasselt Ecotron experiment brings 344
together several disciplines in an interdisciplinary framework (Fig 2). With input from other involved 345
15 disciplines, climatologists design the protocols for climate manipulations and plant ecologists 346
monitor plant communities in each ecotron unit. Numerical models for water movement within one 347
unit are developed by mathematicians and hydrologists. Ecotron output on C cycling is fed into a soil 348
C model49, both for calibration and prediction purposes. Community modelers improve the power of 349
this model by accounting for the soil community structure and species interactions (food web). The 350
specific role of soil organisms in soil biogeochemistry is investigated by microbial and soil fauna 351
ecologists. This is inferred from variation in responses of different functional groups such as nitrogen 352
fixers, mycorrhizal fungi and different feeding guilds of soil fauna, combined with additional separate 353
experiments, both in the field and in vitro. The outputs of the measurements above (see Table 1) 354
allow experts in ecosystem ecology to quantify ecosystem services. Environmental economists 355
express the change in ecosystem services provided using best-practice monetization approaches50. 356
For example, water quality regulation is assessed as the prevented cost of intensified water 357
treatment or use of other water resources. Measurements of vegetation, soil abiotic parameters and 358
the water balance make it possible to quantify this benefit. Carbon sequestration is assessed as the 359
prevented cost from increased global temperature, which can be quantified based on vegetation, air 360
parameters and soil abiotic parameters measurements. Maintenance of biodiversity and recreation 361
can be assessed based on measurements of vegetation. 362
We note that (monetary) estimates from an individual study can often not be applied directly for 363
generating policy-recommendations51, especially for complex and spatially heterogeneous problems 364
such as climate change impacts on ecosystems. However, meta-analyses need to rely on data 365
generated by primary studies that estimate the societal cost (or benefit) of changes in specific 366
services provided by a specific ecosystem at specific location(s). In this regard, the UHasselt Ecotron 367
experiment can also provide valuable input data for dedicated policy-guiding analyses52. 368
16
Table 1. Measured variables in the UHasselt Ecotron experiment and links with ecosystem functions,
370
services, and values. Left-hand side of the table: ecosystem services. Right-hand side: variables
371
measured in the ecotron experiment. Lower part of the table: illustration of how the societal value of
372
four of the ecosystems services will be assessed.
373
374
5. The place of the suggested design within the landscape of climate change experiments
375
A comprehensive understanding of ecosystem responses to climate change can only be achieved 376
through the use of a broad range of different, complementary experimental designs, all of which can 377
be integrated through modeling. The experimental design suggested here exhibits a unique set of 378
advantages and drawbacks, which makes it suited to tackle specific needs within the climate change 379
experiments landscape. 380
Strengths and limitations of the design
381
The strengths of the suggested design comprises (1) high-performance microclimate conditioning, 382
both above- and belowground, which makes it possible to approximate field conditions while 383
maintaining control, (2) high-frequency automated measurements of ecosystem functions and thus 384
17 of treatment impact thereon, and (3) a large-scale interdisciplinary approach. The first two strengths 385
are inherent to the ecotron research infrastructure, while the large-scale integration can 386
theoretically be implemented in any climate change experiment. However, we consider ecotron 387
infrastructures to be particularly suitable for such an interdisciplinary approach, because of the high-388
end climate control and the broad range of functions monitored at a high frequency. 389
With respect to (1), studies focusing on ecosystem functions, processes and structures that are highly 390
sensitive to soil temperature and soil water potential would benefit most from being conducted in 391
ecotrons (for example, soil CO2 exchange and C sequestration, growth and activity of soil microbes
392
and soil fauna), as the lysimeter component can generate very precise lower boundary conditions 393
and thus realistic vertical soil profiles of temperature and soil water status. With respect to (2), 394
studies in which the high-resolution temporal pattern of ecosystem functions and their coupling is 395
important would also benefit from ecotron infrastructures, as it is difficult to measure these 396
parameters manually across long time scales. For example, simultaneous automated measurement 397
of the carbon, water and mineral nutrient cycles makes it possible to disentangle their interactions in 398
a range of climate conditions, and to feed control mechanisms into models. 399
A first set of constraints in the usefulness of the experimental design described in this paper stems 400
from the scale limitation of the experimental units. Ecotrons can accommodate plants only of small 401
stature (less than two meters in height), which excludes forests and tall crops. For the same reason, 402
the impact of megafauna such as grazers or top predators cannot be tested. Results obtained in 403
macrocosms only integrate small-scale (less than one meter) variability, which leads to a lack of 404
accuracy when scaling up to ecosystem. 405
Second, it may be difficult to financially support this type of experiment on the time scale of 406
ecosystem responses (10 years or more)53. Ecosystem shifts to alternative stable states may remain 407
undetected if the funding period is shorter than the period required for the ecosystem to shift. A 408
partial solution for this would be to adopt a gradient design with increasingly late endpoints of 409
18 projected climate change; this would allow for some extrapolation of ecosystem response in time 410
(trajectories), which is possibly enough to estimate ranges of this response in the longer term. 411
Third, macrocosms in ecotron facilities are isolated from their ecosystem of origin. Hence genetic 412
input from propagules or pollination probably differ significantly from the field, which can be an 413
issue, especially in long-term experiments. This could be mitigated in two ways. The first is by 414
minimizing sampling disturbance, by sampling for soil microbes and soil fauna not more than twice a 415
year, using 10 cm diameter soil cores, this would account for only 1.5% of total soil surface annually. 416
The second way is by replacing soil sampling cores in the lysimeter by cores taken from the same 417
ecosystem. This would also avoid holes at the soil surface that may alter water flow through the soil 418
column. Furthermore, field traps to collect airborne propagules can be collected yearly and their 419
content spread on the enclosed surface of the soil-canopy columns. These solutions would at least 420
ensure fresh genetic input into the system, even though this input may be different in the field in 421
future conditions. 422
Finally, radiation in ecotron enclosures sometimes differ than in the field. Artificial LED-lightning 423
allows to control radiation precisely but is yet not able to reach the same radiation level as in the 424
field, while ambient lightning can disrupt its synchronization with temperature or precipitation. This 425
may be an issue while simulating heatwaves and droughts, which have more sunshine hours than 426
wet periods 54.
427 428
Complementarity with other climate change experiments
429
The weaknesses of the proposed design (small spatial scale, potentially insufficient time-scale, lack of 430
interaction with the surrounding environment) can be mitigated further through the use of 431
complementary experiments, which might even be partially integrated into the overarching 432
approach. For example, owing to small spatial scale, the results might have limited validity as a 433
predictor of ecosystem responses at other sites and in other habitats. Running experiments in 434
parallel across multiple climates and locations with the same methodology, also known as 435
19 “coordinated distributed experiments” (CDEs), would be better suited for this purpose as it allows 436
extrapolation and generalization of results while correcting for effect size55. For example, such a 437
design makes it possible to study plant response to nutrient addition and herbivore exclusion56; and 438
ecological responses to global change factors across 20 eco-climate domains using a set of 439
observatory sites57. In fact, a coordinated distributed experiment using the design presented in 440
Section 4, and testing the same climate gradient in different ecosystems across several ecotron 441
facilities would combine the high generalization potential of CDEs with the precision of ecotrons. 442
A second area for potential complementarity and integration is translocation experiments. These 443
experiments are well suited for long-term observations due to their relatively low funding 444
requirements and relative ease of implementation, and the soil macrocosms used in these 445
experiments are still connected to their surrounding environment17. However, the functioning of the 446
ecosystem is monitored less comprehensively and frequently within these types of experiments and 447
the influence of different climate factors on ecosystem functioning cannot be disentangled. 448
Consequently, running an ecotron and a translocation experiment in parallel on the same ecosystem 449
with similar climate treatments would make it possible to estimate the effect size of the connection 450
with the surrounding environment on ecosystem response to climate change. This information can 451
then, in turn, be used to correct the outputs of future ecotron experiments by accounting for the 452
isolation factor. 453
454
Usefulness of the suggested design for modeling ecosystem response to climate change
455
While ecosystem models can be evaluated and calibrated using a range of data sources, including 456
sites in different climate zones and long-term experiments without climate manipulation58, data from 457
well-controlled, replicated and highly instrumented facilities such as those described here are 458
invaluable for testing the process understanding encapsulated in the models, and for testing model 459
behavior against detailed, multi-parameter observations36. Models that are tested and, where 460
necessary, calibrated against such data can then be evaluated against data from other sites. If the 461
20 outputs do not prove to be generalizable, the information derived from testing the model could be 462
used to refine the experimental design and explain variation in the measured values. If the outputs 463
prove generalizable, the models can be used across larger temporal and spatial scales to project 464
potential impacts of future climate change59,60. 465
466
6. Conclusion
467
The effects of climate change on ecosystem functioning have far-reaching consequences for society. 468
Here we present a type of experiment that is designed to estimate the amplitude and dynamics of 469
ecosystem responses to climate change, and the consequences for ecosystem services. We have 470
outlined that climate change experiments are facing three types of challenges: limitations in 471
addressing the complexity of climate change in terms of control of environmental variables, 472
constraints in the number and range of climate level treatments, and restrictions in scope. We have 473
suggested ways to address these challenges: improving computational and technological capabilities, 474
increasing the number and range of climate treatment levels, and employing an interdisciplinary 475
approach. We illustrated these suggestions through a case study where they have been 476
implemented, and outlined the place of this design in the broader landscape of climate change 477
experiments. 478
We foresee that the holistic approach outlined in this perspective could yield more reliable, 479
quantitative predictions of terrestrial ecosystem response to climate change, and could improve 480
knowledge on the value of ecosystem services and their links with ecosystem processes. We expect 481
these results to be of interest for society beyond just scientists: they provide nature managers with 482
predictions on ecosystem responses to help them decide on ecosystem management practices in the 483
mid- and long-term, and that they will explain to policymakers and the wider public the societal 484
impact of ecosystem changes induced by climate change at a more detailed, ecosystem-specific level. 485
486
Acknowledgments
21 The authors thank the Flemish government (through Hercules Stichting big infrastructure and the 488
Fund for Scientific Research Flanders project G0H4117N), LSM (Limburg Sterk Merk, project 271) for 489
providing funds to build the UHasselt Ecotron; Hasselt University for both funding and policy support 490
(project BOF12BR01 and Methusalem project 08M03VGRJ); and the ecotron research committee for 491
useful comments on the experimental design. We also thank RLKM (Regional Landscape Kempen and 492
Maasland) for its collaboration and support. Nele Witters, Sebastien Lizin, Anne Nobel, and Inne 493
Vanderkelen are funded by Research Foundation-Flanders (FWO). 494
495
Authors’ contributions
496
FR and RM took the lead in writing the manuscript and received input from all co-authors. The initial 497
conceptualization of this manuscript was discussed during a consortium meeting. All authors 498
proofread and provided their input to different draft versions and gave their final approval for 499 submission. 500 501 References 502
1. Scheffers, B. R. et al. The broad footprint of climate change from genes to biomes to people.
503
Science (80-. ). 354, (2016).
504
2. Zhao, C. et al. Temperature increase reduces global yields of major crops in four independent
505
estimates. 1–6 (2017). doi:10.1073/pnas.1701762114 506
3. Allen, C. D. et al. A global overview of drought and heat-induced tree mortality reveals 507
emerging climate change risks for forests. For. Ecol. Manage. 259, 660–684 (2010). 508
4. Hat, J. L. & Prueger, J. H. Temperature extremes : Effect on plant growth and development. 509
10, 4–10 (2015).
510
5. Collins, M. et al. Long-term Climate Change: Projections, Commitments and Irreversibility. in
511
Climate Change 2013: The Physical Science Basis. Contribution of Working Group I to the Fifth
512
Assessment Report of the Intergovernmental Panel on Climate Change (eds. Stocker, T. F. et
22 al.) 1029–1136 (Cambridge University Press, Cambridge, United Kingdom and New York, NY, 514
USA, 2013). doi:10.1017/CBO9781107415324.024 515
6. Pecl, G. T. et al. Biodiversity redistribution under climate change: Impacts on ecosystems and 516
human well-being. 9214, (2017). 517
7. Millenium Ecosystem Assessment. Ecosystems and human well-being: Synthesis. Island Press, 518
Washington, DC. (2005). doi:10.1196/annals.1439.003
519
8. Leuzinger, S. et al. Do global change experiments overestimate impacts on terrestrial
520
ecosystems? Trends Ecol. Evol. 26, 236–241 (2011). 521
9. Stewart, R. I. A. et al. Mesocosm Experiments as a Tool for Ecological Climate-Change 522
Research. Advances in Ecological Research 48, (Elsevier Ltd., 2013).
523
10. Zscheischler, J. & Seneviratne, S. I. Dependence of drivers affects risks associated with 524
compound events. Sci. Adv. 3, 1–11 (2017). 525
11. Guillod, B. P., Orlowsky, B., Miralles, D. G., Teuling, A. J. & Seneviratne, S. I. Reconciling spatial 526
and temporal soil moisture effects on afternoon rainfall. Nat. Commun. 6, 1–6 (2015). 527
12. Thiery, W. et al. Hazardous thunderstorm intensification over Lake Victoria. Nat. Commun. 7,
528
1–7 (2016). 529
13. Berendse, F., Schmitz, M. & Visser, W. De. Experimental Manipulation of Succession in 530
Heathland Ecosystems. Oecologia 100, 38–44 (1994). 531
14. Backhaus, S. et al. Recurrent Mild Drought Events Increase Resistance Toward Extreme
532
Drought Stress. Ecosystems 17, 1068–1081 (2014). 533
15. Verburg, P. S. J. et al. Impacts of an anomalously warm year on soil nitrogen availability in 534
experimentally manipulated intact tallgrass prairie ecosystems. Glob. Chang. Biol. 15, 888– 535
900 (2009). 536
16. Roy, J. et al. Elevated CO 2 maintains grassland net carbon uptake under a future heat and
537
drought extreme. Proc. Natl. Acad. Sci. 113, 6224–6229 (2016). 538
17. Cantarel, A. M. & Bloor, J. M. G. Four years of simulated climate change reduces above- 539
23 ground productivity and alters functional diversity in a grassland ecosystem. 24, 113–126 540
(2013). 541
18. Kreyling, J. et al. To replicate, or not to replicate - that is the question: how to tackle nonlinear
542
responses in ecological experiments. Ecol. Lett. (2018). doi:10.1111/ele.13134 543
19. Zhou, X., Weng, E. & Luo, Y. Modeling patterns of nonlinearity in ecosystem responses to 544
temperature, Co2, and precipitation changes. Ecol. Appl. 18, 453–466 (2008). 545
20. Luo, Y. et al. Modeled interactive effects of precipitation, temperature, and [CO2] on
546
ecosystem carbon and water dynamics in different climatic zones. Glob. Chang. Biol. 14, 547
1986–1999 (2008). 548
21. Kayler, Z. E. et al. Experiments to confront the environmental extremes of climate change.
549
(2015). doi:10.1890/140174 550
22. Svenning, J. C. & Sandel, B. Disequilibrium vegetation dynamics under future climate change. 551
Am. J. Bot. 100, 1266–1286 (2013).
552
23. Harris, R. M. B. et al. Biological responses to the press and pulse of climate trends and
553
extreme events. Nat. Clim. Chang. 8, 579–587 (2018). 554
24. Scheffer, M., Carpenter, S., Foley, J. a, Folke, C. & Walker, B. Catastrophic shifts in ecosystems. 555
Nature 413, 591–6 (2001).
556
25. Hein, C. J. et al. Overcoming early career barriers to interdisciplinary climate change research.
557
Wiley Interdiscip. Rev. Clim. Chang. 9, 1–18 (2018).
558
26. Xu, X., Goswami, S., Gulledge, J., Wullschleger, S. D. & Thornton, P. E. Interdisciplinary 559
research in climate and energy sciences. Wiley Interdiscip. Rev. Energy Environ. 5, 49–56 560
(2016). 561
27. Sievanen, L., Campbell, L. M. & Leslie, H. M. Challenges to Interdisciplinary Research in 562
Ecosystem-Based Management. Conserv. Biol. 26, 315–323 (2012). 563
28. Abiven, S. et al. Integrative research efforts at the boundary of biodiversity and global change
564
research. Curr. Opin. Environ. Sustain. 29, 215–222 (2017). 565
24 29. Bromham, L., Dinnage, R. & Hua, X. Interdisciplinary research has consistently lower funding 566
success. Nature 534, 684–687 (2016). 567
30. Turner, L. M. et al. Transporting ideas between marine and social sciences: experiences from 568
interdisciplinary research programs. Elem Sci Anth 5, (2017). 569
31. Hellsten, I. & Leydesdorff, L. The construction of interdisciplinarity: the development of the 570
knowledge base and programmatic focus of the journal Climatic Change, 1977-2013. J. Assoc. 571
Inf. Sci. techology 67, 2181–2193 (2016).
572
32. Boerema, A., Rebelo, A. J., Bodi, M. B., Esler, K. J. & Meire, P. Are ecosystem services 573
adequately quantified? J. Appl. Ecol. 54, 358–370 (2017). 574
33. Clobert, J. et al. How to Integrate Experimental Research Approaches in Ecological and
575
Environmental Studies : AnaEE France as an Example. 6, (2018). 576
34. Mougin, C. et al. A coordinated set of ecosystem research platforms open to international
577
research in ecotoxicology, AnaEE-France. Environ. Sci. Pollut. Res. 22, 16215–16228 (2015). 578
35. Eisenhauer, N. & Türke, M. From climate chambers to biodiversity chambers. Front. Ecol. 579
Environ. 16, 136–137 (2018).
580
36. Milcu, A. et al. Functional diversity of leaf nitrogen concentrations drives grassland carbon
581
fluxes. Ecol. Lett. 17, 435–444 (2014). 582
37. Cottingham, K. L., Lennon, J. T. & Brown, B. L. Knowing when to draw the line : designing more 583
informative ecological experiments. Front. Ecol. Environ. 3, 145–152 (2005). 584
38. Van der Biest, K. et al. Evaluation of the accuracy of land-use based ecosystem service 585
assessments for different thematic resolutions. J. Environ. Manage. 156, 41–51 (2015). 586
39. Polasky, S. & Segerson, K. Integrating Ecology and Economics in the Study of Ecosystem 587
Services: Some Lessons Learned. Annu. Rev. Resour. Econ. 1, 409–434 (2009). 588
40. Inkpen, S. A. & Desroches, C. T. When Ecology Needs Economics and Economics Needs 589
Ecology: Interdisciplinary Exchange in the Age of Humans. 21 (2019). 590
41. Costanza, R. et al. Changes in the global value of ecosystem services. Glob. Environ. Chang. 26,
25 152–158 (2014).
592
42. Braat, L. C. & de Groot, R. The ecosystem services agenda:bridging the worlds of natural 593
science and economics, conservation and development, and public and private policy. Ecosyst. 594
Serv. 1, 4–15 (2012).
595
43. Plaas, E. et al. Towards valuation of biodiversity in agricultural soils: A case for earthworms.
596
Ecol. Econ. 159, 291–300 (2019).
597
44. Brouwers, J. et al. MIRA Climate Report 2015, about observed and future climate changes in
598
Flanders and Belgium. (2015). doi:10.13140/RG.2.1.2055.8809
599
45. Klein Tank, A. M. G. et al. Daily dataset of 20th-century surface air temperature and 600
precipitation series for the European Climate Assessment. Int. J. Climatol. 22, 1441–1453 601
(2002). 602
46. van Vuuren, D. P. et al. The representative concentration pathways: An overview. Clim.
603
Change 109, 5–31 (2011).
604
47. Seneviratne, S. I., Donat, M. G., Pitman, A. J., Knutti, R. & Wilby, R. L. Allowable CO2emissions 605
based on regional and impact-related climate targets. Nature 529, 477–483 (2016). 606
48. UNFCCC. Conference of the Parties (COP). Paris Climate Change Conference-November 2015, 607
COP 21. Adopt. Paris Agreement. Propos. by Pres. 21932, 32 (2015). 608
49. Smith, J. et al. Estimating changes in Scottish soil carbon stocks using ECOSSE. II. Application.
609
Clim. Res. 45, 193–205 (2010).
610
50. Schaubroeck, T. et al. Environmental impact assessment and monetary ecosystem service
611
valuation of an ecosystem under different future environmental change and management 612
scenarios ; a case study of a Scots pine forest. J. Environ. Manage. 173, 79–94 (2016). 613
51. Hunter, J. E. & Schmidt, F. L. Cumulative research knowledge and social policy formulation: 614
The Critical Role of Meta-Analysis. Psychol. Public Policy, Law 2, 324–347 (1996). 615
52. Gerstner, K. et al. Will your paper be used in a meta-analysis? Make the reach of your
616
research broader and longer lasting. Methods Ecol. Evol. 8, 777–784 (2017). 617
26 53. Knapp, A. K. et al. Past , Present , and Future Roles of Long-Term Experiments in the LTER
618
Network. 62, 377–389 (2012). 619
54. De Boeck, H. ., Dreesen, F. E., Janssens, I. A. & Nijs, I. Climatic characteristics of heat waves 620
and their simulation in plant experiments. Glob. Chang. Biol. 16, 1992–2000 (2010). 621
55. Fraser, L. H. et al. Coordinated distributed experiments : an emerging tool for testing global 622
hypotheses in ecology and environmental science. (2013). doi:10.1890/110279 623
56. Lind, E. M. et al. Life-history constraints in grassland plant species : a growth-defence
trade-624
off is the norm. 513–521 (2013). doi:10.1111/ele.12078 625
57. Keller, M., Schimel, D. S., Hargrove, W. W. & Hoffman, F. M. A continental strategy for the 626
National Ecological Observatory Network. Front. Ecol. Enviornment 6, 282–284 (2008). 627
58. Smith, P. et al. Towards an integrated global framework to assess the impacts of land use and
628
management change on soil carbon : current capability and future vision. 2089–2101 (2012). 629
doi:10.1111/j.1365-2486.2012.02689.x 630
59. Richards, M. et al. High-resolution spatial modelling of greenhouse gas emissions from
land-631
use change to energy crops in the United Kingdom. 44, 627–644 (2017). 632
60. Song, J. et al. A meta-analysis of 1,119 manipulative experiments on terrestrial carbon-cycling
633
responses to global change. Nat. Ecol. Evol. (2019). doi:10.1038/s41559-019-0958-3 634