HAL Id: tel-01878755
https://tel.archives-ouvertes.fr/tel-01878755
Submitted on 21 Sep 2018HAL is a multi-disciplinary open access archive for the deposit and dissemination of sci-entific research documents, whether they are pub-lished or not. The documents may come from teaching and research institutions in France or abroad, or from public or private research centers.
L’archive ouverte pluridisciplinaire HAL, est destinée au dépôt et à la diffusion de documents scientifiques de niveau recherche, publiés ou non, émanant des établissements d’enseignement et de recherche français ou étrangers, des laboratoires publics ou privés.
Jiawei Zhu
To cite this version:
Jiawei Zhu. Modeling and optimizing comfort and energy efficiency in smart homes. Other. Université de Technologie de Belfort-Montbeliard, 2015. English. �NNT : 2015BELF0269�. �tel-01878755�
Thèse de Doctorat
n
é c o l e d o c t o r a l e s c i e n c e s p o u r l ’ i n g é n i e u r e t m i c r o t e c h n i q u e s
U N I V E R S I T É D E T E C H N O L O G I E B E L F O R T - M O N T B É L I A R D
Modeling and Optimizing Comfort
and Energy Efficiency in Smart
Homes
Thèse de Doctorat
é c o l e d o c t o r a l e s c i e n c e s p o u r l ’ i n g é n i e u r e t m i c r o t e c h n i q u e s
U N I V E R S I T É D E T E C H N O L O G I E B E L F O R T - M O N T B É L I A R D
TH `
ESE pr ´esent ´ee par
J
IAWEI
Z
HU
pour obtenir le
Grade de Docteur de
l’Universit ´e de Technologie de Belfort-Montb ´eliard
Sp ´ecialit ´e :Informatique
Modeling and Optimizing Comfort and Energy
Efficiency in Smart Homes
Unit ´e de Recherche :
Institut de Recherche sur les Transports, l’ ´Energie et la Soci ´et ´e (IRTES)
Soutenue publiquement le 24 septembre 2015 devant le Jury compos ´e de : VINCENTCHEVRIER Rapporteur Professeur `a l’Universit ´e de Lorraine ZAHIAGUESSOUM Rapporteur Maˆıtre de Conf ´erences - HDR `a l’Universit ´e
Pierre et Marie CURIE
ABDERRAFIAAˆ KOUKAM Directeur de th `ese Professeur `a l’Universit ´e de technologie Belfort-Montb ´eliard
FABRICE LAURI Co-encadrant Maˆıtre de Conf ´erences `a l’Universit ´e de
technologie Belfort-Montb ´eliard
VINCENTHILAIRE Examinateur Professeur `a l’Universit ´e de technologie
Belfort-Montb ´eliard
AMMAROULAMARA Examinateur Professeur `a l’Universit ´e de Lorraine LHASSANE IDOUMGHAR Examinateur Professeur `a l’Universit ´e de Haute Alsace N◦ X X X
This work is dedicated to my dearest father, mother and wife.
A
CKNOWLEDGMENTS
This page gives me the opportunity to express my gratitude to all the people who sup-ported and assisted me.
I would like to express my deepest appreciation to my advisor, Dr. Abderrafiaa KOUKAM, who not only guides me through rigorous research, but also leads me in a positive attitude in my daily life. His leadership, passion and wisdom always influence me from the past to the future. At the same time, I would like to thank my co-advisor, Dr. Fabrice LAURI, for his continuous support and guidance in my research. His precious help and valuable remarks contributed a lot in my research progress.
I express my sincerely gratitude to Dr. Vincent CHEVRIER and Dr. Zahia GUESSOUM for accepting to review this dissertation, as well as Dr. Vincent HILAIRE, Dr. Ammar OULAMARA and Dr. Lhassane IDOUMGHAR for accepting as examinators. Thanks for their time and assistance in this work.
I also thank CSC - China Scholarship Council programme1. My research would not have been possible without its generous funding.
My special thanks go to my dear friends: Biao YIN, Chen ZHENG, Xinyi LIU, Haox-uan LIU, Zhaoyu LIU, Dongdong ZHAO, Zhongliang LI, Zhixue ZHENG, Nanfang YANG, Jianxing LIU, Bofei CHEN, You LI, Hongjian WANG, Naiyu ZHANG, Binyin YE and Fei YAN. The understanding and support that they gave to me strengthened me, and their friendship made my life wonderful. Without them, these years would have been more difficult.
Finally and most importantly, I would love to thank my family. They always stand by me, support me and encourage me. Their deepest love makes me who I am.
1http://en.csc.edu.cn
C
ONTENTS
1 Introduction 17
1.1 Context . . . 17
1.2 Objectives and Concern of This Work . . . 19
1.2.1 An Inverse PMV Optimization based Hybrid Intelligent Control for Thermal Comfort in Smart Home . . . 19
1.2.2 An Organizational Multi-Agent System based on Cooperative Parti-cle Swarm Optimization for Multi-Home Scheduling . . . 21
1.3 Plan of the document . . . 23
I State of the Art 27 2 Thermal Comfort and Energy Efficiency in Smart Homes 29 2.1 Introduction . . . 29
2.2 Principles of Thermal Comfort . . . 30
2.2.1 Thermoregulation of Human Body . . . 30
2.2.2 Thermal Comfort Parameters . . . 31
2.3 Thermal Comfort Models . . . 34
2.3.1 Predictive Mean Vote Model . . . 34
2.3.2 Adaptive Thermal Comfort Model . . . 37
2.3.3 Simplified Comfort Model . . . 40
2.4 Demand Response . . . 41
2.5 Single Home Scheduling . . . 44
2.6 Multiple Home Scheduling Problem . . . 45
2.7 Conclusion . . . 46
3 Thermal Comfort Control and Multiple Home Scheduling 47 3.1 Introduction . . . 47
3.2 Thermal Control Methods . . . 48
3.2.1 Model-Based Control . . . 48
3.2.2 Model-Free Control . . . 50
3.3 Existing Methods for Multiple Home Scheduling . . . 54
3.4 Multi-Objective Optimization . . . 55
3.5 Agent and Multi-Agent System . . . 58
3.5.1 General Concepts . . . 58
3.5.2 Agent Management Reference Model . . . 60
3.5.3 Agent Communication Language . . . 62
3.5.4 Agent Life Cycle . . . 63
3.6 OCMAS described by RIO Meta-Model . . . 64
3.7 Conclusion . . . 66
II Thermal Comfort Improvement in Smart Home 69 4 A Cyber-Physical System for Thermal Comfort Improvement 71 4.1 Introduction . . . 71
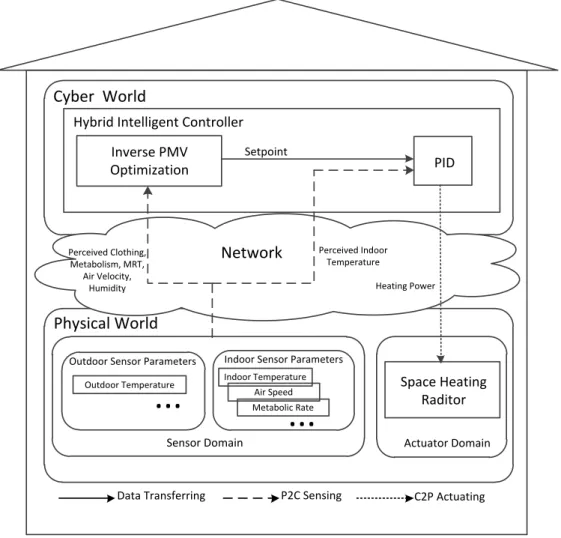
4.2 Cyber-Physical System . . . 72
4.3 Sensors and Networks . . . 74
4.4 Hybrid Intelligent Control Method . . . 76
4.4.1 Inverse PMV Optimization Module . . . 76
CONTENTS 7
4.4.2.1 Particle Swarm Optimization . . . 78
4.4.2.2 Genetic Algorithm . . . 79
4.4.2.3 Simulated Annealing . . . 80
4.4.2.4 Experiments and Comparisons . . . 81
4.4.3 PID Control Module . . . 86
4.5 Conclusion . . . 88
5 Experimental Simulation and Analysis 89 5.1 Introduction . . . 89
5.2 Building Thermal Model . . . 90
5.3 Experimentation . . . 97
5.3.1 Experimental Preparation . . . 97
5.3.2 Experimental Results and Comparison in Scenario 1 . . . 99
5.3.3 Experimental Results and Comparison in Scenario 2 . . . 102
5.4 Conclusion . . . 104
III Modeling and Scheduling Optimization of Multiple Smart Homes 107 6 Multiple Smart Home Modeling 109 6.1 Introduction . . . 109
6.2 Holon and Holarchy . . . 110
6.3 Modeling Smart Micro-Grid System as an OCMAS . . . 113
6.3.1 Organizational Structure at Agent Level . . . 113
6.3.2 Role Behaviour Description . . . 115
6.3.3 Organizational Dynamics Description . . . 118
6.4 Conclusion . . . 120
7.1 Introduction . . . 121
7.2 Objective Definition and Aggregation . . . 122
7.3 Scheduling Optimization Algorithm . . . 124
7.3.1 Cooperative Particle Swarm Optimization . . . 124
7.3.2 First Stagnation . . . 126
7.3.3 Second Stagnation . . . 128
7.4 Conclusion . . . 131
8 Simulation and Analysis 133 8.1 Introduction . . . 133
8.2 Models of Controllable Appliances . . . 134
8.2.1 Power-Shiftable Devices . . . 134
8.2.2 Time-Shiftable Devices . . . 136
8.3 Case Study . . . 137
8.3.1 Parameter Setup . . . 137
8.3.2 CPSO-R Implementation within Smart Home . . . 138
8.3.3 Running Environment . . . 140
8.4 Experimental Results and Analysis . . . 141
8.4.1 Basic Case . . . 141
8.4.2 Case without Coordination . . . 142
8.4.3 Case with Coordination . . . 143
8.5 Conclusion . . . 145
IV Conclusion 147 9 Conclusion and Perspectives 149 9.1 General Conclusion . . . 149
CONTENTS 9
9.2 Perspectives and Future Research Directions . . . 152
9.2.1 Integration of Green Energy and Storage Systems into Smart Home Systems . . . 152
9.2.2 Implementing Price Negotiation Ability for Smart Home Agent Par-ticipating in Electrical Market . . . 152
9.2.3 Implementation of Intelligent and Flexible Grouping Strategies for Smart Homes . . . 153
L
IST OF
F
IGURES
1.1 Structure of the Thesis . . . 25
2.1 PMV Calculation . . . 35
2.2 Relationship between PPD and PMV . . . 37
2.3 The Adaptive Model Mechanism, from [Yao et al., 2009] . . . 38
2.4 PMV Black Box Model . . . 39
2.5 The aPMV Model . . . 39
2.6 Time Scale of Price-Based Demand Response, based on [U.S. Department of Energy, 2006] . . . 43
2.7 Smart Homes in a District . . . 45
3.1 Classification Schematic of Control Methods . . . 50
3.2 A Block Diagram of PID Controller . . . 51
3.3 Fuzzy Logic Controller . . . 53
3.4 Pareto Front . . . 57
3.5 Agent and Environment . . . 59
3.6 Agent Management Reference Model [FIPA, 2004] . . . 61
3.7 An ACL Message Example . . . 62
3.8 Life Cycle of an Agent, based on [FIPA, 2004] . . . 64
3.9 RIO Meta-Model Example . . . 66
4.1 Cyber-Physical System . . . 72
4.2 Cyber-Physical System Architecture for Thermal Comfort Control . . . 73
4.3 Inverse PMV Optimization . . . 77
4.4 Crossover in a Typical Recombination Step . . . 80
4.5 Comparison of Searching Performance among SA, PSO-Pop-5, and GA-Pop-5 . . . 83
4.6 Comparison of Searching Performance among SA, PSO-Pop-10, and GA-Pop-10 . . . 84
4.7 Comparison of Searching Performance among SA, PSO-Pop-20, and GA-Pop-20 . . . 84
4.8 Comparison of Time Performance among All Algorithms . . . 85
4.9 Comparison of Failed Times among All Algorithms . . . 86
4.10 PID Controller . . . 87
5.1 Thermal Network . . . 91
5.2 Thermal Network of Multiple Rooms . . . 95
5.3 Surface of Fuzzy Logic Controller . . . 98
5.4 Simulation of Occupant’s Number, Metabolic Rate, and Clothing Insulation of One Week . . . 98
5.5 Simulation Result of HIC in Scenario 1 . . . 99
5.6 Simulation Result of PID Control in Scenario 1 . . . 100
5.7 Simulation Result of On/Off Control in Scenario 1 . . . 100
5.8 PMV Results of FLC and RL in Scenario 1 . . . 101
5.9 Energy Consumption Comparison in Scenario 1 . . . 102
5.10 Simulation Result of HIC in Scenario 2 . . . 103
5.11 PMV Results of PID, On/Off, FLC, and RL in Scenario 2 . . . 103
5.12 Energy Consumption Comparison in Scenario 2 . . . 104
6.1 Holon and Holarchy . . . 111
LIST OF FIGURES 13
6.3 The Organizational Structure of a Smart Micro-Grid using a Cheese-Board
Notation at Agent Level . . . 114
6.4 Role Behaviour Description of Smart Grid . . . 115
6.5 Role Behaviour Description of Smart Home . . . 116
6.6 Role Behaviour Description of Non-Shiftable . . . 116
6.7 Role Behaviour Description of Power-Shiftable . . . 117
6.8 Role Behaviour Description of Time-Shiftable . . . 118
6.9 The Organizational Sequence Diagram of the Smart Micro-Grid Organization119 7.1 Smart Homes in a District . . . 122
7.2 Convergence Difficulty Caused by Stagnation . . . 127
7.3 Convergence Difficulty Caused by Stagnation . . . 129
8.1 Dissatisfaction of Time-Shiftable Devices . . . 136
8.2 Time-Varying Price [Safdarian et al., 2014] . . . 137
8.3 Outdoor Temperature of One Day . . . 138
8.4 CPSO-R Implementation and Operation . . . 139
8.5 Screenshot of Agents and Interactions in JADE . . . 140
8.6 Experimental Results of Case 1 . . . 142
8.7 Experimental Results of Case 2 . . . 143
L
IST OF
T
ABLES
2.1 Typical Met Levels for Various Activities [ASHRAE, 2005] . . . 33
2.2 Thermal insulation for typical combinations of garments [ISO7730, 2005] . 34 2.3 ASHRAE Standard Recommendations [ASHRAE, 2005] . . . 41
3.1 FIPA ACL Message Parameters [FIPA, 2002a] . . . 63
4.1 Comparison of Bluetooth, UWB, Zigbee, and Wi-Fi Protocols, from [Lee et al., 2007] . . . 75
4.2 Parameters of Inverse PMV Optimization . . . 82
4.3 Parameters of PSO [Eberhart et al., 2000] . . . 82
5.1 Description of Symbols . . . 91
5.2 Description of Subscripts . . . 91
5.3 Parameters of Building’s Physical Components . . . 96
5.4 PMV Performance with Different Control Methods in Scenario 1 . . . 102
5.5 PMV Performance with Different Control Methods in Scenario 2 . . . 104
8.1 Parameters . . . 138
8.2 Comparison of The Three Cases . . . 144
1
I
NTRODUCTION
1.1/
C
ONTEXTUnited Nations Environment Programme [UNEP, 2014] indicates that buildings use about 40% of global energy, 25% of global water, 40% of global resources, and they emit ap-proximately 1/3 of Green House Gas (GHG) emissions. With the development of human society, environmental issues and energy crisis have drawn more and more attention. In this background, buildings can offer a great potential for achieving significant GHG emis-sion reductions and energy saving. On the other hand, people spend greater part of their time in buildings. As the quality of indoor life is increasingly considered as of paramount importance, more and more occupants constantly seek to improve comfort in their indoor living and working spaces. Meanwhile, the popularization of the concept of home office makes the productivity in residential buildings economically significant. How to manage buildings in a proper way is therefore a subject of uttermost importance.
Corresponding to the increasing demands for environment, energy, and comfort, smart home has become an active research topic. Smart home, also known as automated home or intelligent home, is the residential extension of smart building. It is an automa-tion system that incorporates a diverse of home appliances with ubiquitous computing, networking, and controlling abilities, forming an ”Internet of Things”, to provide better home life service and experience to residents [Ma et al., 2012, Ricquebourg et al., 2006]. One smart home system does not simply mean turning devices on and off automatically. It can also monitor their working states and detect the environmental changes to make better decisions. To design and implement such a system, two important factors, comfort level and energy efficiency, should be considered carefully.
Generally, there are three basic factors that determine occupants’ indoor quality of life: thermal comfort, visual comfort and indoor air quality [Dounis et al., 2009]. Among them, thermal comfort attracts our major attention, because the overriding energy consump-tion in residential buildings is caused by using auxiliary space heating systems, which accounts for 45% of total residential energy consumption [BEDB, 2014]. Hence, one re-search point is to guarantee occupants’ thermal comfort, and at the same time to mini-mize the energy cost based on advanced computing and control techniques. This can be regarded as a way to improve energy efficiency.
In addition, energy efficiency is also related to the performance of smart grid, which is a modernized electrical grid using information and communication technologies to improve the efficiency, reliability, economics, and sustainability of the production and distribution of electricity [DoE, 2015]. In this sense, smart homes can be treated as integral additions to the smart grid. Demand response is one of the key energy management strategy adopted by both of them. It refers to changes in electric usage by end-use customers from their normal consumption patterns in response to changes in the price of electricity over time, and helps to reduce peak demand, therefore tempering the need to operate high-cost and high-emission generating units as well as cutting down residents’ electricity bills [Siano, 2014]. Communication between smart homes and the smart grid allows flexible home appliances shifting working time or adjusting working power during on-peak periods to balance the usage of electricity. However, when the load management of a set of homes work selfishly, new peak-loads will occur during lower electricity price periods and they are called peak rebounds[Safdarian et al., 2014], which may damage the power grid, cause unforeseen disasters, and reduce the global profit. How to manage smart homes to avoid this negative situation to improve occupant comfort and energy efficiency is therefore the second research point.
1.2. OBJECTIVES AND CONCERN OF THIS WORK 19
1.2/
O
BJECTIVES ANDC
ONCERN OFT
HISW
ORKThe objectives and major concern of this work could be summarized as:
(i) Propose an advanced control method for space heating system in smart home;
(ii) Design and implement a cooperative intelligent system for manage-ment of multiple smart homes.
On one hand, people spend a great part of time indoor, so their satisfaction with the thermal environment is important, because it influences not only habitants’ health, that thermal discomfort has been known to lead to sick building syndrome symptoms, but also productivity of home workers [Myhren et al., 2008]. Hence, the first objective of this research is to propose an advanced method for space heating system to maintain optimal thermal comfort. After implementing this intelligent system, the indoor air temperature can fit occupant’s states dynamically and automatically. Meanwhile, energy wasting through overheating is avoided.
On the other hand, a smart home always contains a variety of household appliances besides space heaters. Without coordination, selfishly operating these devices of multiple homes at the same time will make the load on the main grid extremely high. Even with the help of demand response enabled by time-varying prices, severe peak rebounds at periods with lower prices may happen. Therefore, the second objective of this research is to design a cooperative system to optimize the scheduling of the controllable devices in multiple smart homes, achieving the trade-off between minimum electricity bill and maximum consumer’s satisfaction and the utility of main grid.
1.2.1/ AN INVERSE PMV OPTIMIZATION BASED HYBRID INTELLIGENT CON
-TROL FOR THERMAL COMFORT IN SMARTHOME
In literature, thermal comfort is the condition of mind that expresses satisfaction with the thermal environment and is assessed by subjective evaluation [ASHRAE, 2004]. A hu-man being’s thermal sensation is mainly related to the thermal balance of his or her body
as a whole. This balance is influenced by physical activity and clothing insulation, as well as many environmental parameters. As a result of individual differences, specifying a thermal environment to satisfy everybody is impossible, for there will always be a per-centage of dissatisfied occupants. But it is possible to specify environments predicted to be acceptable by a certain percentage of the occupants. The Predictive Mean Vote index (PMV) derived by P.O. Fanger [ISO7730, 2005] stands among the most recognized thermal comfort models, which predicts the mean value of the votes of a large group of persons based on the heat balance of the human body.
Based on the PMV thermal comfort model and advanced networking, computing and sensor technologies, improving thermal comfort in smart homes is a practical example of employing Cyber-Physical Systems (CPS). CPSs integrate computation, networking and physical processes, in which embedded computers and networks monitor and control the physical processes with feedback loops where physical processes affect computations and vice versa [Lee, 2006]. Just like the way that Internet has changed how human inter-act with each other, CPSs will change how human interinter-act with the physical world around them [Rajkumar et al., 2010]. When there are occupants in a smart home, the prolifera-tion of powerful but low-cost sensors make it possible to capture thermal comfort related parameters from the physical world. Through ubiquitous networking technologies the in-formation can be exploited by widespread high-capacity computing units to intelligently control space heating devices in order to obtain superb thermal comfort for occupants.
Before bridging the PMV model with the heating system, more efforts are needed. The regular PMV computation is a function which takes environmental-dependent variables and personal-dependent variables as inputs, then calculates a scalar number indicating thermal comfort as the output. Nonetheless, in this research, we propose to inversely employ the PMV model, that is to say in this situation air temperature is set to be the output, while an optimal thermal comfort value with the other former inputs are set to be inputs. Therefore, by inversely computing the PMV model, an optimal air temperature preference based on the present environmental and personal states can be obtained.
However, because PMV is non-linear and non-convex [Ma, 2013], the inverse computa-tion of PMV is also non-linear and non-convex. Hence, the idea of using meta-heuristic algorithms to search the desired solutions, which are optimal air temperatures in this work, is natural. The Particle Swarm Optimization (PSO) algorithm, which is originally
1.2. OBJECTIVES AND CONCERN OF THIS WORK 21
proposed by [Kennedy et al., 1995, Shi et al., 1998] and derived from simulating social behavior as a stylized representation of the movement of organisms in a bird flock or fish school, has turned out to be an efficient solution. Based on this algorithm, an optimal or quasi-optimal indoor temperature can be acquired. By setting this temperature value as the preference for the space heating system, which uses Proportional-Integral-Derivative (PID) to regulate the heating power, the room temperature can be controlled and the thermal comfort can be guaranteed.
In order to validate the designed system and control method, a mathematical thermal model is used to simulate thermal variation of a smart home. Based on the heat balance rule [Achterbosch et al., 1985], the thermal dynamics of a room can be expressed as a thermal network, which is analogous to an electric circuit network by regarding heat flow as electric current, and temperature as electric potential respectively. Then temperature changes of different components of the room, including room air, wall, roof, and floor can be described by first order differential equations. Based on this model, a series of computer simulations are conducted. The results indicate the proposed CPS can both provide better thermal comfort and consume less energy compared with the systems adopting traditional control methods and intelligent control methods presented in the state of the art.
1.2.2/ AN ORGANIZATIONAL MULTI-AGENT SYSTEM BASED ON COOPERATIVE
PARTICLE SWARM OPTIMIZATION FORMULTI-HOME SCHEDULING
Towards further improving energy efficiency of individual homes and the grid utility, an architecture that includes a set of smart homes and a smart grid is considered. In fact, this architecture is a holarchy, which is a hierarchical structure composed of whole-part constructs, called holons, as substructures [Wilber, 1998]. By taking the advantage of smart grid, different homes can communicate with the grid so that bidirectional informa-tion exchange and energy flow are both possible between them. Each home is composed of a variety of electric appliances. These devices consume energy, and provide different services. According to their controllability, these appliances are divided into fixed devices, which have fixed load profiles such as electric oven, refrigerator, TV, etc., and controllable devices including power-shiftable devices and time-shiftable devices. Power-shiftable de-vices represent these dede-vices whose working power is changeable to fit variations of
environmental status, and at some circumstances they can decrease the power at the range that occupants can accept to reduce load on the grid. Time-shiftable devices are these appliances that can shift the power consumption time within a preferred working period and when they start to work they are in a constant power for a certain period.
The system considered is complex, since different smart homes are geographically dis-tributed, each of them is an autonomous entity composed of diverse devices to fulfil oc-cupants’ various requirements, and moreover, to balance the total load on the grid it needs them to cooperate with each other. In order to model this system, a Multi-Agent System (MAS) paradigm is used, which is a computerized system composed of multiple interacting intelligent agents for modeling autonomous, distributed, dynamic and complex systems. In this paradigm, components of different architecture levels could be designed as agents, such as smart grid agent, smart home agent, space heating agent, washing machine agent, etc.. However, as Jennings and Wooldridge have pointed out, Agent Centered Multi-Agent Systems (ACMAS) may suffer some drawbacks, such as the pat-terns and outcomes of the interactions are inherently unpredictable and predicting the behavior of the overall system based on its constituent components is extremely difficult, when engineering large systems [Jennings, 2000]. Therefore, an Organization Centered Multi-Agent System (OCMAS) is preferred to model the system.
In a smart home, different electric appliances are operated to work or planed to work in or-der to satisfy occupants’ requirements. When they work properly, occupants’ comfort can be guaranteed, whereas running defectively or unreasonably may bring dissatisfaction. Therefore one of the system objectives is to minimize the dissatisfaction caused by these appliances in each smart home. Furthermore, demand response enabled by time-varying prices can propel customers to change their consumption patterns for a more economical purpose. Hence, decreasing the household cost of electricity usage should be consid-ered in the system. However, a non-coordinated response of customers for time-varying prices may lead to severe peak rebounds at periods with lower prices. Towards flattening the total load profile, the variance of energy consumption on the main grid need to be min-imized. Corresponding to these three situations, the objective function of each household is to minimize the integration of these three sub-objectives.
Based on the objective function, device agents in this system need to find an optimal or quasi-optimal policy to control the corresponding physical appliances, for example, space
1.3. PLAN OF THE DOCUMENT 23
heating agent should find the appropriate heating power and washing machine agent should find the suitable operation time. As the problem involves multiple households, and each of them contains multiple controllable appliances, using the standard PSO implies that a full dimensional vector should be constructed for each particle. This will cause the ”two steps forward, one step back” problem [van den Bergh et al., 2004], which can make the convergence very hard. In order to solve this problem that involves a large number of decision variables, the Cooperative Particle Swarm Optimization (CPSO) algorithm proposed in [van den Bergh et al., 2004] is adopted and developed.
1.3/
P
LAN OF THE DOCUMENTAfter the brief overview of the proposals presented in this thesis, this section introduces the overall organization of this document. According to the objectives described in Section 1.2, this thesis is organized into three main parts. The various chapters in this document and their respective organizations are summarized in Figure 1.1.
Thefirst part, including Chapter 2 and Chapter 3, presents the state of the art in terms of context, problem and solution.
The second part, including Chapters 4 and 5, presents a cyber-physical system with an inverse PMV optimization based hybrid intelligent control method to improve thermal comfort in smart home.
Thethird part, including Chapters 6, 7, and 8, presents an organization centered multi-agent system adopting cooperative particle swarm optimization for multi-home schedul-ing.
The detail of each chapter is described below.
Chapter 2 presents the state of the art in terms of context and problem this work is covered, including the context related to thermal comfort and thermal comfort models. When a set of smart homes are considered, the multiple home scheduling problem is introduced.
Chapter 3 presents the state of the art in terms of solutions for thermal comfort improve-ment and multiple home scheduling.
Chapter 4 presents our proposed cyber-physical system with a hybrid intelligent control approach for thermal comfort improvement.
Chapter 5 presents a building thermal model, which is based on the heat balance theory and expressed by an electric circuit network. By using this model, a series of simulations are conducted to verify the proposed system and control method.
Chapter 6 presents a holarchy of smart grid system, of which the two bottom layers attract our more attention and are modelled by an organization centered multi-agent system.
Chapter 7 describes the objective of the system, which belongs to a multi-objective op-timization problem. A cooperative particle swarm opop-timization algorithm is proposed to solve this problem.
Chapter 8 presents the models of some controllable devices and a case study for the proposed system and method.
1.3. PLAN OF THE DOCUMENT 25
Part 1
State of the Art
Chapter 2
Thermal Comfort and Energy Efficiency in Smart Homes
Chapter 3
Thermal Comfort Control and Multiple Home Scheduling
Part 2
Thermal Comfort Improvement in Smart Home
Chapter 4
A Cyber-Physical System for Thermal Comfort Improvement
Chapter 5
Experimental Simulation and Analysis
Part 3
Modelling and Scheduling Optimization of Multiple Smart Homes
Chapter 6
Multiple Smart Home Modelling
Chapter 7
Residential Scheduling Optimization
Chapter 8
Simulation and Analysis
I
S
TATE OF THE
A
RT
2
T
HERMAL
C
OMFORT AND
E
NERGY
E
FFICIENCY IN
S
MART
H
OMES
Contents
2.1 Introduction . . . . 29 2.2 Principles of Thermal Comfort . . . . 30
2.2.1 Thermoregulation of Human Body . . . 30 2.2.2 Thermal Comfort Parameters . . . 31
2.3 Thermal Comfort Models . . . . 34
2.3.1 Predictive Mean Vote Model . . . 34 2.3.2 Adaptive Thermal Comfort Model . . . 37 2.3.3 Simplified Comfort Model . . . 40
2.4 Demand Response . . . . 41 2.5 Single Home Scheduling . . . . 44 2.6 Multiple Home Scheduling Problem . . . . 45 2.7 Conclusion . . . . 46
2.1/
I
NTRODUCTIONNowadays, smart home attracts more and more attention from research fields. When only considering an individual home, much effort of this work is made on the improve-ment of thermal comfort. Therefore, how human body reacts to environimprove-mental changes to maintain thermal comfort and what are the primary parameters affecting thermal com-fort are studied. After that, in order to evaluate thermal comcom-fort according to present
conditions, three thermal comfort models are introduced and compared. However, only thinking about thermal comfort is not enough. Towards further improving energy efficiency of individual homes and the grid utility, demand response is relayed on. Although much work has already been carried out to activate demand response potentials in individual smart home systems, severe peak rebounds may happen without a global consideration. Therefore, a set of neighbouring smart homes in a district are concerned and the problem of multiple home scheduling is described.
This chapter is organized as follows. Section 2.2 gives the principal knowledge about thermal comfort. Section 2.3 introduces three popular thermal comfort models. Demand response is introduced in Section 2.4, and based on this scheme some related work of single home scheduling is presented in 2.5. In Section 2.6, the multiple home scheduling problem is introduced.
2.2/
P
RINCIPLES OFT
HERMALC
OMFORTAlthough there has been much effort to define and measure thermal comfort, it is still far from fully understood. According to the American Society of Heating, Refrigeration and Air-Conditioning Engineers (ASHRAE), thermal comfort is the condition of mind that expresses satisfaction with the thermal environment and is assessed by subjective evalu-ation [ASHRAE, 2004]. In the following subsections the most important knowledge about thermal comfort will be introduced.
2.2.1/ THERMOREGULATION OF HUMANBODY
Human being is an endotherm and his normal physiological life is maintained by a nearly constant internal temperature. Due to his metabolic activities, the human body contin-uously produces heat, which must be dissipated into the environment to prevent hyper-thermia, whereas excessive heat loss may result hypothermia. Therefore, there must be a physiological mechanism to handle this. The hypothalamus is the central control organ as a thermostat for body temperature control, of which the core temperature Tcoreis kept
generally close to 37◦Cwhile the skin temperature T
skin (generally has an average value
2.2. PRINCIPLES OF THERMAL COMFORT 31
The hypothalamus can be informed the thermal stimulus by electrical impulses from vari-ous thermal receptors in the brain and the skin [Candas, 1999]. According to the sensory information, two general mechanisms, behavioural and physiological ones, used to keep the thermal equilibrium of the human body, can be triggered. Behavioural responses are rapid adaptive actions, such as keeping far away from heat sources, changing clothes, turning on/off or up/down space heating systems, etc..
Physiological responses are much more complex processes and occur as internal body regulation. They can be summarized as follows. (1) When the core temperature is higher than the setpoint, redundant heat inside the body will be brought to skin to dissipate with a much higher rate due to the increased blood flow caused by vasodilatation of vessels. Sweating occurs to cool down the skin by evaporations, which increases the heat exchange rate between the internal body and the skin. (2) When the body temperature drops below the setpoint, vasoconstriction, which is aroused by heart rate decreasing and blood flow reducing, and pore contraction can both minimize the internal heat loss, and at the same time the increasing of muscle tension, known as shivering, can produce internal heat. Obviously, thermal comfort of human body is decided by many factors.
2.2.2/ THERMAL COMFORT PARAMETERS
According to [ASHRAE, 2004], there are six parameters that mainly influence thermal comfort through heat exchange between human body and the environment, including air temperature, mean radiant temperature, humidity, air velocity, metabolic rate, and clothing insulation.
Air Temperature
Air temperature Tairis the time and location averaged temperature of the occupant’s
sur-rounding compound [Kranz, 2011]. It can greatly influence the heat exchange rate on the skin, the thermal equilibrium, and then the thermal comfort of a person. In much work, air temperature is chosen as the unique index to express thermal comfort.
Mean Radiant Temperature
Mean radiant temperature (MRT) is a hypothetical parameter and is defined as ”the tem-perature of an uniform black enclosure that exchanges the same amount of thermal ra-diation with the occupant as the actual enclosure” [ASHRAE, 2004]. Rara-diation plays an
important role in the heat exchange between the human body and the environment. It can be estimated from measured values of the temperature of the surrounding surfaces and their positions with respect to the occupant:
TMRT4 = N X i=1 T4s f iFp−i, (2.1) where
TMRT is the mean radiant temperature in◦C,
N is the number of surfaces surrounding the occupant, Ts fi is the temperature of surface i in
◦C,
Fp−i is the angle factor between a person and the surface i.
Humidity
Humidity refers to the moisture content of the air and it affects evaporation of water from sweating surfaces of the skin [ASHRAE, 2004]. Although it may indirectly influence occu-pant’s comfort that too low level of humidity will cause dry nose, skin and eyes while too high level of humidity will lead to sensation of stickiness, it plays a minor role when an environment is close to thermal comfort, since dissipation through sweat evaporation can be neglected [Devonshire, 2002]. For example, in general a 10% change in humidity has the same influence as a 0.3◦C change of air temperature, while at low air temperatures
the thermal comfort can be even considered as independent of humidity.
Air Velocity
Air velocity can influence heat loss through the skin. Convective heat transfer is roughly proportional to the square root of mean air velocity [ASHRAE, 2004]. On one hand, a rise in air velocity can contribute to compensate for thermal discomfort caused by relatively higher air temperature as a pleasant breeze. On the other hand, it may also lead to local thermal discomfort. Draught, that is defined as an unwanted local cooling of the body by air motion, is the most common cause of local discomfort [ISO7730, 2005].
Metabolic Rate
Metabolism exists in a human body through lifetime. The metabolic rate, which varies over a wide range and is in unit of met (1 met = 58.1W/m2), quantifies the transformation rate from chemical energy into heat, that is dissipated to the environment, and mechanical
2.2. PRINCIPLES OF THERMAL COMFORT 33
Table 2.1: Typical Met Levels for Various Activities [ASHRAE, 2005]
Activity (met) Sleeping 0.7 Seated, quiet 1.0 Standing, relaxed 1.2 Filing, seated 1.2 Filing, standing 1.4 Walking about 1.7 Walking (0.9 m/s) 2.0 Cooking 1.6 to 2.0 Housecleaning 2.0 to 3.4 Exercise 3.0 to 4.0
work within an organism. Being different states and doing different work will lead to various metabolic rates. The exemplary characteristic metabolic rates for some selected activities are shown in Table 2.1.
Clothing Insulation
Clothing insulation is the thermal insulation provided by clothing, the adjustment of which directly affects on the heat balance of a person, and therefore has a substantial impact on thermal comfort. According to [ASHRAE, 2005], the intrinsic clothing insulation Rcl can
be calculated as follows: Rcl= Tsk− To Q − 1 h · fcl (2.2) with
Tsk is the skin temperature in◦C,
To is the operative temperature in◦C,
Q is the body heat loss in W/m2,
h is the radiative heat transfer coefficient in W/m2· K,
fcl is the clothing area factor.
Operative temperature is the uniform temperature of an imaginary black enclosure in which an occupant would exchange the same amount of heat by radiation plus convection as in the actual non-uniform environment [ASHRAE, 2004]. Clothing insulation Iclcan be
calculated as Icl = Rcl/0.155 in a unit of clo, so 1clo = 0.155m2 · K/W. Some typical
Table 2.2: Thermal insulation for typical combinations of garments [ISO7730, 2005]
Daily wear clothing (clo)
Panties, T-shirt, shorts, light socks, sandals 0.3 Underpants, shirt with short sleeves,
light trousers, light socks, shoes 0.5 Panties, petticoat, stockings, dress, shoes 0.7 Underwear, shirt, trousers, socks, shoes 0.7 Panties, shirt, trousers, jacket, socks, shoes 1.0 Panties, stockings, blouse, long skirt, jacket, shoes 1.1
Underwear with long sleeves and legs, shirt,
trousers, V-neck sweater, jacket, socks, shoes 1.3 Underwear with short sleeves and legs, shirt,
trousers, vest, jacket, coat, socks, shoes 1.5 Underwear with short sleeves and legs, shirt,
trousers, jacket, heavy quilted outer jacket, socks, shoes 2.0 Underwear with long sleeves and legs, shirt,
trousers, thermo-jacket, overalls with heave quilting, socks, shoes 2.5
2.3/
T
HERMALC
OMFORTM
ODELSAfter knowing the main parameters that influence thermal comfort, how to evaluate ther-mal comfort according to present conditions is also important. Therther-mal comfort model-ing basically started in the 1960s mainly for use in military and aerospace applications [Kranz, 2011]. In this section, three thermal comfort models are introduced, namely pre-dictive mean vote model, adaptive thermal comfort model, and simplified comfort model.
2.3.1/ PREDICTIVEMEAN VOTE MODEL
The Predictive Mean Vote index (PMV) derived by P.O. Fanger [ISO7730, 2005] stands among the most recognized thermal comfort models, which predicts the mean value of the votes of a large group of persons on the 7-point thermal sensation scale, based on the heat balance of the human body. The 7-point thermal sensation scale separately indi-cates -3 for cold, -2 for cool, -1 for slightly cool, 0 for neutral or comfortable, +1 for slightly warm, +2 for warm, and +3 for hot. Moreover, the International Organization for Stan-dardization (ISO) recommends maintaining PMV at level 0 with a tolerance of 0.5 as the best thermal comfort. The calculation of PMV is complicated, as expressed from Equa-tion 2.3 to EquaEqua-tion 2.6. It is affected by the six variables as we discussed separately in detail before. Among them, it includes four environment-dependent variables: air
temper-2.3. THERMAL COMFORT MODELS 35
ature, mean radiant temperature, humidity and air velocity, and two personal-dependent variables: metabolic rate and clothing insulation, as shown in Figure 2.1.
PMV
Calculation
Air Temperature MRT Humidity Air Velocity Metabolic Rate Clothing Insulation Environmental-Dependent Variables Personal-Dependent Variables+3 (Hot)
+2 (Warm)
+1 (Slightly Warm)
0 (Neutral)
-1 (Slightly Cool)
-2 (Cool)
-3 (Cold)
Figure 2.1: PMV Calculation PMV =[0.303 · exp(−0.036 · M) + 0.028] · {(M − W) − 3.05 · 10−3· [5733 − 6.99 · (M − W) − pa] − 0.42 · [(M − W) − 58.15] − 1.7 · 10−5· M · (5867 − pa) − 0.0014 · M · (34 − Tair) − 3.96 · 10−8· fcl· [(tcl+ 273)4− (TMRT + 273)4] − fcl· hc· (tcl− Tair)} (2.3) tcl=35.7 − 0.028 · (M − W) − Icl· {3.96 · 10−8· fcl· [(tcl+ 273)4− (TMRT + 273)4] + fcl· hc· (tcl− Tair)} (2.4) hc= 2.38 · |tcl− Tair|0.25 for 2.38 · |tcl− Tair|0.25> 12.1 ·
√ vair
12.1 · √vair for 2.38 · |tcl− Tair|0.25< 12.1 ·
√ vair
fcl= 1.00+ 1.290Icl for Icl6 0.078 m2· K/W 1.05+ 0.645Icl for Icl> 0.078 m2· K/W (2.6) where
M is the metabolic rate in W/m2,
W is the effective mechanical power in W/m2,
Icl is the clothing insulation in m2· K/W,
fcl is the clothing surface area factor,
Tair is the air temperature in◦C,
TMRT is the mean radiant temperature in◦C,
vair is the relative air velocity in m/s,
pa is the water vapour partial pressure in Pa,
hc is the convective heat transfer coefficient in W/(m2· K),
tcl is the clothing surface temperature in◦C.
When calculating PMV, a relative humidity of 50% is often chosen, since the influence of humidity on thermal sensation is small at moderate temperatures close to comfort.
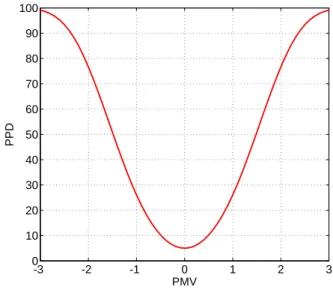
The PMV predicts the mean value of the thermal sensation of a population exposed in the same environment. As people have different sensation of comfort, individual votes are scattered around this mean value, so it is more useful to consider whether or not people will be satisfied. The Predicted Percentage of Dissatisfied (PPD) is an index that establishes a quantitative prediction of the percentage of thermally dissatisfied people who feel too cool or too warm, as expressed below:
PPD= 100 − 95 · exp(−0.03353 · PMV4− 0.2179 · PMV2) (2.7) The relationship between PPD and PMV is shown in Figure 2.2.
2.3. THERMAL COMFORT MODELS 37 -3 -2 -1 0 1 2 3 0 10 20 30 40 50 60 70 80 90 100 PMV P P D
Figure 2.2: Relationship between PPD and PMV
2.3.2/ ADAPTIVE THERMAL COMFORT MODEL
Unlike the PMV model, which is developed by using the principle of heat balance and ex-perimental data collected in a controlled climate chamber under steady state conditions, the adaptive thermal comfort model is derived from hundreds of field studies with the idea that occupants can adapt to their thermal environment in free-running buildings (i.e. not heated or cooled) to some extend through dynamically interactions. The adaptations have been summarized by [De Dear, 2004] into three categories: behavior adjustments, physiological adaptations, and psychological adjustments.
Behavioural adjustments imply occupants can control their thermal environment by means of clothing, operable windows, fans, sun shades, etc. [De Dear et al., 1998]. In short, if a change occurs such as to produce discomfort, people react in ways which tend to restore their comfort [Nicol et al., 2002].
Physiological adaptations refer to body mechanisms to survive in drastic temperature environment. For example, in a cold environment the body utilizes vasoconstriction, while in a warm environment the body utilizes vasodilatation.
Psychological adjustments mean reactions to sensory information due to past experi-ence and expectations. Personal comfort setpoints are not constant, and habituation and expectation can alter thermal perceptions [De Dear, 2004].
In order to achieve thermal comfort, occupants will have these adaptive approaches to adapt to their natural environment. Therefore, compared with the space with heating or cooling systems, people in free-running buildings can endure a broader range of temper-ature variation [Yao et al., 2009]. The mechanism of the thermal comfort adaptive model is shown in Figure 2.3.
Outdoor Climates Human Physiology & Thermal Sensation
Actual Thermal Sensation of Human Body Behavioural Adaptations Psychological Adaptations Indoor Climates Thermal Expectations Social, Economical and Cultural Background Previous Thermal Experiences Physical Stimuli Adaptations
Figure 2.3: The Adaptive Model Mechanism, from [Yao et al., 2009]
Because occupants’ behavioural, physiological and psychological reactions are ex-ceedingly complicated, the ”Black Box” method, which is widely used in cybernetics [Raven, 1978], is employed to estimate occupants’ thermal sensation. The word ”Black” here means the full operational details remain unknown. This method tries to build the log-ical and statistlog-ical relationships between information input and output of the box. Based on it, the complex system can be described and understood, and the output can be pre-dicted from the view of the general reactions of the system.
2.3. THERMAL COMFORT MODELS 39
shown in Figure 2.4 and the PMV can be estimated by Equation 2.8.
PMV = G × δ (2.8)
where δ is the combination of the six parameters, and G is a estimation function.
G
δ
PMV
Figure 2.4: PMV Black Box Model
Based on the adaptive model, the PMV model and the ”Black Box” theory, the authors of [Yao et al., 2009] have proposed the Adaptive Predicted Mean Vote (aPMV) model to index thermal comfort in free-running buildings, considering that psychological adap-tive self-regulation plays a significant role in determining occupants’ thermal sensations [De Dear et al., 1998]. In this model, psychological and behavioural adaptations act as a negative adaptive feedback, denoted by Kδ, while physiological adaptation is contained
within the ”Black Box” G, as can be seen in Figure 2.5.
G
δ
aPMV
K
δ
-Figure 2.5: The aPMV Model
aPMV = G × (δ − aPMV × Kδ) (2.9)
aPMV = G ×δ
1+ G × Kδ (2.10)
where Kδis the influence of occupants’ adaptations.
Substituting Equation 2.8 into Equation 2.10, then
aPMV = PMV/(1 + PMV × Kδ
δ ) (2.11)
Assuming λ= Kδδ, Equation 2.11 can be written as: aPMV = PMV
1+ λ × PMV (2.12)
where λ is called ”adaptive coefficient”.
The advantage of the aPMV model is it not only considers the six parameters that the PMV model takes into account, but also occupants’ behavioural and psychological adap-tations which are corresponding to behaviour habit, lifestyle, local climate, culture, social background, etc.. Therefore, it is a more accurate index model. It can be seen that when λ is equal to zero, the aPMV is equal to PMV representing no adaptive action. How-ever, on one hand the adaptive coefficient λ is difficult to estimate in reality, and on the other hand the PMV model can be applied to buildings with heating and cooling systems, while the adaptive model can be generally applied only to free-running buildings where no mechanical systems have been installed [ASHRAE, 2004]. Hence, the PMV model has higher practicality in both research fields and industrial applications.
2.3.3/ SIMPLIFIED COMFORT MODEL
To minimize the complexity of the control problem, it can depend on simplified but descrip-tive comfort indices with a few variables as inputs. One example is the thermal comfort index called ”effective temperature”, which is developed by ASHRAE to express the com-bined effect on comfort of air temperature, humidity, and air speed [Givoni, 1998]. Its extended version is named Standard Effective Temperature (SET), which normalizes
hu-2.4. DEMAND RESPONSE 41
Table 2.3: ASHRAE Standard Recommendations [ASHRAE, 2005] Operative temperature Acceptable range
Summer 22◦C 20 - 23◦C
Winter 24.5◦C 23 - 26◦C
midity, air velocity as well as the two personal variables, clothing insulation and metabolic rate. Specifically, SET is the temperature of an imaginary environment at 50% relative humidity, < 0.1m/s air speed, and mean radiant temperature equal to air temperature, in which the total heat loss from the skin of an imaginary occupant with an activity level of 1.0met and a clothing level of 0.6clo is the same as that from a person in the actual environment, with actual clothing and activity level [ASHRAE, 2004]. In real applications, SET has been widely used to index thermal comfort or discomfort [Ye et al., 2003].
Another example of simplified comfort model is defined as upper and lower bounds on de-tected indoor temperature, and this comfort index is used in [Ma et al., 2011, Nagai, 2002, Oldewurtel et al., 2010, Braun, 1990, Kelman et al., 2013]. ASHRAE has recommenda-tions for operative temperature and acceptable range that can be regarded as upper and lower comfort bounds in summer and winter separately, as shown in Table 2.3. These conditions are assumed for a relative humidity of 50%, air speed < 0.15m/s, mean radiant temperature equal to air temperature and a metabolic rate of 1.2met. Clothing insulation is defined as 0.9clo in winter and 0.5clo in summer.
As can be seen, the simplified comfort models can be implemented easily, but they can not index thermal comfort precisely and dynamically with the change of personal states. Moreover, due to their impreciseness, energy dissipation may occur via overheat-ing. Based on the analysis of these three types of comfort model, PMV outperforms the others and thus is selected as the thermal comfort model in our work.
2.4/
D
EMANDR
ESPONSEAlthough occupants continuously seek to improve their thermal comfort, they have to consider the economic factor. Moreover, as indicated in the preceding sections, people will accept or even adapt to an uncomfortable environment if the level of uncomfortable-ness is limited to acceptable scope. Therefore, a reasoned balance between comfort and cost should be taken into consideration. Actually a smart home contains a variety
of electric appliances providing various services for occupants not only space heating devices. These electric appliances can be divided into three categories: fixed device, power-shiftable device and time-shiftable device. By reasonably shifting working power and working time of the latter two types of devices, energy efficiency can be improved, which is beneficial to both customers and producers of electricity.
In order to motivate occupants change their consumption patterns to coordinate with generating features of electricity producers, a program named demand response, that changes the price of electricity over time, is established. Demand response ensures ef-ficient energy consumption and production by decreasing the level of energy use during peak demand or high electricity price periods. This in turn guarantees grid reliability as well as protects the profit of consumers [Barbose et al., 2004, Sæle et al., 2011].
Thanks to the emergence of smart grid technology with the ability of bidirec-tional information and energy communication, Advanced Metering Infrastructure (AMI) installed in smart home, and dedicated embedded control systems [Hart, 2008, Giacomoni et al., 2011], demand response is playing the role as an efficient energy man-agement strategy and has attracted much attention from research fields.
Generally there are two basic categories of demand response: namely price-based demand response and incentive-based demand response [U.S. Department of Energy, 2006]:
* Price-based demand response programs charge customers time-varying elec-tricity rates that reflect the value and cost of elecelec-tricity in different time periods.
* Incentive-based demand response programs are designed such that customers can receive extra payments to reduce their loads during peak periods.
Since the incentive-based demand response is too flexible that different specific programs can be designed according to features of different regions, price-based demand response draws more attention of academic research. So our work is based on the price-based demand response.
Generally, there are different options of price-based demand response made by policy-makers, and the most commonly implemented options are described as follows.
2.4. DEMAND RESPONSE 43
vs. off-peak period, and are typically pre-defined for a period of several months or years.
• Real-Time Pricing (RTP), whereby electricity prices fluctuate hourly reflecting the costs of generating and/or consuming power at the wholesale level, and are typically known to customers on a day-ahead or hour-ahead basis.
• Critical Peak Pricing (CPP), whereby TOU is in effect except for certain peak days when CPP events are triggered by system contingencies.
years system planing months operational planning day-ahead economic scheduling day-of economic dispatch < 15 min energy efficiency time-of-use rates (TOU) day-ahead hourly pricing (RTP) real-time hourly pricing (RTP)/CPP load commitment
timescales power & load
reduction delivery Price-Based Demand Response
Figure 2.6: Time Scale of Price-Based Demand Response, based on [U.S. Department of Energy, 2006]
Figure 2.6 shows the time scales of different price-based demand response options.
Our work focuses on day-ahead RTP as opposed to hour-ahead RTP, TOU and CPP, since hour-ahead RTP creates higher uncertainty for consumers and is less attractive from an user adoption perspective[Joe-Wong et al., 2012], TOU is simple and has been widely implemented but it is static and carries few real-time information, and CPP is hardly implemented due to customer and political resistance to very high prices [Weston, 2013].
2.5/
S
INGLEH
OMES
CHEDULINGIn recent years, great effort has been made to activate demand response potentials of residential customers and incorporate it in smart home systems to minimize the total electricity payment. In the work of [Mohsenian-Rad et al., 2010a], an energy schedul-ing framework for automatically and optimally operatschedul-ing appliances in a household, while considering the trade-off between minimum electricity bill and maximum consumer’s util-ity is presented. The authors model the problem as a linear mixed integer program-ming problem and solve it by using a specific optimization software. To address the similar residential appliance management problem, an optimization model, which is ma-terialized into a simple linear programming problem, is developed in [Conejo et al., 2010] for individual consumers to adjust their decisions in response to time varying electricity prices. To manage the data uncertainty that may introduce considerable distortion on the solution, a robust optimization approach is employed. [Kumaraguruparan et al., 2012] map the electricity bill minimization problem under dynamic day-ahead price environ-ment to the well known multiple knapsack problem which enables cheap and efficient solutions to the scheduling problem. In the work of [Chen et al., 2012], a real-time price-based demand response management model for residential appliances is proposed. The applications of this management model can be embedded into smart meters, employ-ing scenario-based stochastic optimization and robust optimization approaches to deter-mine the optimal operation considering future electricity price uncertainties. The authors of [Chen et al., 2013b] propose a stochastic energy consumption scheduling algorithm, which takes the time-varying pricing information, distributed renewable generation, and the customer-defined target trip rate as inputs, and generates an operation schedule to minimize the monetary expense. A decision-support tool based on particle swarm op-timization is presented in [Pedrasa et al., 2010] to help residential consumers optimize their acquisition of electrical energy services. With this approach, the minimization of monetary expense and the maximization of user comfort are balanced based on user-defined monetary benefits for electric services.
However, all of them only think about the scheduling of electric devices in a single smart home case, that is to say the smart home with these approaches merely considers to optimize its profit by reducing the usage of flexible appliances during peak-load hours or deferring them to low price periods. In general, it ignores the states of its neighbours.
2.6. MULTIPLE HOME SCHEDULING PROBLEM 45
As indicated in [Li et al., 2012], it shows that when the load management of a set of homes work selfishly, new peak-loads will occur during lower electricity price periods and it is called peak rebounds[Safdarian et al., 2014] which may also damage the power grid, cause unforeseen disasters, and reduce the global profit. This accentuates the necessity of an effective global demand response management scheme to ensure the coordination among them.
2.6/
M
ULTIPLEH
OMES
CHEDULINGP
ROBLEMWith the development and deployment of smart grid, bidirectional home-to-home and home-to-grid communications can be achieved. This provides an opportunity to realize the optimization of multiple home scheduling based on demand response.
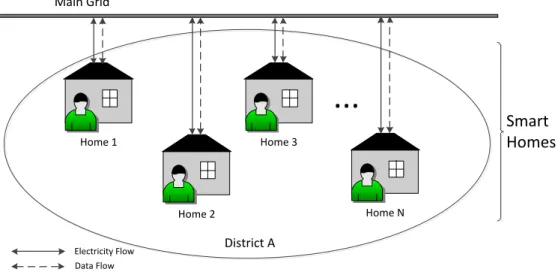
18150mm
...
Main Grid District A Home N Home 1 Home 2 Home 3 Electricity Flow Data Flow Smart HomesFigure 2.7: Smart Homes in a District
Assume that in a District A, there are N smart homes connecting to the main grid forming a smart micro-grid to exchange information and electricity, as seen in Figure 2.7. This complex system has four characteristics: (1) distributed, smart homes are dispersed in nature, and they link with the smart grid using bi-directional connections; (2) hetero-geneous, different homes have different kinds and numbers of electric appliances with
various usage habits; (3) intelligent, many of the appliances are controllable and the smart home is intelligent to manipulate them partly or fully leaving occupants to do other more beneficial things; (4) autonomous, smart homes are able to receive information from the main grid, such as time-varying electricity prices and the variance of total load on the main grid to make decisions themselves to maximize their occupants’ profits.
In a smart home, there are various types of electric appliances. Some of them are con-trollable, so when they plug in, the smart home should recognize them and take control of them; while some are not, but the smart home should also know some information about them, such as their working power. For the controllable devices, their working status need to be optimized to provide proper services for occupants and guarantee their com-fort. All the smart homes in the district need to communicate with the grid to exchange information, like time-varying electricity prices. Based on the information, operation and scheduling of controllable devices can be balanced between increasing quality of service and reducing the household cost of electricity usage. Moreover, these smart homes need to cooperate to flatten the variance of total load on the main grid to improve the energy efficiency of generating units.
2.7/
C
ONCLUSIONThis chapter has presented the state of the art in terms of context and problem that our work involves. For thermal comfort, it is mainly influenced by six parameters: air temperature, mean radiant temperature, humidity, air velocity, metabolic rate, and clothing insulation, and the PMV thermal comfort model has turned out to be better than the other models to evaluate it. When the problem is extended that contains multiple smart homes with each equipped a variety of electric devices, the non-coordinated single home scheduling based on demand response may cause peak rebounds. Hence, it should be considered as a multiple home scheduling problem which need a coordinated approach to solve. In the next chapter, solutions for thermal comfort control and multiple home scheduling will be discussed.
3
T
HERMAL
C
OMFORT
C
ONTROL AND
M
ULTIPLE
H
OME
S
CHEDULING
Contents
3.1 Introduction . . . . 47 3.2 Thermal Control Methods . . . . 48
3.2.1 Model-Based Control . . . 48 3.2.2 Model-Free Control . . . 50
3.3 Existing Methods for Multiple Home Scheduling . . . . 54 3.4 Multi-Objective Optimization . . . . 55 3.5 Agent and Multi-Agent System . . . . 58
3.5.1 General Concepts . . . 58 3.5.2 Agent Management Reference Model . . . 60 3.5.3 Agent Communication Language . . . 62 3.5.4 Agent Life Cycle . . . 63
3.6 OCMAS described by RIO Meta-Model . . . . 64 3.7 Conclusion . . . . 66
3.1/
I
NTRODUCTIONUp to now, in order to improve thermal comfort, there are already various methods. We divide them into two categories: model-based and model-free. Model-free methods can be further classified into local control methods and optimal control methods. Through
analysing their advantages and disadvantages, we propose to employ a model-free hy-brid control method for thermal comfort improvement. Towards solving the multiple home scheduling problem, based on the analysis of the shortages of some existing methods as well as the goals of grid utility and each smart home, we identify it as a multi-objective optimization problem, which can be tackled by searching from the Pareto Front or optimiz-ing the aggregation of multiple objectives with different weights. Furthermore, takoptimiz-ing into account the characteristics of the system: distributed, heterogeneous, intelligent and au-tonomous, an organization centered multi-agent system paradigm is proposed to model this complex system.
This chapter is organized as follows. Section 3.2 presents and compares control methods for thermal comfort improvement. Section 3.3 introduces existing methods for the multiple home scheduling problem. Section 3.4 introduces multi-objective optimization. Agent and multi-agent system are introduced in Section 3.5. Section 3.6 presents organization centered multi-agent system described by Role-Interaction-Organization meta-model.
3.2/
T
HERMALC
ONTROLM
ETHODSIn order to regulate temperature to obtain a high level of thermal comfort, different thermal control methods can be used. In this section, a number of popular thermal control meth-ods are divided into two categories: namely model-based control and model-free control, which will be introduced respectively.
3.2.1/ MODEL-BASED CONTROL
Model-based control as its name indicate is a type of control methodology that needs a model to describe properties of the control system in advance. The model used can be a mathematical model, often expressed with differential equations, that is built based on physical and mathematical knowledges, or a black/grey box model which is driven by data. The most famous model-based control method that is employed in building system is Model Predictive Control (MPC), which can handle large-scale Multi-Input Multi-Output (MIMO) dynamically coupled systems subject to state and input constraints with good performance. It was firstly proposed by [Braun, 1990] to reduce energy costs of buildings.
3.2. THERMAL CONTROL METHODS 49
Inspired by this work, a number of methods based on MPC are developed for building heating and cooling control [Freire et al., 2008, Castilla et al., 2011, Castilla et al., 2014, Moros¸an et al., 2011, Chen et al., 2013a].
The principle of MPC is to solve a finite time optimal control problem at each time step t, expressed as follows[Ma et al., 2012]:
min u k=N−1 X k=0 J(xt+k|t, ut+k|t, dt+k|t), (3.1) subject to xt+k+1|t = f (xt+k|t, ut+k|t, dt+k|t), ∀k= 0, 1, ..., N − 1 (3.2) yt+k|t = g(xt+k|t, ut+k|t, dt+k|t), ∀k= 0, 1, ..., N (3.3) ut+k|t ∈ U, ∀k = 0, 1, ..., N − 1 (3.4) yt+k|t ∈ Y, ∀k = 0, 1, ..., N (3.5)
where the symbol vt+k|t is interpreted as ”the variable v at time t+ k predicted at time t”,
N is the prediction horizon, J is the cost function corresponding to the problem to solve, x is the system states which include air temperature, relative humidity, air speed, etc. in thermal regulation of buildings, u is the control actions like a magnitude of heating or cooling power, d is disturbances of the system, f (x, u, d) is a state transfer function which allows to predict the future building states based on the present states, control actions, and disturbances, y is the outputs of the system that is calculated by the function g(x, u, d) defined by MPC designers, U is the action space, and Y is the output space. The objective of MPC is to minimize the cost function based on the model obtained in advance while satisfying the constraints.
Although MPC avoids the drawbacks brought from employing traditional control tech-niques such as excessive parameter tuning, the lack of prediction capability, etc., it also has to face up some challenges, for example, MPC requires analytical building models at the designing stage which is difficult to obtain on one hand. On the other hand, buildings have different structures, components and heating and cooling devices. So in order to use MPC, different models have to be designed for each building, which will increase the use cost. Moreover, due to the model designing process, the development cycle for MPC is longer than other control methods. Last but not the least, MPC requires more pow-erful computation units to solve an optimization problem in real-time, which is scarcely possible for residential buildings. For these reasons, the acceptance of MPC in building
community has been limited to research purpose.
3.2.2/ MODEL-FREE CONTROL
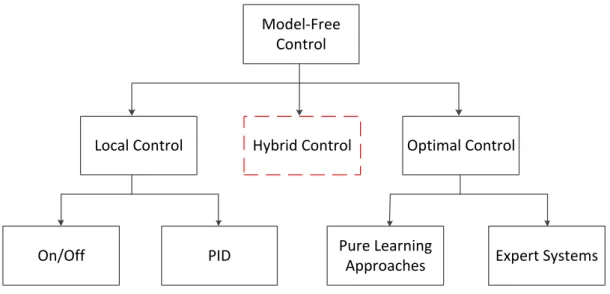
The other type of control methodology is model-free control which does not need to build a model of the system. The controller can take actions based on the present states or conditions for building heating and cooling systems. We develop the classification by [Wang et al., 2008], and obtain a new classification schematic for model-free control, as presented in Figure 3.1. In this figure, model-free control can be further subdivided into local control, optimal control and hybrid control.
Model-Free Control
Local Control Hybrid Control
Pure Learning Approaches
On/Off PID Expert Systems
Optimal Control
Figure 3.1: Classification Schematic of Control Methods
Local control is the basic control and automation that has been widely adopted in build-ings’ heating and cooling systems due to its simplicity to design and its low computational complexity to determine the control signals [Wang et al., 2008]. The control target of this type of method is its control variable itself, i.e. the indoor temperature is both control tar-get and variable for corresponding systems. The two typical methods in this category are On/Off control (or bang-bang control) and Proportional-Integral-Derivative (PID) control.
On/Off control, which is a feedback control switching abruptly between two states: on or off, are ubiquitously used in old building systems without digital
![Figure 2.3: The Adaptive Model Mechanism, from [Yao et al., 2009]](https://thumb-eu.123doks.com/thumbv2/123doknet/14526233.723014/43.893.124.725.348.727/figure-adaptive-model-mechanism-yao-et-al.webp)
![Figure 2.6: Time Scale of Price-Based Demand Response, based on [U.S. Department of Energy, 2006]](https://thumb-eu.123doks.com/thumbv2/123doknet/14526233.723014/48.893.183.740.456.802/figure-scale-price-based-demand-response-department-energy.webp)

![Figure 3.6: Agent Management Reference Model [FIPA, 2004]](https://thumb-eu.123doks.com/thumbv2/123doknet/14526233.723014/66.893.234.699.211.579/figure-agent-management-reference-model-fipa.webp)
![Table 4.1: Comparison of Bluetooth, UWB, Zigbee, and Wi-Fi Protocols, from [Lee et al., 2007]](https://thumb-eu.123doks.com/thumbv2/123doknet/14526233.723014/80.893.148.785.590.774/table-comparison-bluetooth-uwb-zigbee-wi-protocols-lee.webp)
