HAL Id: tel-03166041
https://tel.archives-ouvertes.fr/tel-03166041
Submitted on 11 Mar 2021HAL is a multi-disciplinary open access archive for the deposit and dissemination of sci-entific research documents, whether they are pub-lished or not. The documents may come from teaching and research institutions in France or abroad, or from public or private research centers.
L’archive ouverte pluridisciplinaire HAL, est destinée au dépôt et à la diffusion de documents scientifiques de niveau recherche, publiés ou non, émanant des établissements d’enseignement et de recherche français ou étrangers, des laboratoires publics ou privés.
Methodology for code-optimization of memory data
layouts by adaptation to high-performance-system
architectures with complex memory hierarchies
Riyane Yacine Sid Lakhdar
To cite this version:
Riyane Yacine Sid Lakhdar. Methodology for code-optimization of memory data layouts by adaptation to high-performance-system architectures with complex memory hierarchies. Performance [cs.PF]. Université Grenoble Alpes [2020-..], 2020. English. �NNT : 2020GRALM058�. �tel-03166041�
THESIS
for the degree of
DOCTOR of GRENOBLE ALPES UNIVERSITY
Specialty: MATHEMATICS AND COMPUTER SCIENCEMinisterial Order: May 25, 2016
Presented by
Riyane Yacine SID LAKHDAR
Thesis supervised by Henri-Pierre CHARLES and Maha KOOLI
Prepared at the laboratories
Laboratoire d'Intégration des Systèmes et des Technologies / CEA LIST Grenoble
in the Doctoral School MSTII (Mathématiques, Sciences et Technologies de l’Information et de l’Informatique)
Methodology for Code-Optimization
of Memory Data-Layouts for
High-Performance-System Architectures
with Complex Memory Hierarchies
Defended on 11/12/2020
Jury:
M. Denis BARTHOU Reviewer
Professor at INRIA-INP, Bordeaux
M. Matthieu Moy Reviewer
HDR, Associate Professor at UCB Lyon1- Ens - LIP
Mme. Vania MARANGOZOVA-MARTIN Examiner
HDR, Associate Professor at University Grenoble Alpes - LIG
M. Frédéric PÉTROT President
Professor at University Grenoble Alpes – TIMA
M. Lionel LACASSAGNE Examiner
Professor at Sorbonne University - LIP6
M. Henri-Pierre CHARLES PhD Director
HDR, Research director at CEA/LIST Grenoble
Mme. Maha KOOLI PhD Supervisor
Abstract
With the rising impact of the memory wall, selecting the adequate data-structure implementation for a given kernel has become a performance-critical issue. The complexity of solving efficiently this Data-Layout-Decision (DLD) problem is dra-matically increased by the concurrence of complex, heterogeneous and application-specific hardware memories. Slightly modifying an optimized application or porting it to a new hardware architecture requires an important time and engineering effort. It also requires a deep knowledge of the host hardware platform.
In this thesis, we plot a first step toward automatic software-adaptation to hard-ware. We present an iterative data-mining-related software-optimization approach based on the detection and the exploration of the most influential parameters linked to the hardware, operating system and software. We also propose a custom data-cache-miss modeling algorithm designed to be used as fully-parameterized perfor-mance evaluation. The proposed approach is designed to be embedded within a general-purpose compiler.
In order to explore the parameters related to the data-layout implementation, we propose HARDSI, a custom patented method to solve the DLD problem. We also propose to apply our method using a custom domain-specific language and computation framework. The HARDSI method allows to choose, from a custom base of knowledge, an optimized data-layout implementation with regards to the memory-pattern followed to access the considered data-structure. The generated solutions are also specifically adapted to the properties of the host hardware-memory. Meanwhile, we consider the singular resolution of the DLD problem on memories that are explicitly addressed by the programmer (such as embedded scratchpad memories or GPUs). The problem that we address is to find an optimized memory-placement in order to maximize the amount of frequently-accessed data to be stored within this fast yet narrow memory. In this context, we propose DDLGS, a custom patented method designed to generate a dynamic data-layout with regards to the followed memory-access pattern. The generated implementations encompass the specific load and store routines as well as the granularity attributed to each data transferred. These implementations are also able to adapt, at run time, to the input of the considered source-code.
Aiming to evaluate our implementations on different hardware environments, we have considered two different processor and memory architectures: (i) An x86 pro-cessor implementing an Intel Xeon with three levels of data-caches utilizing the least recently used replacement policy and a (ii) Massively Parallel Processor Array im-plementing a Kalray Coolidge-80-30 with a 16KBytes on-chip scratchpad memory. Experiments on linear algebra, artificial intelligence and image processing bench-marks show that our method accurately determines an optimized data-structure implementation. These implementations allow reaching an execution-time speed-up up to 48.9x on the Xeon processor and 54.2x on the Coolidge processor.
ii
Resumé
La sélection d’une implémentation adéquate de structure de données pour un noyau de calcul donné est un problème critique pour les performances logicielles. La com-plexité de la résolution efficace de ce problème est exacerbée par la concurrence de mémoires matérielles complexes, hétérogènes et dédiées à une application specifique. Modifier légèrement une application optimisée ou la porter sur une nouvelle archi-tecture matérielle nécessite un temps et un effort d’ingénierie considérable. Cela nécessite également une connaissance approfondie de la plateforme matérielle hôte. Au cours de cette thèse, nous franchissons une première étape vers l’optimisation par l’adaptation automatique du logiciel au matériel. Nous présentons une approche itérative d’optimisation basée sur la détection et l’exploration des paramètres les plus influents liés au matériel, au système d’exploitation et au logiciel. La méthode proposée est conçue pour être intégrée dans un compilateur à usage général. Dans ce contexte, nous proposons un algorithme de génération de modèles (entièrement paramétrées) de mémoires caches. Les modèles de performance générés sont conçus pour être utilisé dans le cadre d’évaluations de performances et d’optimisation.
Afin d’explorer les paramètres liés à aux structures de données, nous pro-posons HARDSI, une méthode brevetée permettant la résolution du problème de l’agencement des données pour logiciel donné. Dans le but d’appliquer notre méth-ode, nous proposons également un langage dédié (basé sur le langage C/C++) ainsi que son environnement logiciel de compilation et d’exécution. La méthode HARDSI permet de choisir, à partir d’une base de connaissances spécialisée, une implémen-tation optimisée de l’agencement des données en fonction de la géométrie d’accès à la structure de données. Les solutions générées sont également spécifiquement adaptées aux caractéristiques matérielles de la mémoire hôte considérée.
De même, nous considérons la résolution du problème de l’agencement des don-nées sur les mémoires singulières qui sont explicitement adressés par le program-meur (tel que les mémoires de type "scratchpad" ou GPU). Le problème que nous abordons est de trouver un emplacement mémoire optimisé afin de maximiser la quantité de données fréquemment accédées et à stocker dans ce type de mémoires rapides bien qu’étroites. Dans ce contexte, nous proposons DDLGS, une méthode brevetée conçue pour générer une implémentation dynamique des données sur mé-moires scratchpad. Ces implémentations sont conçus par DDLGS en considérant le schéma d’accès à la mémoire spécifiquement suivi par le code a optimiser.
Dans le but d’évaluer nos implémentations sur différents environnements matériels, nous considérons deux processeurs et mémoires différents: (i) un pro-cesseur x86 implémentant un Intel Xeon à trois niveaux de caches de données et (ii) un processeur massivement parallel implémentant un Kalray Coolidge-80-30 à mé-moire scratchpad sur puce de 16K octets. Les expériences menées sur des noyeaux d’algèbre linéaire, d’intelligence artificielle et de traitement d’images montrent que notre méthode détermine avec précision une implémentation optimisée des struc-tures de données. Ces implémentations permettent d’atteindre une accélération du temps d’exécution jusqu’à 48,9x sur le processeur Xeon et 54,2x sur le Coolidge.
iii
Acknowledgments
The work defended in this thesis have been prepared for much longer than I may call. Consequently and for their tremendous work in preparing me for this thesis, I would like to address my deepest and most sincere gratitude to my parents, Amina and Rachid. The countless weekends and holidays that you have sacrificed for my education are probably the only way for a trouble-maker like me to end up studying. I would like to thank my brother Wissam for his precious help and understanding. Thanks kho for setting the bar so high that my PhD and few papers look now like a joke. I would like to say my love to my grandparents papy, makhokha (el lahe yerhamkoum wi wessa3 3likoum) and mamy. Your endless love and prayers have always been my main asset. Your kindness, unique mind and simplicity is the only way I like to see the world. No family has ever been as patient, loving and tolerant to hard times; and for that I will always be grateful.
Then, this thesis has been imagined and hardly battled by my supervisor, Henri-Pierre Charles. It has been an honor to work with you and to witness your deep understanding and culture of computers. I would like to express my sincere and tender gratitude to Maha Kooli who accepted to join the supervision of my thesis at midterm. I could hardly show you how thankful I am for your time, precious advises and meticulous reviews of my work. You and your wonderful family has always saved us a seat at your table.
In order to assess and validate my work, I had the honor to defend my work in front of an extremely competent and recognized jury. I am very honored and thankful to each member of my jury for the time and consideration that was given to my work. I am deeply convinced that this work has highly benefited from the attentive reviews and thoughtful advice from my jury.
Finally, this thesis has offered me a unique chance to meet great minds and wonderful people. It was a blessing and an honor to see Vincent Olive, Diego Puschini and Didier Lattard successively lead the department of laboratory that I belonged to. It was a also blessing to share so many discussions, meals, coffees and times with so many interesting and joyful people. You guys are a great team. Keep it up.
Last but certainly not least, I would like to offer my deepest and most sincere gratitude to my uncle Dr. Halim LEHTIHET for his invaluable help and high-standard advises. His support through the years and his constant push to strive for excellency are the main reasons why I am currently allowed to defend this thesis. He also gave me one of the most valuable thing in life: a passion.
A special thanks to the unique mind behind every formula in my thesis, Dr. Roxana DIA. Your kind support and precious smile will forever be a warm memory.
Contents
List of Abbreviations . . . 1
List of Acronyms . . . 2
Mathematical Notations for Cache-Miss Modeling . . . 3
Mathematical Notations forDLD Resolution . . . 3
1 Introduction 5 1.1 Historical Overview. . . 5
1.2 Context and Objectives . . . 6
1.3 Global Approach . . . 7
1.4 Requirements and Issues to Overcome . . . 9
1.5 Contributions . . . 9
1.6 Experimental Setup . . . 10
1.7 Thesis Structure . . . 11
I State of the Art and Scientific Methodology 13 2 Scientific Methodology: Performance Exploration 15 2.1 Simulation and Emulation Tools . . . 16
2.1.1 Trace Injection Simulators . . . 16
2.1.2 Cache, RAM and Register Simulators . . . 17
2.1.3 Instruction-Interpretation Simulators . . . 18
2.1.4 Trade-off Between Accuracy and Execution time . . . 19
2.1.5 Conclusion . . . 19
2.2 Hardware and Software Performance Modeling: The Roofline model 20 2.2.1 Hardware Boundaries (Roof) . . . 21
2.2.2 Fitting the Model to the Memory/Computational Optimiza-tions (Ceiling) . . . 21
2.2.3 Interest of the Roofline Model. . . 23
2.2.4 Conclusion: Limitation of the Roofline Model for our Approach 23 2.3 Performance Measurement . . . 23
2.3.1 Hardware Performance Counters . . . 24
2.3.2 Performance Measurement Libraries . . . 26
2.3.3 Conclusion: Choosing a Hardware-Software Performance Tracker . . . 29
2.4 Conclusion: Adopted method and implementation choices . . . 31
3 State of the Art: Software Optimization 33 3.1 Overview in Software Optimization . . . 33
3.2 Source-Code Adaptation to Hardware . . . 34
vi Contents
3.2.2 The LGen Code Generator forBasic Linear Algebra
Compu-tation . . . 35
3.3 Data-Layout-Based Software Optimization . . . 37
3.3.1 Background: Data-Cache-Miss and Performance . . . 37
3.3.2 Data Layout: Definition and terminology . . . 38
3.3.3 Dynamic-Memory Access Pattern . . . 38
3.3.4 The Data-Layout Decision Problem. . . 40
3.4 Scratchpad memories . . . 42
3.4.1 Memory Overview . . . 42
3.4.2 High-Performance-Computing-Code Optimization . . . 43
3.4.3 Embedded-Code Optimization . . . 43
II Code Optimization by Adaptation to the Hardware Memo-ries 45 4 HARDSI: Custom Method to Solve the Data-Layout Decision problem 47 4.1 HARDSIOverview . . . 48
4.1.1 Objectives . . . 48
4.1.2 The HARDSI DSL . . . 48
4.2 Global Optimization Process . . . 50
4.2.1 Memory-Access Tracking. . . 51
4.2.2 Generating a Memory-Signature . . . 51
4.2.3 Access-Pattern Data-Base . . . 52
4.2.4 Software Optimization . . . 54
4.3 HARDSIFramework Implementation . . . 55
4.3.1 Accelerating theHARDSI Process . . . 55
4.3.2 Conventional Three Cache-Levels Architectures . . . 57
4.3.3 Pluri-architectural Software Optimization . . . 58
4.4 Contemplated Future Implementations . . . 60
4.4.1 Multicore architecture . . . 60
4.4.2 In-memory Computing . . . 60
4.4.3 Detecting Malicious-Code Injection . . . 62
5 Dynamic Data-Layout Implementation for Programmable Memo-ries 63 5.1 Extending the HARDSIFramework to Scratchpad Memories. . . 64
5.1.1 Background and Process Overview . . . 64
5.1.2 HARDSITransformation-Function for Scratchpad Memories . 65 5.1.3 Implementation and Multiple-Memories Issue . . . 66
5.2 DDLGS: Generating Matrix Data-Layout Dedicated to Scratchpad . 67 5.2.1 Custom Generation Process . . . 67
Contents vii
5.2.3 Generalizing the Resulting Implementation to New Input Data 70
5.2.4 Potential Improvements . . . 72
III Experimental Validation and Discussion 73 6 HARDSI Experimental Evaluation 75 6.1 Experimental Setup: HARDSICode Compilation . . . 75
6.2 Matrix Multiplication Kernel . . . 76
6.3 Experimented Benchmark . . . 77
6.4 Evaluation on a Three Data-cache Levels. . . 78
6.4.1 Experimental Results Overview . . . 78
6.4.2 Impact ofHARDSIon the Different Cache-Levels . . . 79
6.5 Enhancing the HARDSIMethod to scratchpad memories. . . 81
6.5.1 Regular Data Caches VS HARDSI Scratchpad implementation 81 6.5.2 Baseline scratchpad VS HARDSI Scratchpad implementation 82 6.6 Impact of Noise on the HARDSIMethod. . . 84
7 Conclusion and Future Work Directions 87 7.1 Summary and Conclusion . . . 87
7.2 Perspectives and Future Works . . . 88
7.2.1 Short Term Perspectives . . . 88
7.2.2 Long Term Perspectives . . . 89
Publications 91
List of Figures
1.1 Custom evaluation of performance and code-complexity for a sim-ple matrix multiplication application (100*100 integers) using dif-ferent software implementations. The potential properties of each implementation are (P) Portable to new hardware/software (H) uses hardware-specific instructions (R) requires run-time code-refactoring 6 1.2 Global view of the proposed software-optimization process.. . . 7
2.1 Trade-off between simulation-time and hardware-model accuracy (ex-tract from [16]). . . 19 2.2 Roofline Model for (a) AMD Opteron X2 and (b) Opteron X2 vs.
Opteron X4 (extract from [112]). . . 20 2.3 Refining the Roofline model depending on the used (a) memory
op-timization and (b) compute opop-timization. Data corresponding to an AMD Opteron X2 and (c) Opteron X2 processor (extract from [112]). 22 2.4 Layout of the IA32-PERFEVTSEL Model-Specific Register (MSR)
(extract from [23]). . . 24 2.5 Code snippet to access an MSRlooking for a Core (or central)
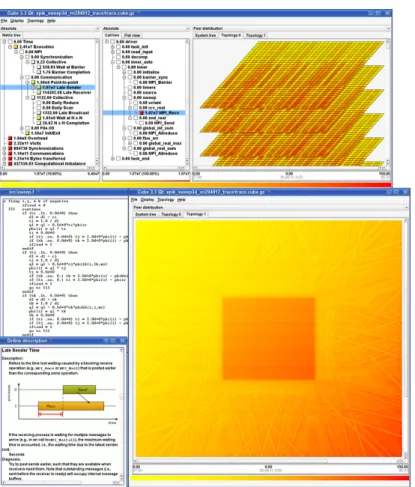
pro-cessing unit (CPU) cycle counts on an (2.1) Intel and (2.2) IBM processor . . . 27 2.6 Scalasca analysis report explorer presentation of Sweep3D execution
performance with 294,912 MPI processes on the IBM Blue Gene/P platform. Interface of the Cube tool (extract from [114]). . . 28 2.7 Performance benchmark of two implementations of a basic matrix
multiplication algorithm [57]. The performance tracker used is (a) Score-P versus (b) our customMSR-based code (inspired from List-ing 2.1). The dots are the average value of ten consecutive measure-ments. The shaded curves denote the distance between the minimal and maximal values of the ten measurement. The experiments follow the experimental setup described in section 1.6. . . 30
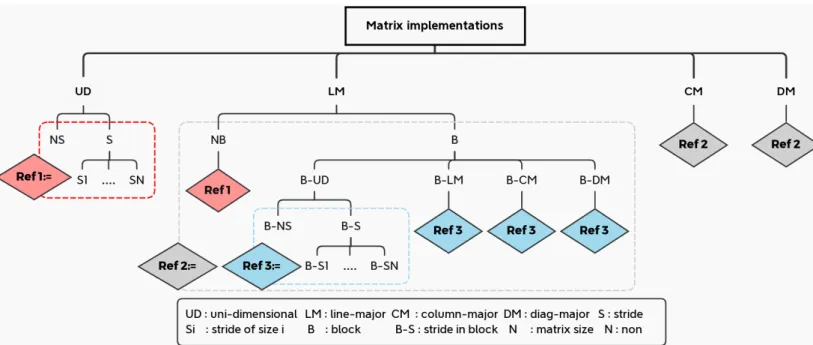
3.1 Cache-fetch behavior while accessing a data at an address a. a[L] represents the rest of the euclidean division of a by L. . . 37 3.2 Set of O(N !) potential implementations for a two dimensional matrix. 39 3.3 Example of four memory-access patterns to a matrix data structure. 39 3.4 Hardware view of a memory hierarchy including an on-chip
scratch-pad memory. . . 42
4.1 Matrix multiplication test case. . . 49 4.2 Steps of the proposed optimization-process. . . 50
x List of Figures
4.3 (a) Generated memory signatures of the 4x4 matrices a, b and res in the matrix-multiplication test-case; (b) Respective closest signatures in theHARDSIdata base. . . 53 4.4 Relational data base of knowledge: Stores the required relations to
retrieve the best known implementation of a given data structure knowing its memory signature. The key attributes (line identifiers) are underlined. . . 54 4.5 Memory-access signatures of a (10∗10) matrix accessed following four
different patterns. The tilled patterns ((a) and (b)) have tiles of size (2 ∗ 2). . . 58 4.6 Optimized matrix implementation relative to each part of a
JPEG-compression algorithm . . . 59 4.7 Overview of a tiled version ofC-SRAMmemory architecture (extract
from [53]). . . 60 5.1 Application view of a software-process (UNIX) hosted on
memory-hierarchy including a scratchpad memory. . . 64 5.2 Notations used by the transformation function of the HARDSI
method for scratchpad usage. . . 66 5.3 Illustration of the four steps of the generation of a
scratchpad-dedicated data-layout (with a fixed dimension). . . 68 5.4 Interpolation used to extend the dimension of an optimized matrix
data-layout generated by the HARDSI method for scratchpad usage. 70 6.1 Experimental comparison, based on the number of L3 (a),CPUcycles
(b) and Translation Lookaside Buffer (TLB) (c, d) cache miss of a matrix-multiplication implemented in both C/C++ and our custom HARDSI Domain-Specific Language (DSL). . . 76 6.2 Performance speed up, in terms ofLLCcache-misses (load and store),
between a HARDSIand baseline implementation. . . 79 6.3 Performance speed up, in terms of data L1 cache-misses (load),
be-tween a HARDSIand baseline implementation (logarithmic scale). . 80 6.4 Performance speed up, in terms of data L1 cache-misses (store),
be-tween a HARDSIand baseline implementation (logarithmic scale). . 80 6.5 Performance speed up, in terms of CPU cycles between a HARDSI
and a Kalray implementation designed for scratchpad usage. . . 83 6.6 Percentage of variables (vertical axis) in the gesummv kernel that was
positively identified by the HARDSI method for a given percentage of random memory accesses (horizontal axis) introduced at random moment of the kernel’s execution. This figures is obtained on both the Intel Xeon and the Kalray processors. . . 84 7.1 Global view of the proposed software-optimization process and the
List of Tables
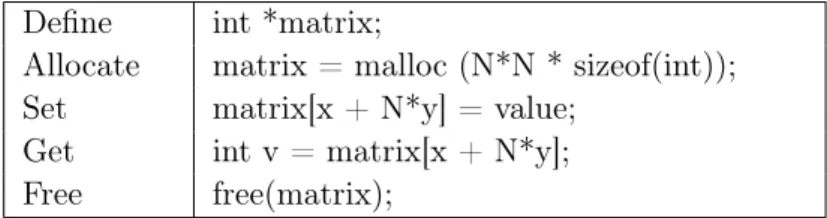
3.1 Classification of existing code-optimization solution according to their leverage-point on source code . . . 34 3.2 Example of C/C++ routines defining a uni-dimensional
implementa-tion of a 2D matrix of size N*N . . . 38 4.1 Example of an execution-trace (partial) of three matrix-variables a,
b and res for a (4 ∗ 4) matrix multiplication test case.. . . 51 6.1 Memory-access pattern followed by considered kernels. . . 78 6.2 Performance speed up, in terms of CPU-cycles, between a HARDSI
and baseline implementation. The value "=" (respectively "<") means that the highest speed up reached using a state of the art (SoA) implementation is equal (respectively smaller) to the one ob-served using theHARDSIimplementation. . . 79 6.3 Performance speed up, in terms of CPU-cycles, between a
scratch-pad implementation and the best implementation (optimized for L1 data cache) known for each kernel. The scratchpad implementation is either the one automatically selected by the HARDSI method (first line) or the best found by testing all the matrix implementations in the HARDSI data base (second line). The value "=" means that the highest speed up reached using a HARDSI-selected implementation is equal to the one observed using the best tested implementation. . 81
Glossary
List of Abbreviations
C-SRAM Computational SRAM is a an in-memory computing architecture. It consists in a static RAM memory that embeds computing abilities. It is designed to reduce the time and energy cost of the transfers between the main memory hierarchies and the computational blocks (CPUs and accelerators)..
DMA Direct Memory Access, referring to a device that can transfer data in and out of the memory (main memory or on-chip scratch memory) without involving the processor. The processor is only interrupted at the com-pletion of the transfer.
LLC Last Level Cache refers to the highest-level of data cache within the hardware-memory hierarchy. Unlike the first-level of cache, the LLC is usually a single hardware block that is shared by all the processing units. In the example of the x86 Intel Xeon E3-1270 processor, the LLC corresponds to the L3 data cache..
LRU Least-Recently Used cache-replacement policy consists in evicting, whenever a new cache-line is added, the least-recently used line.. MPPA Massively Parallel Processor Array refers to a family of on-ship
proces-sors with a large (over a hundred or even a thousand) number of CPUs. These processors being organized in parallel arrays..
NUMA Non-Uniform Memory Access is a wildly-used hardware organization of the compute units and the memories designed for single-node multipro-cessing. In such a hardware architecture, the memory-access time de-pends on the position of the data within the memory architecture across the different CPUs..
RAM Random-Access Memory is a form of non-persistent (flushed when powered-off) computer memory, typically used to store running processes data and instruction. In modern DDR4 technologies, a RAM memory is roughly ten to a thousand times faster than flash (persistent) memories..
2 List of Acronyms
List of Acronyms
ALU Arithmetic Logic Unit.
API Application Programming Interface. BLAC Basic Linear Algebra Computation. BLAS Basic Linear Algebra Subprograms. CPU Core (or central) processing unit.
DDLGS Dynamic Data-Layout Generation for Scratchpad. DLD Data-Layout Decision problem.
DSL Domain-Specific Language. GPU Graphics Processing Unit.
HARDSI Hardware-Adapted Refactoring of Data Structure Implementation. HPC High-Performance Computing.
HW Hardware.
ISA Instruction Set Architecture.
LL Linear Language.
LLIA Last-Level Indirection Array. LTO Link Time Optimization. MMU Memory-Management Unit. MPI Message Passing Interface. MSR Model-Specific Register.
OS Operating System.
PMU Performance Monitoring Unit. SIMD Single Instruction Multiple Data.
SW Software.
TLB Translation Lookaside Buffer. TPU Tensor Processing Unit. VLIW Very Large Instruction Word.
Mathematical Notations for Cache-Miss Modeling 3
Mathematical Notations for Cache-Miss Modeling
@(x,y) Virtual adress of the cell (x, y) of a matrix.
B Size of a dynamic memory allocator basic block (as defined by the Linux GLIBC implementation [39]).
C Size in Bytes of a line of an LLC cache. Ctotal Total number of lines within an LLC cache. D Memory-size (in Bytes) of a cell of a matrix.
L Number of contiguous and lower addresses to a given @(x,y) that are already preloaded in the LLC cache when accessing @(x,y).
N Width and length of a square matrix. X Width of a non square matrix. Y Height of a non square matrix. x Abscissa of a given cell of a matrix. y Ordinate of a given cell of a matrix.
Mathematical Notations for DLD Resolution
HM atrixf,v Histogram (memory signature) of the values in Tvf.Tv List of all the cell accesses (address or index) to a matrix varable v during an input-code execution.
Tvf Transformation of the list of access Tvbased on the transformation func-tion f .
Chapter 1
Introduction
1.1 Historical Overview . . . 5
1.2 Context and Objectives . . . 6
1.3 Global Approach . . . 7
1.4 Requirements and Issues to Overcome. . . 9
1.5 Contributions . . . 9
1.6 Experimental Setup . . . 10
1.7 Thesis Structure . . . 11
1.1
Historical Overview
Hardware processor and memory performance evolution has always been driven by technology evolution. The first influential technological parameter is the size of a transistor. Reducing the size of a transistor allowed to produce faster circuits (shorter data-transfer paths) with a lower energy consumption. This tendency led, following Moore’s law [74], to ship a huge amount of transistors on a single ship. Today’s embedded processors use a technology-design as small as 5nm. However, this size-reduction seems to have reached a limit [75].
A second parameter that shapes computer-performance is the hardware architec-ture. Since the first monolithic processor (Intel 4004 ), successive inventions have each brought an order of magnitude in terms of computational power and efficiency. All these architectures and improvements demonstrated a significant increase in the peak and the best-case computational performance. The instruction-pipeline operators allowed to improve the computing operators throughput with the draw-back of augmenting the latency. Multi-level data and instruction caches allowed to improve the data-access latency with the drawback of complicating the data-access time predictability. Hyperthreading, branch prediction and multiprocessing allowed to increase the computational throughput while dramatically complicating the performance prediction and evaluation.
In parallel, the design of the compilers had to painfully integrate the support to all the hardware evolution. This pushed compiler’s back-end to integrate processor models. Pipelined architectures are supported by a precise instruction scheduling. Distributed data caches and multiprocessors are supported by complex program representations such as the polyhedral model. However, the question that remains is: is the software generated by modern compilers and programming models able to largely take advantage of all the proposed hardware capacities.
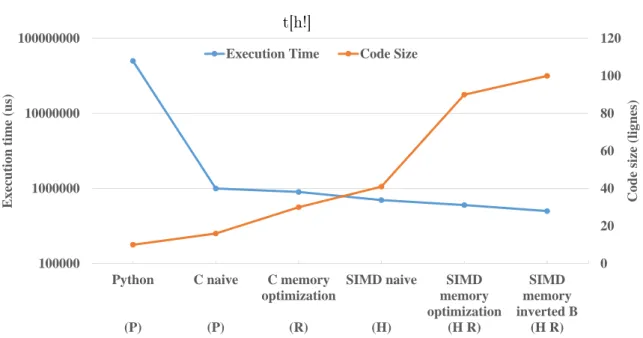
6 Chapter 1. Introduction t[h!] 0 20 40 60 80 100 120 100000 1000000 10000000 100000000 Python (P) C naive (P) C memory optimization (R) SIMD naive (H) SIMD memory optimization (H R) SIMD memory inverted B (H R) Cod e si ze (l ig nes ) Ex ecuti o n ti m e (us )
Execution Time Code Size
Figure 1.1: Custom evaluation of performance and code-complexity for a simple matrix multiplication application (100*100 integers) using different software imple-mentations. The potential properties of each implementation are (P) Portable to new hardware/software (H) uses hardware-specific instructions (R) requires run-time code-refactoring
1.2
Context and Objectives
Modern High-Performance Computing (HPC) architectures encompass a large and varied set of heterogeneous accelerators. Some of them allow to accelerate computa-tional operations (e.g. Single Instruction Multiple Data (SIMD) vector processors, Graphics Processing Units (GPUs), Tensor Processing Units (TPUs)). Others soften the data-fetch latency (e.g. caches, scratchpads and TLBs). A last category opti-mizes the scheduling and the interaction between memory and compute operations (e.g. Intel’s Hyper-Threaded CPUs, C-SRAM). These hardware accelerators may bring a very interesting time and energy-efficiency improvement to a software code. Consequently, software-optimization literature has mainly focused on adapting an input source-code to a given accelerator. In Figure 1.1, we show through the exam-ple of a matrix-multiplication algorithm that such an approach has accelerated the code’s execution by roughly 100X for an input matrix of size 100. However, this execution-time improvement has been reached at the expense of the code simplicity. The size of the code has increased by over 20X (regardless of the system libraries and Application Programming Interfaces (APIs) used to access each accelerator). Within an industrial ecosystem, such a size increase makes it complicated to debug, maintain and improve the code.
Moreover, a code deployed on a hardware accelerator is usually specifically devel-oped for the considered hardware environment. The specific API of the environment is used. The data is specifically tiled and split across the considered memories, and
1.3. Global Approach 7
the data fetch is scheduled according to the hardware specificity (size of the memory and its subsystems, size of the transfer-buses, policy of access and replacements). Consequently, all this engineering time and efforts has to be spent again whenever the code is ported to a new family of hardware. Similarly, slightly modifying the code that has been optimized requires the same amount of work.
1.3
Global Approach
Source code (C/C++) ` Model Execution-time ?: T(H, OS, I, D) Optimized source code (C/C++)(a) Steps of the proposed software-optimization process. H: Hardware RAM: Frequency SIze Family #Strip ... Processor Frequency Word size # cores Bus size cache size cache access policy ...
OS: operating System
Page replacement policy Page access policy (first touch, worst touch, ...)
Page size
Cache replacement policy Library implementation (malloc, synchronization, ...)
...
I: Implementation
Loop unroaling depth Instruction ordering Loop ordering ...
D: Data
Data structure choice Data structure implementation ...
(b) Parameters of the
execution-time function T .
Figure 1.2: Global view of the proposed software-optimization process.
From a mathematical point of view, a source code may be mapped to its specific execution-time function T . As shown in Figure 1.2a, this multidimensional function expresses the execution time of the corresponding code with respect to the value of different external parameters. In Figure 1.2b, we summarize
8 Chapter 1. Introduction
the different families of adjustable-parameters that are known to influence the execution-time of a kernel: hardware, operating system, implementation, and data-placement. In this context, optimizing a software is equivalent to finding the input parameters that would minimize the corresponding execution-time function T .
The optimization process introduced inFigure 1.2a is in no mean implemented nor evaluated in this thesis. However, this thesis identifies different requirements linked to this new family of optimization approach. The different contributions of this thesis are build in order to be eventually integrated within a future tool implementing the optimization approach in Figure 1.2a.
As shown in Figure 1.2a, the considered optimization approach consists in first removing the parameters that are known not to be of any interest regarding the considered software/hardware environment. Then, the process consists different iterations aiming at converging toward an optimized value of these parameters. The parameters are split into two groups: the discrete and the non-discrete ones. For the discrete parameters, the approach is based on the simplex algorithm [26]. This algorithm is primarily used due to its robustness. It may be applied to analyze parameters with large or small set of potential values. It may also be used with non-ordered parameters (e.g. cache-allocation policy, page-replacement policy, library choice). This algorithm may only be used under the assumption that all the considered parameters are either integer or may be mapped to a finite integer set. Meanwhile, the non-discrete parameters1 (such as the processor or the memory frequency) are determined using the gradient-descent algorithm [91]. This approach is primarily picked as it allows slight changes in the target function (T ) between two consecutive iterations of the algorithm (Haskell Curry adaptation of the gradient-descent for convergence with non-linear optimization [111]). This property is used in order to consider several parameters in parallel: one or several simplex executions (corresponding to one or several discrete parameters) may be run along with a gradient-descent execution (corresponding to a non-discrete parameter).
Showing the optimality of the optimization found by the proposed approach is out of the scope of this study. However, this numerical approach for software optimization ensures that most important parameters for software-performance are explored. It also allows to use prior optimization-knowledge by favoring some pa-rameters over others or by reducing the research-space. Finally, by introducing hardware and OS-related parameters, our approach sets the basis for a new way of software optimization: adaptation to the host hardware.
1
1.4. Requirements and Issues to Overcome 9
1.4
Requirements and Issues to Overcome
In order to implement our software-optimization approach, different problems need to be treated.
On the one hand, the execution-time function T may hardly be accurately evalu-ated for any given input source code. To the best of our knowledge, no solution has been proposed to evaluate this function T with regards to all the parameters that we identified. Even though mathematical modelings of T exist for some specific input codes [112,44,79,64,31], the corresponding models are either constant with respect to the considered parameters [112,44, 79] or non derivable with respect to some non-discrete parameters [64,31].
On the other hand, in order to run the optimization approaches described in sec-tion 1.3, we need to either have sufficient evaluation of the considered function T or be able to evaluate a stochastic function related to T . In both cases, we need to measure or predict the execution time of the given code2within the considered hard-ware/software environment. Insection 2.1we show that modern hardware-software simulator or executors have non negligible time constraints. Consequently, it would be impossible to implement our method using such simulators or executors at the execution-time scale of a compiler.
In this context, our approach consists in replacing the execution-time function T with a similar but easiest-to-evaluate one. For instance, if we consider that the number of data-cache misses has a direct impact on the execution-time, we may substitute the function T with a model of the number of cache misses.
1.5
Contributions
This thesis aims at proposing the ground basis to the automatic adaptation of software-code across high-performance hardware architectures. This consists in proposing different solutions and tools aiming to be eventually integrated within the proposed optimization process (Figure 1.2b). In this context, the main contri-butions of this thesis are:
(i). HARDSI, a patented and custom framework for automatic exploration of data-layout implementations. The corresponding source-to-source compiler is a standalone tool designed to replace each data-structure’s instance with an optimized implementation. This optimization for general-purpose C/C++ code is based on memory-pattern detection.
(ii). DDLGS, a method designed to automatically and dynamically generate data-layout-implementations for programmable (fast and explicitly-addressed) memories. The generated code allows to adapt at run-time to the dimen-sion of the problem as well as the pattern followed to access the data. 2
10 Chapter 1. Introduction
(iii). An evaluation of the performance-improvement brought by our source-to-source compiler method.
1.6
Experimental Setup
In this thesis, we deployed and evaluated our solutions on two different hardware platforms. The first one is an x86 architecture implementing an Intel Xeon E3-1270 v4 processor with an L3 LLC containing a total of 8M Bytes made of 128 Bytes per cache line and implementing the LRU cache-replacement policy. A Debian (4.9.2) operating system is used based on the Linux (3.16.0-4) kernel. The g++ (4.9.2) compiler (with the -03 optimization option) is used to compile the considered computation-kernels. This includes the native C/C++ code and the one generated by our HARDSI source-code generator (chapter 4). The Perfmon2 (libpfm-4.11.0) library [32] allong with our custom patch (subsection 2.3.2) is used to access the Performance Monitoring Unit (PMU) of the x86 processor in order to measure different cache misses and CPU cycles. The cpupower toolkit is used to disable the automatic CPU-frequency scaling of our processor.
The second hardware platform that we considered is a MPPA Kalray Coolidge-80-30. This Coolidge processor implements five clusters, where each one contains sixteen in-order K1c Very Large Instruction Word (VLIW) cores. Each core shares a 4M Bytes DDR main memory with all the cores on the same cluster and communi-cates with the other clusters through a NoC. Each core has also a 4-way associative L1 cache LLC containing a total of 16K Bytes made of 64 Bytes per cache-line and implementing the LRU cache-replacement policy. Even though a larger data cache (L2) is present on this platform, we do not consider it. Indeed, unlike the L2 and L3 caches of our x86 processor, the L2 cache of the Coolidge processor is primarily used as a fast communication buffer between concurrent cores. It is not an extra caching level in between the main memory and the CPU. Thus, we assume that the L2 cache of the Coolidge processor has a fairly-negligible impact on the performance of our single-threaded target applications (as we bind each thread on a unique core). Additionally, the considered Coolidge processor implements a 16K Bytes scratchpad memory per core. This fast on-chip memory is explicitly accessed by the programmer through the builtin library embedded to the Kalray-1 (4.0.0) tool-chain. In this thesis, we simulate the whole HW/SW stack using the Kalray-1 (4.0.0) simulation platform. The –cycle-based option of the simulator is used to ensure a quasi cycle-accurate execution. The k1-cos-g++ (4.0.1) based on the g++ (7.4.1) compiler (with the -03 optimization option) is used to compile all the consid-ered computation-kernels. The builtin library of the simulator is used to access the performance registers and the Memory-Management Unit (MMU) of the Coolidge processor in order to measure different cache misses and CPU cycles. As far as we know, no automatic CPU-frequency scaling is implemented in the used simulator.
1.7. Thesis Structure 11
All the presented performance results are obtained following the same procedu-ral method (on both considered processors). Each point is assessed (experimental run) 10 times, and the presented results are the average of these runs. Given its relatively small value (smaller than 1% for all the experiments) no variation is presented. The performance gain that we show in this section are obtained without re-ordering the instructions of the original algorithm. We make sure to flush all the data-caches between two consecutive experiments using a CFLUSH assembly instruction of both considered processors.
Finally, all the results presented in this thesis are obtained using float matrices. Similar results might be observed using other basic types of data such as integers or doubles.
1.7
Thesis Structure
The rest of this thesis is organized as follows.
Part I presents the state of the art in terms of software optimizations. Chapter 2 discusses existing tools and methodologies for software-performance evaluation, measurement, modeling and estimation. Chapter3 evaluates the existing solutions for software optimization. A particular attention is given to the optimizations by adaptation to the hardware and the software optimizations for scratchpad usage. It then focuses on what we consider as a major problem to solve for software adaptation: the Data-Layout Decision problem (DLD).
Part II presents our contributions toward an automatic software adaptation to hardware. Chapter 4 introduces HARDSI a custom patented methodology to solve the data-layout decision problem by adapting an input implementation to the host hardware-memory hierarchy. It also presents the principles and the usage of the proposed DSL and compilation framework. Chapter 5 uses the instance of programmable memories to show how to extend the proposed methodology to hardware memories with no dedicated data-layout implementations. The chapter also presents DDLGS a custom patented method designed to dynamically generate scratchpad-dedicated dynamic data-layout implementations.
Part IIIpresents through chapter6 an experimental evaluation of our method to select an adequate data-layout implementation across different hardware platforms. It also evaluates the performance gain brought by our automatically-generated code.
Chapter 7concludes the thesis and discusses different improvements and appli-cations for the software-optimization approach that we propose.
Part I
State of the Art and Scientific
Methodology
Chapter 2
Scientific Methodology:
Performance Exploration
2.1 Simulation and Emulation Tools . . . 16
2.1.1 Trace Injection Simulators. . . 16
2.1.2 Cache, RAM and Register Simulators . . . 17
2.1.3 Instruction-Interpretation Simulators. . . 18
2.1.4 Trade-off Between Accuracy and Execution time . . . 19
2.1.5 Conclusion . . . 19
2.2 Hardware and Software Performance Modeling: The Roofline
model . . . 20
2.2.1 Hardware Boundaries (Roof) . . . 21
2.2.2 Fitting the Model to the Memory/Computational Optimizations
(Ceiling). . . 21
2.2.3 Interest of the Roofline Model . . . 23
2.2.4 Conclusion: Limitation of the Roofline Model for our Approach. . . 23
2.3 Performance Measurement . . . 23
2.3.1 Hardware Performance Counters . . . 24
2.3.2 Performance Measurement Libraries . . . 26
2.3.3 Conclusion: Choosing a Hardware-Software Performance Tracker . . 29
2.4 Conclusion: Adopted method and implementation choices. . . 31
The software optimization approach that we propose is highly data-dependent. In order to efficiently run its heuristic, our method needs to have, at each iteration, an accurate evaluation of the function that it minimizes (whether it is the execution time function or any related performance function). In this chapter, we first make in section 2.1a state of the art in terms of simulation and execution-tools designed for hardware-exploration. Second, we explore in section 2.2 the existing performance-modeling methods. The objective being to determine whether or not these models may represent an alternative to the time-consuming code-execution or simulation for performance evaluation. Third, we investigate and compare in section 2.3 the dif-ferent software and hardware approaches to reliably measure difdif-ferent performance indicators (such as execution-time, memory latency, cache misses). Finally we con-clude by choosing the adequate tools for our software optimization implementations with the expected time, reliability and accuracy constraints.
16 Chapter 2. Scientific Methodology: Performance Exploration
2.1
Simulation and Emulation Tools
We refer to hardware-simulation or emulation any tool designed to replicate by the means of software the functional behavior of a hardware. The difference between simulation and emulation lays in the system hosting the replication. A simulation is based on a software implementation of a model where the internal functions of the original systems are not taken into consideration. Meanwhile an emulation is a replica of the internal system functions on a different host hardware. In the rest of this thesis, we refer to both simulation and emulation tools as simulation regardless to the host hardware. We also refer to the hardware platform where the simulator is run as the host hardware. Finally, we refer to the hardware platform that is simulated as the target hardware
2.1.1 Trace Injection Simulators
One of the main distinctive aspect of a hardware simulation is its time-overhead compared to a simple execution. Indeed, simulating an instruction from the target hardware at software level is equivalent to recognizing, translating and interpreting it in the host-hardware instruction-set. Given that each one of these steps is equivalent to several instructions from the host hardware, a simulation-time maybe prohibitively long for many applications.
One way to reduce the simulation-time, is to reduce the level of accuracy in the formal description of the target architecture. This is often achieved using trace-based (or trace-driven) simulators [106,90, 101,8]. These simulators take as input a fixed sequence of trace-records relative to the execution of the corresponding software on the target hardware. Then the simulator only evaluates the instructions which results are not in the trace file. This trace may record memory references, branch outcomes or computational instructions. In order to cover a large set of potential uses, the traces fed to a simulator are usually produced by an automatic trace generator.
In an attempt to reduce the simulation time, some random-traffic generators have been proposed. Even though generating random traces is easy, it usually re-sults in traces that diverge from effective executions. In addition to the obvious functional default of the resulting execution, this divergence forbids the deduction of any performance-evaluation from such a simulation [101,8].
In order to understand the inaccuracy of performance-evaluation derived from trace-injection-simulators, let us consider how the memories hierarchies ar simulated. In-deed, the layered memory-systems are known to be a root cause for performance; and this high incidence is mainly related to the cache-hierarchy. Data, instruction and address caches are mainly maintained through coherency-messages. These mes-sage follow a non-deterministic and non uniform distribution. Thus, the random traffic-generators are very-likely to produce a trace that follows a different distribu-tion [101,8]. In order to tackle this challenge of cache-simulation accuracy, different
2.1. Simulation and Emulation Tools 17
attempts have been made to propose a trace-generator that dynamically adapts the cache-coherency message-distribution to the observed memory-accesses [66,67,118]. However, as shown in [8], the cache-coherency message distribution is significantly influenced by other parameters than the memory access pattern (such as the burden on the machine [8] and the hardware message passing protocols [81]). Thus, it re-mains difficult to generate a traffic that accurately simulate the performance-critical memory-hierarchy behavior.
2.1.2 Cache, RAM and Register Simulators
Given the difficulty stated in subsection 2.1.1 to accurately simulate the whole memory hierarchy, different families of hardware simulators have been pro-posed to answer different functional requirements. In this section, we focus on the hardware simulators designed for hardware-fault evaluation on a single machine.
Reliability is a major objective for cyber-physical systems. Indeed, computing systems are inclined to create a faulty behavior due to manufacturing defects, electromagnetic interference or any other environmental perturbation. Some faulty behaviors are easy to spot as they correspond to a clearly-damaged hardware. However, some other faults such as the Byzantine faults may inject computational errors that are much harder to spot, leading to potentially catastrophic failures. In order to evaluate the effect of faulty behaviors on a simulated hardware, it is mandatory to first accurately simulate the fault-injection.
In [52], the authors propose a fast and flexible hardware-emulator framework designed to evaluate the reliability of a cyber-physical system. The main interest of this framework, compared to existing emulators such as Gem5 [12] and Sim-pleScalar [15], resides in its memory-subsystem emulator. In order to accurately locate the hardware component responsible for a given fault, the author proposes to subdivide the memory simulator in different components: RAM, cache and regis-ters. Each one of these parts is simulated based on its functional algorithm. These parts are also parameterized based on their functional properties (size, associative property, access policy). Similarly to Gem5 [12] and SimpleScalar [15], the simula-tion time in [52] is dramatically reduced by simplifying the model of the components.
Evaluating the occurrence-frequency of faulty behaviors is important for hardware-performance evaluation. Indeed, such behaviors are known to be ex-tremely time consuming [85,52,8,2,33]. Let us consider Byzantine faults1. In [85], the authors evaluate the average time overhead of intermittent hardware-errors 2 on general-purpose computing benchmarks. Using the Microsoft Windows error reporting system, this time overhead is evaluated to up to 39% of the execution
1
Faults that generate erroneous results without crashing nor stopping the functioning of the hardware.
2Intermittent hardware errors represents about 40% of the total hardware failures within the
18 Chapter 2. Scientific Methodology: Performance Exploration
time related to memory accesses. Similarly, the different countermeasures that have been deployed to track and correct hardware faults have a non-negligible effect on hardware-performance. Given the relative complexity of modern architectures, these countermeasures are largely deployed on high-performance and embedded platforms. Even optimized approaches such as [49,33] have a minimal time overhead of roughly 6% on memory access within general purpose architectures and benchmarks.
2.1.3 Instruction-Interpretation Simulators
The simulation tools presented in subsection 2.1.1 and subsection 2.1.2 are widely used in hardware design. However, to the best of our knowledge, no attempt has succeeded in using such hardware-simulation tools for performance evaluation. The reason for that is the granularity at which the hardware is simulated.
Indeed, one of the most time-accurate families of hardware simulators are the instruction-interpretation simulators. These simulators interpret at software-level each low-level instruction of a given execution flow. Since 1990, instruction-interpretation simulators have been used for hardware exploration [77,17,69,12,15]. Given the relatively important simulation time, most studies have only focused on a specific part of the hardware at a time. In [77], the authors use the Wisconsin Wind Tunnel simulator to evaluate some cache-coherency protocols on a manycore architecture. Similarly, other studies have used platforms based on SystemC for architecture evaluation [105, 69, 17]. Different levels of description have been proposed from signal accurate in [105, 69] to message-accurate in [17]. However, all of the SystemC -based solutions have a well known time-efficiency drawback. This excessive overhead is mainly linked to the exponential complexity of these simulator: the modeling implemented in SystemC encompasses all the transient state.
Simulators that interpret low-level instruction are often known as instruction or quasi cycle-accurate. However, in order to have an accurate performance-evaluation of a hardware/software couple, an accurate estimation is required for most instruc-tions and micro-instrucinstruc-tions. To the best of our knowledge, one of the most promis-ing work in terms of timpromis-ing model is proposed by Rosa et al [90]. In this paper, the authors show that the accuracy of the proposed CPU model varies from 0.06% up to 10.56 depending on the used benchmark. Even though other models have shown a lower average accuracy, the model proposed in [90] is the first one to be non-constant (or composed of constant steps in chunks) with regards to CPU pa-rameters (such as the frequency, or the number of cores used). Consequently, this model is the first to be adequate to spot the variable parameters that might bring a significant performance gain and evaluate this potential gain. However, this model only focuses on CPU timing. Thus, it does not consider a performance-critical as-pect which is memory accesses. This model is also designed exclusively for real-time environment running on embedded systems (with hard timing constraints).
2.1. Simulation and Emulation Tools 19
2.1.4 Trade-off Between Accuracy and Execution time
Processor Memory System
CPU Model Classic Ruby
Simple Garnet Atomic Simple Speed Timing Simple InOrder 03 Accuracy
Figure 2.1: Trade-off between simulation-time and hardware-model accuracy (ex-tract from [16]).
In this section, we focus on Gem5 [12], one of the most widespread hardware simulator. The Gem5 is used in several domains, from hardware-design up to computational-language validation. Various researches [86, 3, 65, 30] have been conducted to adapt the simulator to the different hardware-simulation paradigms described in subsection 2.1.1, 2.1.2 and 2.1.3. These researches have also covered different parts and combinations of the described hardware (processor, memories, network and peripherals). Consequently, a study of the Gem5 simulator gives an insight about the advantages, drawbacks and trade-offs to expect from a modern hardware simulator.
The different variants and simulation mode of the Gem5 simulator have been compared within [16]. This comparison is summarized in Figure 2.1. We may notice the different CPU models of the simulator as well as the simulation modes and the memory models. If we consider the example of the memory hierarchy, these different parameters allow to simulate the cache coherency protocols at different scale. The classic mode emulates the cache-coherency messages using a constant-cost unsafe function. The Ruby mode and its Garnet variant allows a more precise simulation of the on-chip network.
It is noteworthy that the main limit to reach an accurate simulation, the main limit is the simulation-time.
2.1.5 Conclusion
The outrageous simulation time of modern hardware platform makes it impossible to use a simulator within the optimization methodology introduced in section 1.3. Indeed, the amount of data required by our method can not be simulated within less than months for very simple peace of codes that would run in few seconds on
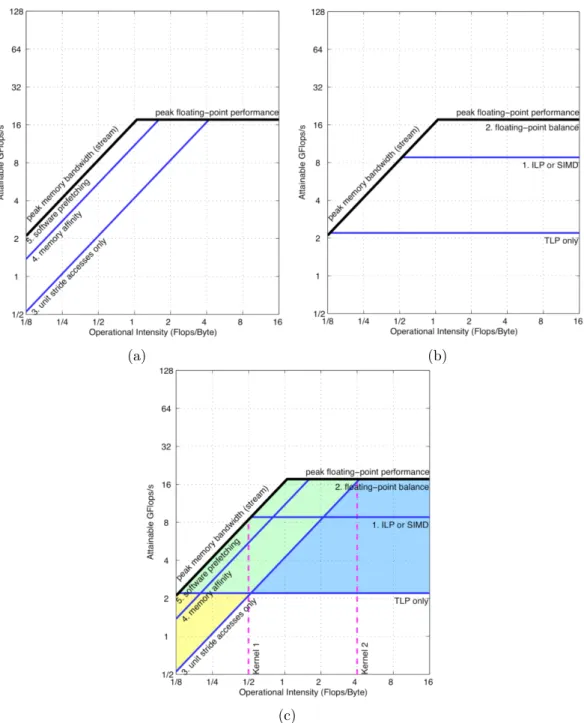
20 Chapter 2. Scientific Methodology: Performance Exploration
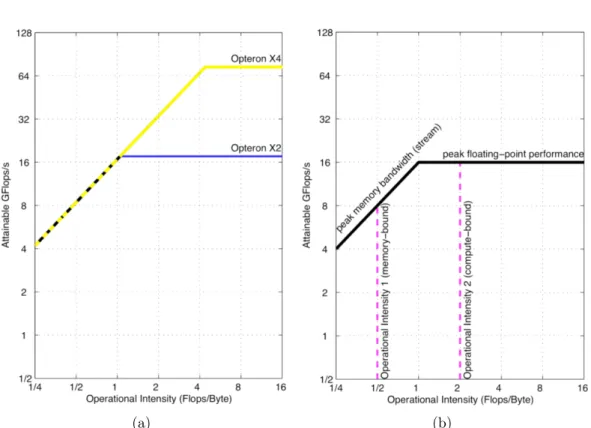
(a) (b)
Figure 2.2: Roofline Model for (a) AMD Opteron X2 and (b) Opteron X2 vs. Opteron X4 (extract from [112]).
the physical platform.
Meanwhile, our initial experiments with Gem5 show that lowering the simulation-model accuracy is not an acceptable workaround. Even if we only slightly go up within the speed-accuracy curve in Figure 2.1, the performance results become un-exploitable. Indeed, the performance function looses its dependency from most considered hardware parameters, while the physical execution shows a clear depen-dency to the same parameters. Loosing such functional dependencies is crippling for our analytical approach.
Finally, following the same experimentation, we concluded that using a trace-based version of Gem5 does not solve our simulation-time issue. Indeed, even though this simulation mode may reduce the number of instructions simulated, the corre-sponding timing model requires a high number of instructions in order to reach an accurate-enough estimation of the execution time.
2.2
Hardware and Software Performance Modeling: The
Roofline
model
The emergence of multi-core hardware architectures has significantly increased the difficulty to assess the performance of software and kernels. A simple and yet ac-curate approximation of the performance of these architectures is thus mandatory
2.2. Hardware and Software Performance Modeling: The Roofline
model 21
to help software developers evaluate their programs and decide which optimization strategy to implement.
2.2.1 Hardware Boundaries (Roof )
The Roofline model [112] is an intuitive visual performance model used to asses a hardware/kernel couple. It allows, as a first approximation, to bound the com-putation performance (expressed in terms of floating-point) of a given multi-core processor according to its memory-bandwidth performance. An instance of this model for two AMD processors is presented in Figure 2.2. The main concept that the Roofline model lays on is the operational intensity : operation per byte of DRAM traffic. This allows the model to relate to a highly-constraining resource: the off-chip memory bandwidth. As shown in Figure 2.2b, the Roofline model indicates for a given kernel (defined by its operational intensity) whether the potential performance bottleneck is the computations or the memory accesses. This upper bound of the considered hardware architecture is built using:
• The hardware peak floating-point (delivered by the manufacturer), which gives the compute-bound section (constant) of the model.
• The hardware peak memory-bandwidth (delivered by the manufacturer or through micro-benchmarks) and the operational intensity (specific to a kernel or a program). These two measures give the memory-bound section (linearly increasing) of the model.
2.2.2 Fitting the Model to the Memory/Computational
Optimiza-tions (Ceiling)
In order to model more accurately the performance of a kernel running on the considered hardware, the Roofline model allows to enhance the estimation accuracy by reducing the previously defined boundary. This reduction is processed according to the optimizations implemented by the software: each optimization is mapped to the threshold curve that it potentially allows to surpass. The model allows to distinguish between two types of optimizations. The first type is the memory-linked optimizations instantiated inFigure 2.3a. Its impact on the performance is assessed by evaluating the reduction brought by the considered optimization on the memory transfers (hence the repercussion on the operational intensity). The second type of improvement is the compute optimizations instantiated in Figure 2.3b. Its impact is assessed through the evaluation of the gain in terms of computed operations in Flops. The objective of this model refinement is to rank the potential optimizations based on the corresponding gain. It also aims at determining the ones that would have no impact.
22 Chapter 2. Scientific Methodology: Performance Exploration
(a) (b)
(c)
Figure 2.3: Refining the Roofline model depending on the used (a) memory opti-mization and (b) compute optiopti-mization. Data corresponding to an AMD Opteron X2 and (c) Opteron X2 processor (extract from [112]).
2.3. Performance Measurement 23
2.2.3 Interest of the Roofline Model
The main interest of the Roofline model is its user-friendliness. The developer may simply generate a performance approximation of his software and host hardware; this brings a precious help to identify the software optimizations that worth being implemented. The Roofline model also allows a relatively accurate evaluation of the impact of memory on the considered performance. The model considers the exchanges between the DRAM and the caches to measure the memory impact. Indeed, the model considers the exchanges between the DRAM and the caches as a measure of the memory impact. Such an access is most often longer than an access between the processor and the caches (excluding DMA processors). Thus, it is more likely to represent a bottleneck resource.
2.2.4 Conclusion: Limitation of the Roofline Model for our Ap-proach
In the Roofline model, the upper-bound linked to each memory optimization (ceil-ing) is said to have no impact on the performance of a computation optimization. Indeed, memory optimizations might very likely be done through extra computations (trade-off between computation and memory). Consequently, these optimizations might compete with the payload computations. Hence, the reduction in the peak floating-point performance.
However, the impact of the considered memory optimizations is reflected on the increase of the computations required to reach the peak floating-point performance (steady-state). This increase might be observed through different variants in the definition of the operational intensity [112,44,79].
Similarly, even though the Roofline model is a very handy tool for guiding program-mer optimization, it is harder to integrated to an automated software optimizer. The main reason is that the model shows no impact of memory optimizations on the operation intensity of the kernel.
2.3
Performance Measurement
Optimizing an application for a given hardware platform has been increasingly dif-ficult through the last decades. The challenge of such a task comes mainly from the increasing complexity of modern microarchitectures, the diversity of workloads and the huge amount of data produced by performance tools. Meanwhile, the con-stantly growing distance between compute and memory-access time creates a new yet acknowledged challenge for hardware performance counters [13]: The differ-ent attributes (such as the frequency, access time and operation rate) of these two hardware parts lay at different orders of magnitude. This difference makes it dif-ficult to evaluate within the same hardware parts (PMU, performance registers or performance monitoring software tools) the impact of memory or computation on performance.
24 Chapter 2. Scientific Methodology: Performance Exploration
In this section, we give an insight about the challenges and solutions proposed to accurately measure performance within a HPC ecosystem. The objective of the presented tools and methods is to identify and evaluate the impact of performance bottleneck. For the sake of clarity, we use the terminology and example used by the Intel processor and performance tools. However, similar principles are used by other hardware platforms with potentially a different terminology.
2.3.1 Hardware Performance Counters
Performance monitoring is a predominant issue among hardware designer. In modern hardware platforms, different devices are shipped and used for software-performance measurement. Initially, these hardware-performance counters were designed for other purposes than software monitoring (e.g. tension, frequency or derived physical quantities) [76]. Consequently, different accuracy and correctness issues have to be considered when using these hardware counters for software-performance measurement.
Nowadays, hardware performance monitoring has become intrinsically linked to the hosted software. It refers to any hardware mechanism that enables (not necessarily by design) insight into how software performs on a microprocessor. This definition includes features as simple as timer-based interrupts, but also a broad range of things like event counters, last branch buffers, instruction-based samples, and many more [76]. For most hardware manufacturers, the performance monitoring devices are gathered within the PMU. This hardware block is usually made of different special registers called performance registers. An example of such a register is represented in Figure 2.4. At a given time, a single register may be in charge of storing different physical quantities. The sampling, multiplexing and ordering of these registers is usually managed by user libraries (subsection 2.3.2).
Figure 2.4: Layout of the IA32-PERFEVTSEL MSR (extract from [23]).
The main principle used for hardware performance-performance monitoring is the event. It defines the physical quantity that is measured. In the Intel hierarchy,
2.3. Performance Measurement 25
each event is encoded within the two first logical gaps of MSR (see bits zero to fifteen inFigure 2.4). These events are divided within five categories, namely (i) program characterization, (ii) memory accesses, (iii) pipeline stalls, (iv) branch prediction, and (v) resource utilization. When the event detector of a PMU receives a given event, the MSR that has initially been mapped to the considered event is updated depending on the type of event, the MSR configuration and the type of performance measurement. The first type of performance measurement is known as counting performance measurement. It consists of measuring the total number of events that arises in a given time slot. The second type is known as event-based sampling. It consists of triggering an interruption (overflow) to the processor whenever a config-ured number of the considered event has been triggered. Then the interruption is handled by instructing the PMU to save the status flags of the used MSR in order to be latter reported to the user.
(i). Program characterization events allow to monitor low-level instructions independently from the processor’s implementation or the Instruction Set Architecture (ISA). This gathers all the metrics that are only relative to the software layers (from the operating system up to the end-user program) such as the number of load, store, branch of floating point instructions.
(ii). Memory accesses events are probably the most relevant to detect perfor-mance bottlenecks in the context of the memory wall. A use-case of such events is the enumerating of hit/misses relative to the different data, instruc-tion and TLB caches.
(iii). Pipeline stalls indicate how filled is the instruction pipeline of the processor. Even though such an information would be very useful to determine the operational intensity of a kernel, it is hardly usable in the context of multicore or a manycore processors. The pipeline-filling rate observed through this pipeline-stall events gathers instructions belonging to all the processes sharing the same pipeline (hence the same CPU). Thus, the information regarding a given process is drowned by the instructions of the concurrent processors. (iv). Branch prediction events allow to monitor predictive-branching
instruc-tions generated by the compiler, the prefetcher or the hardware branch pre-dictor.
(v). Resource utilization encompasses all the events triggered when the pro-cessor access some specific ressource (e.g floating point accelerator, data, instruction or TLB caches).
The performance counters have proven to be very useful in hardware and software co-development. They have allowed for instance to fix FDIV, a major performance bug on the Intel Pentium III Pro [84]. However, the design of MSRs and more generally of PMUs is also known for its different and complex performance bugs.
26 Chapter 2. Scientific Methodology: Performance Exploration
First, overflows are a very recurrent and hard-to-spot issue for PMU registers. Indeed, the number of bits reserved to store a given physical quantity within an MSR is fixed. Given that the encoding method used is also fixed, an overflow on a performance register may not be treated3. Meanwhile, given that the register keeps only minimal information regarding the user-process that is tracked, an overflow is only stored on a register until the next trigger of the same event. Once the new event is triggered, the performance register does not show that the stored information is not relevant anymore.
Second, the accuracy of a performance measurement based on a PMU register may significantly and inexorably suffer from the MSR design choice. The number of MSRs is usually much lower than the number of handled performance-events (roughly ten physical registers for about two hundred events). Similarly, for the same hardware limitations, different events may be measured by the same digital logic (such as the number of misses for different caches within the same CPU core). The implemented solution for these hardware issues is time multiplexing (for both registers and digital logic). The events are measured in small and disjointed periods. The total measurement is then deduced through polynomial interpolation. Given that the sampling period is constant and not calibrated to the measured event, important variations may happen out of the sampling duration. In this case, the interpolated functions would significantly vary from the real one making the end-user result unreliable.
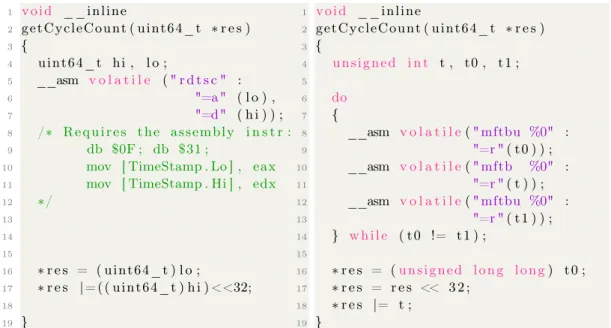
Finally, other accuracy issues may downgrade performance-evaluation accuracy in a parallel and multi/manycore environment. Indeed, we represent in Figure 2.5 the C/C++ code used to access a CPU-cycle count on two state-of-the-art proces-sors implementing an event-based PMU. We notice from these code snippets that accessing performance register requires multiple low-level instructions. Even though the time stamp of these instructions may be soften by the instruction-pipeline of the processor, accessing the register is not an atomic operation. Consequently, in the context of concurrent processes, register-time multiplexing or simply important workload, this operation requires additional synchronization. In addition to the well known time constraint [81], such a synchronization may significantly influence the the execution-time of the overall code that is assessed.
2.3.2 Performance Measurement Libraries
In subsection 2.3.1 we showed the limitations of the hardware blocks designed for performance monitoring. In order to lighten these accuracy and time-overhead issues, it is mandatory to have an adequate software to manage the PMU. In this section, we present different software and libraries designed to access at user-level the different features of the hardware PMUs. The objective is to explain how and 3An example of such a treatment would be to change the encoding method and potentially
![Figure 2.1: Trade-off between simulation-time and hardware-model accuracy (ex- (ex-tract from [16]).](https://thumb-eu.123doks.com/thumbv2/123doknet/14658138.739117/34.892.287.629.216.439/figure-trade-simulation-time-hardware-model-accuracy-tract.webp)
![Figure 2.4: Layout of the IA32-PERFEVTSEL MSR (extract from [23]).](https://thumb-eu.123doks.com/thumbv2/123doknet/14658138.739117/39.892.193.700.806.1003/figure-layout-ia-perfevtsel-msr-extract.webp)
![Figure 3.1: Cache-fetch behavior while accessing a data at an address a. a[L]](https://thumb-eu.123doks.com/thumbv2/123doknet/14658138.739117/52.892.219.703.871.1004/figure-cache-fetch-behavior-accessing-data-address-l.webp)