HAL Id: hal-02531107
https://hal.archives-ouvertes.fr/hal-02531107
Submitted on 3 Apr 2020HAL is a multi-disciplinary open access
archive for the deposit and dissemination of sci-entific research documents, whether they are pub-lished or not. The documents may come from teaching and research institutions in France or abroad, or from public or private research centers.
L’archive ouverte pluridisciplinaire HAL, est destinée au dépôt et à la diffusion de documents scientifiques de niveau recherche, publiés ou non, émanant des établissements d’enseignement et de recherche français ou étrangers, des laboratoires publics ou privés.
southern Gulf of Mexico
Ovel Díaz-García, Jorge Zavala-Hidalgo, Pascal Douillet, Adolfo Contreras
Ruiz-Esparza, Renaud Fichez, Christian Grenz, Lionel Denis
To cite this version:
Ovel Díaz-García, Jorge Zavala-Hidalgo, Pascal Douillet, Adolfo Contreras Ruiz-Esparza, Renaud Fichez, et al.. Changes in the flooding area due to storm surge under climate change in an extensive wetland area in the southern Gulf of Mexico. Atmosfera, Universidad Nacional Autonoma de Mexico, 2020, 33, pp.105 - 121. �10.20937/ATM.52702�. �hal-02531107�
© 2020 Universidad Nacional Autónoma de México, Centro de Ciencias de la Atmósfera. This is an open access article under the CC BY-NC License (http://creativecommons.org/licenses/by-nc/4.0/).
Changes in the flooding area due to storm surge under climate change in an
extensive wetland area in the southern Gulf of Mexico
Ovel DÍAZ-GARCÍA1, Jorge ZAVALA-HIDALGO1*, Pascal DOUILLET2,
Adolfo CONTRERAS RUIZ-ESPARZA1, Renaud FICHEZ2, Christian GRENZ2 and Lionel DENIS3
1Centro de Ciencias de la Atmósfera, Universidad Nacional Autónoma de México (UNAM), Circuito Exterior s/n, Ciudad Universitaria, Coyoacán, 04510 Mexico City, Mexico.
2IRD, Aix-Marseille Université, Université de Toulon, CNRS/INSU, Mediterranean Institute of Oceanography MIO UM 110, Campus Universitaire de Luminy, 13288 Marseille, France.
3Laboratoire d’Océanologie et de Géosciences (LOG) UM 8187, Université des Sciences et Technologies de Lille, Wimereux, France.
*Corresponding author; email: [email protected]
Received: March 25, 2019; accepted: September 3, 2019 RESUMEN
Se estudian, mediante el análisis de observaciones y simulaciones numéricas, las inundaciones causadas por frentes fríos intensos y cómo éstas podrían cambiar en diferentes escenarios de aumento del nivel del mar en la Laguna de Términos, México. El modelo numérico de circulación oceánica utilizado es el Finite-Volume Community Ocean Model (FVCOM) del Laboratorio de Modelado de Dinámica de Ecosistemas Marinos de la Universidad de Massachusetts-Dartmouth, y el forzamiento meteorológico proviene de simulaciones de alta resolución con el modelo Weather Research and Forecasting (WRF). Las simulaciones oceánicas se llevaron a cabo utilizando mallas no estructuradas y configuraciones con la posibilidad de inundación y secado en las celdas. Los resultados de las simulaciones numéricas se compararon con observaciones. Teniendo en cuenta el nivel del mar actual, un evento intenso de Norte inunda un área de 940 km2, que actualmente está cubierta por manglares. Esto indica que los Nortes son importantes en la irrigación de extensas áreas de manglar. Para los escenarios de aumento del nivel del mar de 0.25, 0.50 y 0.75 m, las áreas inundadas se incrementan en 297, 1062 y 2152 km2, respectivamente, lo cual implica un aumento considerable en las áreas inundadas en Isla del Carmen. Se sugiere considerar estos resultados en la planificación a largo plazo.
ABSTRACT
Floods caused by intense cold fronts and how they could change under different scenarios of sea level rise in the Terminos Lagoon, Mexico, are studied through the analysis of observations and numerical simulations. The numerical ocean model used is the Finite-Volume Community Ocean Model (FVCOM) of the Marine Ecosystem Dynamics Modeling Laboratory of the University of Massachusetts-Dartmouth, and the meteo-rological forcing comes from high-resolution simulations with the Weather Research and Forecasting model (WRF). The ocean simulations were carried out using unstructured meshes with the possibility of flooding and drying in their cells. Results of the numerical simulations were compared against observations. Consid-ering the current mean sea level, an intense northern cold front event (or Norte) floods an area of 940 km2 that is currently covered by mangroves. This indicates that Nortes are important in the irrigation of extensive mangrove areas. Under scenarios of sea level rise of 0.25, 0.50 and 0.75 m the flooded areas increase by 297, 1062 and 2152 km2, representing a considerable increase in the areas flooded at Isla del Carmen. It is suggested to consider this situation in long-term planning.
1. Introduction
During the past decades, storm surge events had caused more casualties and economic loses than any other natural disaster. The disasters caused by hurricane storm surges are well known, such as those occasioned by Katrina (2005), Sandy (2012), Ike (2008), Gilbert (1988), and the catastrophic ex-treme events that caused more than 100 000 deaths in Bangladesh (Khalil, 1992) and in the Bay of Bengal (Murty et al., 1986). In recent years, some researchers have studied the impacts of wind waves and storm surges associated with hurricanes and cold fronts on the Mexican coast. Based on a 30-yr wave hindcast, Appendini et al. (2014) found that in the Gulf of Mexico (GoM) the wave climate is mainly modulated by autumn-winter cold fronts, whereas extreme wave climate is modulated by both hurricanes and Nortes, which are anticyclonic cold surges that enter the GoM from North America, generating strong northerly winds and, therefore, presenting ideal conditions for fetch that cause mature wind waves (Ojeda et al., 2017). During Nortes in the GoM, the sustained prevailing winds blow southward and southeastward depending on the origin and orientation of fronts (Henry, 1979); therefore, they are expected to gener-ate a displacement of sea wgener-aters to the south, where the wide continental shelf in the southern GoM favors the amplification of the storm surge processes.
Nortes can be very intense, with maximum winds above 60 km h–1, which makes them comparable
to a tropical storm. They are commonly associated with intense winds, rain, temperature decrease, and navigation hazards, but not with the storm surge that they may generate, except for some cases in the southern hemisphere (McInees and Hubbert, 2003). In addition to the difference in wind intensity, and the fact that tropical cyclones occur in summer and early autumn while Nortes occur in late autumn and winter, one of the main differences between them is their frequency of occurrence. For example, in the last 150 years an average of only 0.16 tropical cyclones per year has been recorded for the Yucatan Peninsula (Rey et al., 2018), but there have been 16 to 24.5 Nortes per year in this area, depending on how they are defined (Reding, 1992; Appendini et al., 2018). Due to this high occurrence of Nortes, Rey et al. (2018) performed a 30-yr water-level hindcast to assess its influence on the hydrodynamic
processes of the Chelem lagoon and the flooding hazard associated to them in the northern Yucatan Peninsula.
Estimations of sea level rise (SLR) at a global scale have been performed using tide gauges for more than 100 years, and more recently, since 1993, they are based on satellite information. Globally, sea level has been increasing around 3.2 ± 0.4 mm yr–1 (Church
et al., 2013). For the Mexican Gulf of Mexico, the Servicio Mareográfico Nacional (National Sea Level Service of Mexico) has reported an increase along the coasts that varies from 1.9 to 3.4 mm yr–1 from
Tuxpan, Veracruz, to Progreso, Yucatan, showing that regional sea level is also increasing (Zavala-Hidalgo et al., 2011).
Considering that Nortes in any year are more frequent than hurricanes, and that sea level is increas-ing, investigating storm surges and floods caused by Nortes in the southern GoM is a key issue for climate change adaptation strategies. To do so, a possible approach is to reproduce numerically an event of an intense Norte that was accurately measured with several instruments, and then quantify the modifi-cation in flood areas under different SLR scenarios due to climate change. In this study, we present such quantification for the Términos Lagoon (TL) in southern GoM.
2. Data and methods 2.1 Study region
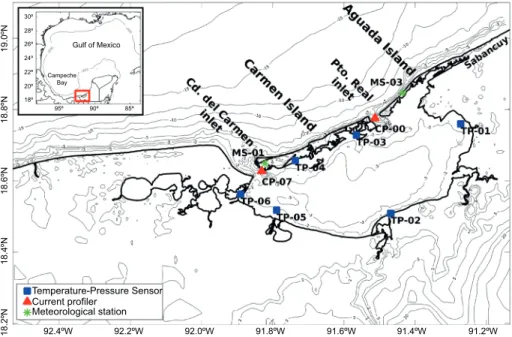
The study area is the TL, the largest coastal lagoon in Mexico (Kjerfve and Magill, 1989), which is located in the southern GoM (Fig. 1). The TL is about 75 km long and 35 km wide, occupying an approximate area of 2000 km2. When including
adjacent marshes and fluvial-lagoon systems, the surface extends to approximately 2500 km2, which
together with the surrounding wetlands account to a total area of 7050 km2 to form the largest Ramsar
site (designated so under the Ramsar Convention on Wetlands of International Importance) in Mex-ico (Mitsch and Hernández, 2013). Four important rivers flow into the TL, facilitating the processes of water renewal. The average lagoon depth is 3.5 m, and it is separated from the GoM by two islands: Carmen Island, which is 38 km long and 2.5 km wide, and Aguada Island, which is 38 km long and
900 m wide. The lagoon is connected to the GoM through three inlets (Fig. 1). The first one is the Ciudad del Carmen (CdC) inlet, located west of the TL, which has 3.7 km wide, a maximum depth of 19 m, and an average depth of 4.5 m. The second one is the Puerto Real (PtR) inlet, located north of the TL, which has 3.2 km wide, a maximum depth of 12 m, and an average depth of 3.5 m. The third one is the Sabancuy inlet, which is located 22.6 km away from the main lagoon and is connected to it by a narrow and shallow channel, with a flow significantly smaller than observed in the other two inlets (Contreras et al., 2014). Therefore, this inlet is neglected in this study.
The largest population in the vicinity of the TL is that of Ciudad del Carmen, with around 180 000 inhabitants, located in the western part of Carmen Island. The city stands out as an important center of operations for Petróleos Mexicanos (PEMEX), which maintains its most important hydrocarbon operations area in the Campeche Sound (García-Cuéllar et al., 2004). From the economic point of view, it is the most important city of the state of Campeche and the third municipality with the highest economic income at the national level (INEGI, 2016).
As part of the Joint Environmental Study of Términos Lagoon (JEST) project, launched in 2009 between France and Mexico to perform a multidis-ciplinary study of the environmental processes in the region, many measurements were collected to support numerical simulation efforts aimed at under-standing the TL hydrodynamics and its interaction with the GoM. Observations from the JEST project were used in this work, particularly those of physical parameter measurement campaigns, the water level measurements, and the bathymetry data described by Contreras et al. (2014).
Previous studies have described hydrodynamics in the TL and its interaction with the GoM. Contreras et al. (2014) included an extensive revision of those studies, which can be divided into those based on ob-servations and those using numerical modeling. Most of the numerical modeling studies were performed to characterize tides and the general circulation pattern inside the TL (David and Kjerfve, 1998; Robadue et al., 2004; Contreras et al., 2014). In Contreras et al. (2014), simulations only include tidal forcing at the open boundary, without considering wind forcing and
thus ignoring its contribution to the water level and the lagoon circulation patterns.
A more recent study by Kuc et al. (2015) presents a numerical simulation of the hydrodynamics of the TL using an unstructured mesh covering the land, sea, and lagoon. These authors focused mainly on the circulation patterns inside the lagoon, for dif-ferent meteorological events and tidal conditions, and describe regions based on the intensity of the currents, but they did not review the flooding in the surrounding areas of the TL.
Since none of the previous studies analyzed storm surge flooding, even when tropical storms and intense Nortes affect the region, in this study we analyze the impact of the Norte #33 of February 2010, which was very intense, with maximum winds of 110 km h–1 that caused a significant surge of sea level on the
southern coast of the GoM due to its direction and persistence (Chim et al., 2010).
2.2 Measurements
During Norte #33 there were several instruments deployed in the TL to measure physical variables as part of the JEST project. The location of the Acoustic Doppler Current Profilers (ADCPs) and tempera-ture-pressure (TP) sensors is shown in Figure 1. Of the temperature-pressure sensors that were installed, the TP-01 was lost at the end of January 2010, where-by the data series at that location starts on July 5, 2010. Also, during the Norte, one of the safety loops of the TP-06 sensor broke due to the strength of the waves, and data collected after the Norte event were noisy. Therefore, those measurements were discard-ed. The data from the other four TP sensors (TP-02, TP-03, TP-04, and TP-05) were used in the analysis, along with two current profilers (CP-00 and CP-07). All these sensors collected data every 10 min.
Meteorological data, including wind speed and direction, wind gust speed and direction, pressure, temperature, air humidity, precipitation, and solar radiation, were obtained from two stations of the Mexican Weather Service. The first station, MS-01, was in Carmen Island and the second one, MS-03, in Aguada Island. These stations have a 10-min sampling frequency. We used wind speed and direc-tion, and pressure to compare with the WRF model output at each station (the WRF model is described in section 2.4).
2.3 Bathymetric and topographic information
The same bathymetric data described by Contreras et al. (2014) was used. This bathymetry was obtained from the digitization of nautical charts of the Mexi-can Navy and echo sounding campaigns during the monitoring period.
For the terrain elevation data, LIDAR data of 5 m resolution from INEGI (2012) was processed. Due to limited computing resources, we sub-sampled data at a resolution of 25 m, which was considered enough for the flood model resolution.
2.4. Meteorological model
The WRF model (Skamarock et al., 2008) is a meso-scale numerical weather prediction system designed to serve both operational forecasting and atmospheric research purposes. The effort to develop the WRF model is a collaborative partnership between research centers, government institutions, and some United States universities (NCAR, 2009).
A high-resolution configuration of the WRF mod-el, with three nested domains, was implemented for this study. The first domain has 62 × 46 points with 25 km resolution; the second domain has 96 × 76 points with 5 km resolution, and the third domain has
206 × 156 points with a 1 km resolution. The higher resolution of the Geographical Static Data provided for the WRF-Preprocessing System (WPS) is 30” (~ 900 m). However, after reviewing the quality of the data in the study area, we decided to create a 7” (~ 210 m) resolution data of the topography heights and land use.
For the simulations, the WRF model configura-tion used a Mercator projecconfigura-tion, a time-step of 100 s for the first domain, 50 vertical levels, one-way nesting, and hourly outputs. Schemes used in the model physics were the Kain-Fritsch for cumulus parameterization, Noah Land Surface Model, Rapid Radiative Transfer Model (RRTM) for longwave radiation, Dudhia for shortwave radiation, and Yonsei University (YSU) scheme for the planetary boundary layer (NCAR, 2009).
The initial and boundary conditions were taken from the Climate Forecast System Reanalysis (CFSR) data. The CFSR (Saha et al., 2010) is a global, high-resolution, coupled atmosphere-ocean-land surface-sea ice system designed to provide the best estimate of the state of these coupled domains. The CFSR is superior to previous NCEP reanalysis with respect to the improved model parameterizations,
91.2ºW 91.4ºW 91.6ºW 91.8ºW 92.0ºW 92.2ºW 92.4ºW 18.4ºN 18.6ºN 18.8ºN 19.0ºN 18.2ºN Gulf of Mexico Campeche Bay 30º 28º 26º 24º 22º 20º 18º 95º 90º 85º Temperature-Pressure Sensor Current profiler Meteorological station
Fig. 1. Términos Lagoon in the southern Gulf of Mexico. The location of different measuring instruments (described in section 2.2) and bathymetry-topography contours (in meters) are indicated.
finer resolution, advanced assimilation schemes, atmosphere-land-ocean-sea ice coupling, and assim-ilation of satellite radiances rather than retrievals, while accounting for changing CO2 and other trace
gasses, aerosols, and solar variations.
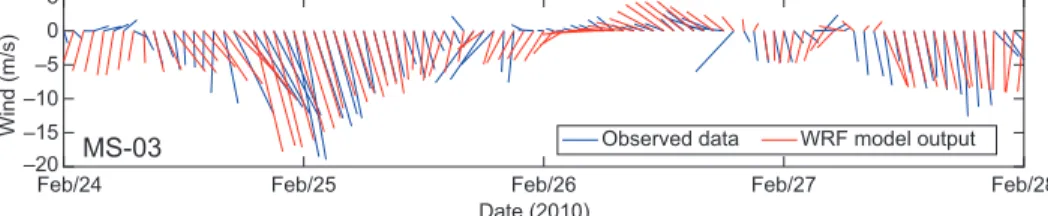
The time series of wind speed and surface pressure of the WRF hourly outputs were extracted for the grid points closest to the locations of the two meteorolog-ical stations (MS-01 and MS-03) to compare with the observations. The WRF model was able to capture the Norte events occurred during the simulation period. There is a good representation of the wind speed intensification during the occurrence of the Norte, as well as for the cycle of sea-land breezes. In Figure 2, the wind speed and direction are compared with ob-servations from the meteorological station at Aguada Island (MS-03). The MS-01 station has not data during the Norte, but for the rest of the measurement period the data for this station shows less directional variability compared to the MS-03 station. Not all the wind variability is reproduced due, in part, to the effect on the wind direction generated by some tall buildings near the meteorological station. When the wind changes its magnitude or direction, there are a few hours lag between the model simulation and ob-servations, as happened with the maximum value of the wind speed that was registered five hours before in the model than in the station (Fig. 2).
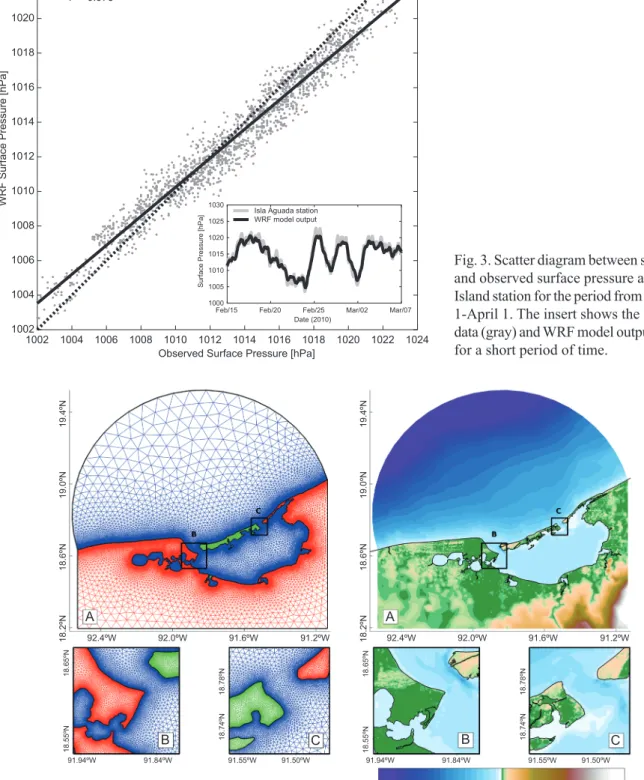
The scatter diagram between the surface pres-sure data from the WRF and the observations at the Aguada Island site shows a good correlation (r = 0.9783), but the model slightly underestimates the amplitude of the variations (Fig. 3). A short period of the surface pressure time series is also included in Figure 3, where the similarity between the observed and simulated data is evident, although the model is not able to adequately reproduce the higher frequency variations.
2.5 Storm surge modeling
The Finite-Volume Community Ocean Model (FVCOM v. 4.1) was used to study the flooding area. FVCOM is an unstructured-grid, finite-volume, free-surface, 3-D primitive equation coastal ocean circulation model developed by Chen et al. (2003). More recently, its development has been part of a joint effort between the University of Massachu-setts-Dartmouth (UMASSD) and the Woods Hole Oceanographic Institution (WHOI). This model is well suited for simulating the circulation and eco-system dynamics from global to estuarine scales, particularly for regions characterized by irregular complex coastlines, islands, inlets, creeks, and in-tertidal zones. FVCOM has been applied to the deep ocean (Chen et al., 2009), the continental shelf (Chen et al., 2008a; Weisberg and Zheng, 2008; Weisberg et al., 2009; Rego and Li, 2010), and estuaries (Chen et al., 2008b; Weisberg and Zheng, 2006; Yang and Khangaonkar, 2008). Especially for storm surge events, FVCOM has a 3D wet/dry point treatment to simulate inundation in estuaries and wetlands (Chen et al., 2008b, 2013; Beardsley et al., 2013).
2.5.1 Model setup
The creation of unstructured meshes is a complex task, but there are many free software and commercial tools to accomplish this task. One of the most valu-able adopted tools is MESH2D (Engwirda, 2014), which is a MATLAB/OCTAVE-based unstructured mesh-generator for two-dimensional polygonal ge-ometries, providing a range of relatively simple, yet effective two-dimensional meshing algorithms. The unstructured mesh created for this study (Fig. 4), has 178 716 nodes and 357 218 cells or triangular elements. The length of the smallest elements is about 30 to 50 m along the coastline and the largest is about 10 km in the area farthest from the coast.
Feb/24 Feb/25 Feb/26 Feb/27 Feb/28
Date (2010) –20 –15 –10 –5 0 5 Wind (m/s )
MS-03 Observed data WRF model output
Fig. 2. Comparison between the observed wind data (blue) and WRF model output (red) for the Aguada Island station.
Fig. 3. Scatter diagram between simulated and observed surface pressure at Aguada Island station for the period from February 1-April 1. The insert shows the observed data (gray) and WRF model output (black) for a short period of time.
19.4º N 19.0º N 18.6º N 18.65º N 18.78º N 18.74º N 18.55º N 91.94ºW 91.55ºW 91.50ºW 18.78º N 18.74º N 91.55ºW 91.50ºW 91.84ºW 18.65º N 18.55º N 91.94ºW –40 –30 –20 –10 0 10 20 30 40 91.84ºW 18.2º N A B C B C A 19.4ºN 19.0ºN 18.6ºN 18.2ºN 92.4ºW 92.0ºW 91.6ºW 91.2ºW 92.4ºW 92.0ºW 91.6ºW 91.2ºW
Fig. 4. Unstructured mesh generated with MESH2D for the Términos Lagoon domain. Left panel: (a) mesh for the entire domain and (b, c) zoomed areas showing the TL inlets, where the red color represents land cells, blue color the ocean and lagoon cells, and green color the island cells. Right panel: bathymetry and altimetry of the mesh (in meters) according to the color bar.
1002 1004 1006 1008 1010 1012 1014 1016 1018 1020 1022 1024 Observed Surface Pressure [hPa]
1002 1004 1006 1008 1010 1012 1014 1016 1018 1020 1022 1024
WRF Surface Pressure [hPa
]
Data
Observed = Model Y = 0.84*X + 162.50 r = 0.978
Feb/15 Feb/20 Feb/25 Mar/02 Mar/07 Date (2010) 1000 1005 1010 1015 1020 1025 1030
Surface Pressure [hPa
The mesh has nodes in sea and land to study the floods produced by intense extreme events and to make easier the identification and quantification of flooded areas. The bathymetry and topography data were interpolated to the mesh nodes using an Inverse Distance Weighted function (gIDW) implemented in MATLAB (Langella, 2010).
The FVCOM model was configured to run in 2D barotropic mode instead of the full 3D baroclinic mode (Weisberg and Zheng, 2008; Zheng et al., 2013). This was decided after some tests to evaluate the performance of the model to reproduce the mea-surements of the sensors and comparing the flood areas obtained with both modes. The tests showed no significant differences, but the computation time using the 2D barotropic mode was 40 to 45% less compared to the 3D baroclinic mode. Also, the flooding process involves the transport of small water columns, for which a 2D barotropic mode is considered appropriate.
For the storm surge simulations, the model was forced by wind speed and atmospheric pressure acting on the surface, and tide elevation at the open boundaries. The 10-m zonal and meridional wind components (U10, V10) and surface pressure (PSFC) variables were extracted from the WRF simulation. The tidal elevation consists of eight major tidal constituents (M2, S2, N2, K2, K1, O1, P1, and Q1)
obtained from the TPXO7.2 database (Egbert and Erofeeva, 2002) and interpolated to the mesh nodes at the open boundary. To avoid artificial numerical modes from being generated by a sudden impulse of the initial condition (Chen et al., 2006), the tidal forcing was increased from zero to its full value over two M2 tidal cycles. The time step used for the
external mode was 2 s, and the output of the model is hourly. Several test simulations were performed with different spatial-varying bottom roughness co-efficients to better reproduce the tidal signal inside the TL. We made variations of the bottom roughness coefficients considering depth and type of sediment, which varied from 0.001 m to 0.014 m.
The discharge of the four main rivers in the region was not considered in this study due to their relatively low contribution of water to the TL. Based on data obtained during the JEST project (e.g. Contreras, 2017), it was estimated that, during the first quarter of the year, the average flux of the four rivers was
140 m3 s–1, with 99 m3 s–1 occurring in March. This
average volume represents 0.7% of the total volume that is interchanged through the CdC inlet during high tides. During the rainy season this average increases up to 900 m3 s–1 (4.56%), with peaks of 1040 m3 s–1
in the year 2010.
Two simulations were performed for the Norte event: (a) a baseline run with the model forced only by tides (called only-tide); (b) a hindcast run with the model forced by tides, winds, and pressure (called tide+wind). There were three other runs to study the SLR effect on the flooding area: (c) the model forced by winds, pressure, and tides, plus an increment of 0.25 m in the mean sea level at the boundary con-ditions (called +SLR25); (d) the same as in (c) but with an increment of 0.50 m (called +SLR50); and (e) the same as in (c) but with an increment of 0.75 m (called +SLR75).
The supercomputers of the Universidad Nacional Autónoma de México (UNAM) and the Centro de Ciencias de la Atmósfera (CCA) of UNAM were used to perform simulations of both models, WRF and FVCOM. The WRF model is more complex numeri-cally than FVCOM and requires more computational resources and time to perform the simulation.
2.5.2 Model validation
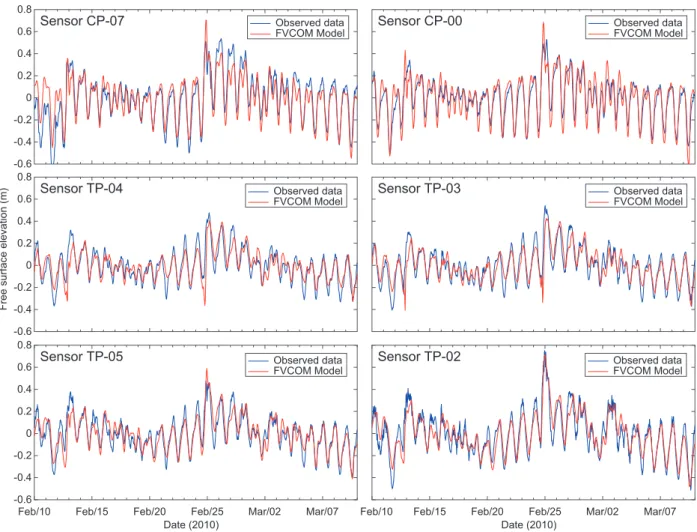
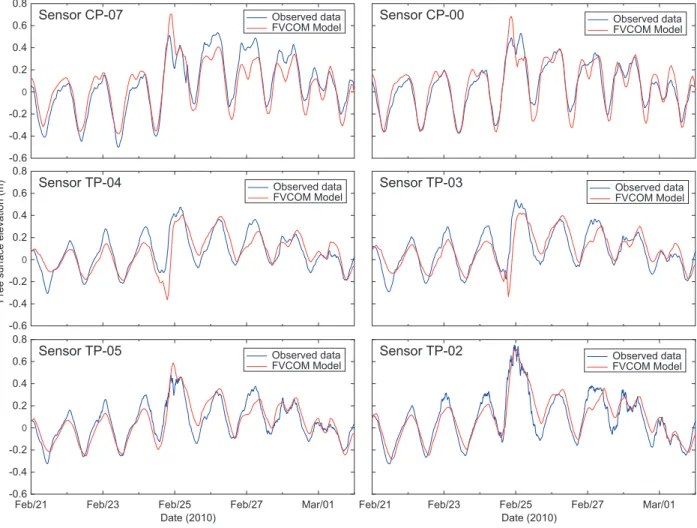
The hindcast run (b) was conducted to validate the performance of the FVCOM model, comparing the outputs with measurements. The simulation period was three months, from January 1 at 00:00 GMT to April 1 at 00:00 GMT, 2010. The first month was discarded and used as a model spin-up, and the entire statistical analysis was performed using the last two months of the simulations (February-March, 2010). Figures 5 and 6 show hourly time series of the free surface elevation from the FVCOM tide+wind run and observed data at six sensor sites. To remove high frequency oscillations, a moving average of 60 min was applied to the observed data. The Norte event was placed near the middle of each plot to show the performance of the model before, during, and after the event. The first row in Figures 5 and 6 shows the CP sensors located at each inlet (CP-07 and CP-00); the second row shows the sensors TP-04 and TP-03, which are just south of Carmen Island, and the last row shows the TP sensors closest to the south coast of the TL. The TP-02 was a few meters from the
shoreline in a smooth sloping area, being the one with the highest recorded surface elevation (see Fig. 1).
3. Results and discussion
In this section we describe the results obtained from the realistic simulation of the flooding caused by an intense Norte that occurred in February 2010. This is followed by the results of the three experiments con-sidering sea level rise scenarios due to climate change, which include increases of 0.25 m, 0.50 m, and 0.75 m.
3.1 Impact of an intense Norte in the Términos La-goon
The numerical simulation reproduces the tidal signal and responds adequately to the effect of the
wind speed and direction on the free surface elevation during the Norte (Figs. 5-6). At the early stages of the arrival of the Norte to the exterior of the TL, the water piles up on the northwestern coast of Carmen Island. The water level outside the TL is reduced due to the flow of water inwards through the two inlet channels. This is particularly good for the CdC city because the potential water level that can flood the island is directed into the interior of the lagoon, reducing the flooding hazard.
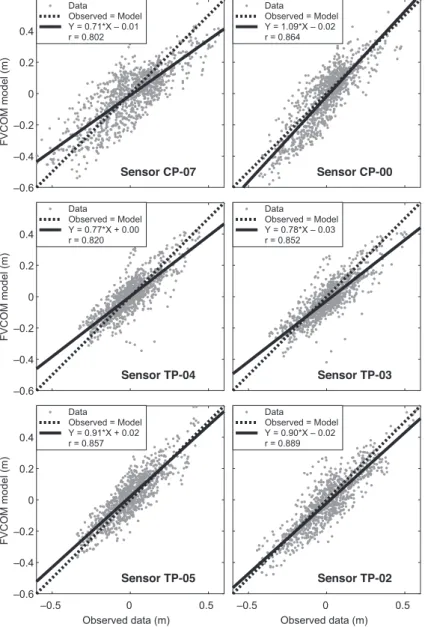
The amplitude of the free surface signal from the simulation and observations is almost the same at the inlets, but the model slightly underestimates the tidal range at the interior of the lagoon (Fig. 7). In addition to the time series plots, the linear regression between observed and modeled sea level was computed, as
-0.6 -0.4 -0.2 0 0.2 0.4 0.6 0.8
Sensor CP-07 Observed data
FVCOM Model Sensor CP-00
-0.6 -0.4 -0.2 0 0.2 0.4 0.6 0.8
Free surface elevation (m)
Sensor TP-04 Sensor TP-03
Feb/10 Feb/15 Feb/20 Feb/25 Mar/02 Mar/07
Date (2010) -0.6 -0.4 -0.2 0 0.2 0.4 0.6 0.8 Sensor TP-05
Feb/10 Feb/15 Feb/20 Feb/25 Mar/02 Mar/07
Date (2010) Sensor TP-02 Observed data FVCOM Model Observed data FVCOM Model Observed data FVCOM Model Observed data
FVCOM Model Observed data FVCOM Model
Fig. 5. Time series of free surface elevation (m) from observations (blue) and from the FVCOM tide+wind output (red) at different stations, from February 10 to March 10, 2010. See Figure 1 for the location of the sensors.
well as the dispersion diagrams. Correlations vary from r = 0.85 to r = 0.89 and the slopes from 0.71 to 1.09. The peak of the storm is well reproduced by the model but slightly overestimated at the inlets, probably due to the high bathymetry gradient at the inlets characterized by a deep and narrow navigation channel and a flat and shallow area at the remaining of the cross-section. Because of the geometry of the lagoon, a wide lagoon with relative narrow inlets, the energy dissipation results in a higher amplitude signal at the inlets than at the interior. In addition, the bottom friction of the shallow lagoon can also contribute to make that happen.
During the Norte, the relatively low amplitude in the water level caused by the shadow of Carmen Island at the location of the TP-04 and TP-03 sensors is slightly overestimated in the simulation. At the
TP-02 location, the model accurately reproduces the peak of the storm surge, which is remarkable as it is the closest point to the shoreline of all measurement sites before the water starts to inundate the land.
3.2 Inundation area during the Norte
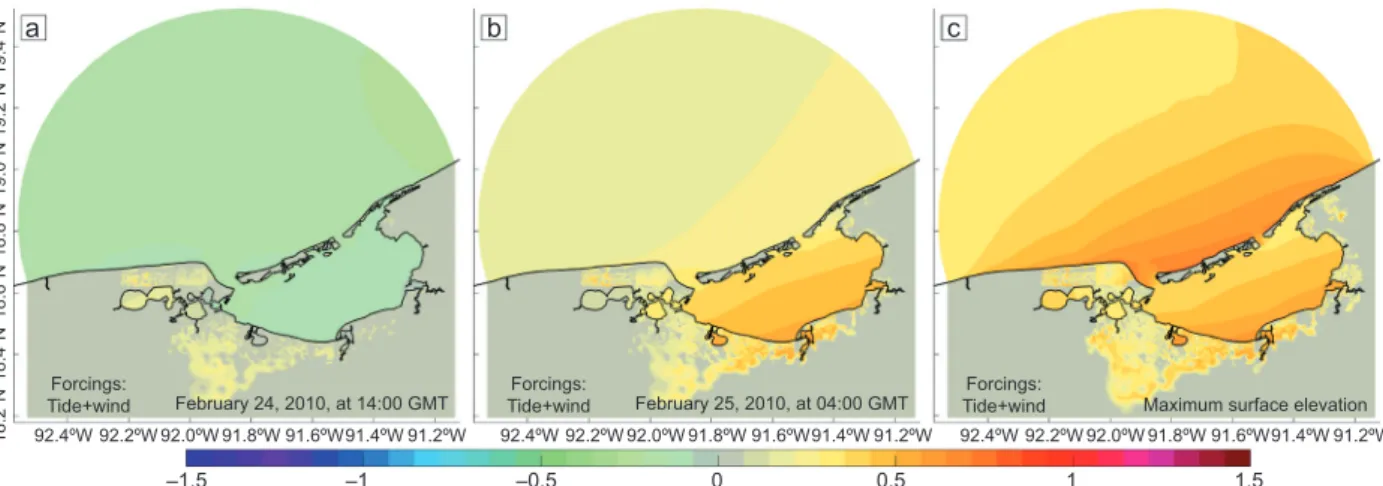
Using the outputs of the tide+wind simulation, con-tour maps of the free surface elevation were used to identify the flooding areas. Figure 8a represents the free surface elevation 14 hours before the peak of inundation and Figure 8b corresponds to the moment of maximum flooding area during the Norte, nine hours after the occurrence of the maximum wind speed simulated at Aguada Island. While Figure 8b is a snapshot in time when the greatest flood occurred, Figure 8c shows the maximum surface elevation at every node of the mesh during the analyzed period.
-0.6 -0.4 -0.2 0 0.2 0.4 0.6 0.8 Sensor CP-07 Sensor CP-00 -0.6 -0.4 -0.2 0 0.2 0.4 0.6 0.8
Free surface elevation (m)
Sensor TP-04 Sensor TP-03
Feb/21 Feb/23 Feb/25 Feb/27 Mar/01
Date (2010) -0.6 -0.4 -0.2 0 0.2 0.4 0.6 0.8 Sensor TP-05
Feb/21 Feb/23 Feb/25 Feb/27 Mar/01
Date (2010) Sensor TP-02
Observed data
FVCOM Model Observed data FVCOM Model
Observed data FVCOM Model Observed data
FVCOM Model
Observed data
FVCOM Model Observed data FVCOM Model
An extensive area southwest of the TL was already inundated with a relatively small water level before the event (Figure 8a), which matches with the wetland and mangrove areas documented in other studies (Rodríguez-Zúñiga et al., 2013). However, 14 hours later, the water level was significantly higher, and new inundated areas appeared mainly south and east of the lagoon. The increase in the flooded area in Figure 8c with respect to Figure 8b indicates that not every node reaches the maximum water level at the same
time. This last map represents the extension of the flooded area regardless of the time. It is interesting to notice the storm surge at the northern coast of Carmen Island and how it is reduced at the inlet channels, as was pointed out in the previous section.
3.3 Inundation area under sea level rise scenarios
Due to the low altitude of the area surrounding TL, there is concern about flooding under the SLR projections. Church et al. (2013) suggest that, if
–0.6 –0.4 –0.2 0 0.2 0.4 FVCOM model (m) Sensor CP-07 Data Observed = Model Y = 0.71*X – 0.01 r = 0.802 Sensor CP-00 Data Observed = Model Y = 1.09*X – 0.02 r = 0.864 –0.6 –0.4 –0.2 0 0.2 0.4 FVCOM model (m) Sensor TP-04 Data Observed = Model Y = 0.77*X + 0.00 r = 0.820 Sensor TP-03 Data Observed = Model Y = 0.78*X – 0.03 r = 0.852 –0.5 0 0.5 Observed data (m) –0.6 –0.4 –0.2 0 0.2 0.4 FVCOM model (m) Sensor TP-05 Data Observed = Model Y = 0.91*X + 0.02 r = 0.857 –0.5 0 0.5 Observed data (m) Sensor TP-02 Data Observed = Model Y = 0.90*X – 0.02 r = 0.889
Fig. 7. Scatter diagrams of water level from the FVCOM model vs. observations at different stations. Linear regression parameters and correlation are included. The black solid line is the least squares best-fit line, and the dashed line is the 1:1 line.
some measures are taken to reduce emissions of greenhouse gases, the most probable scenario for the end of the century is the RCP6.0 (RCP stands for Representative Concentration Pathway), and in the case of continuing the current level of emissions, the worst-case scenario would be RCP8.5, also known as “business as usual” (Fuss et al., 2014). Scenario RCP6.0 predicts an increase of the global mean sea level of 0.50 m, while the scenario RCP8.5 estimates a mean increase of 0.75 m (see Fig. 13.11a, from Church et al., 2013). Based on the SLR scenarios, three simulations were performed increasing the mean sea level at the boundary of the model domain. The runs have the same atmospheric forcing as the tide+wind runs but with increments in the boundary condition of 0.25, 0.50, and 0.75 m. The assumption of this experiment is to analyze what may happen in the future with an intense Norte like the one under study, acting at different SLR scenarios.
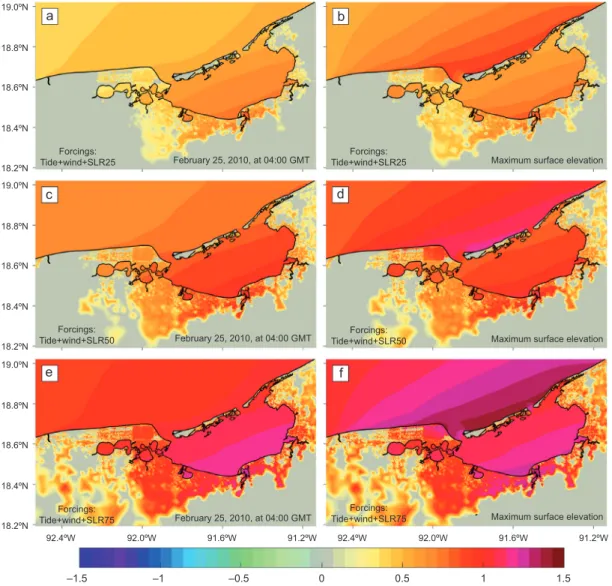
At the time of the maximum impact of the Norte, there are significant differences in the flooded areas and the water level between the simulations repre-senting the current mean sea level conditions (Fig. 8) and those of the SLR scenarios (Fig. 9). For each scenario, the peak of the flood is represented (Fig. 9a, c, e) along with the maximum surface elevation (Fig. 9b, d, f) during the analysis period, showing the differences between them in relation to the affected areas.
To have a better quantification of the differences between scenarios, the flooded area and the mean
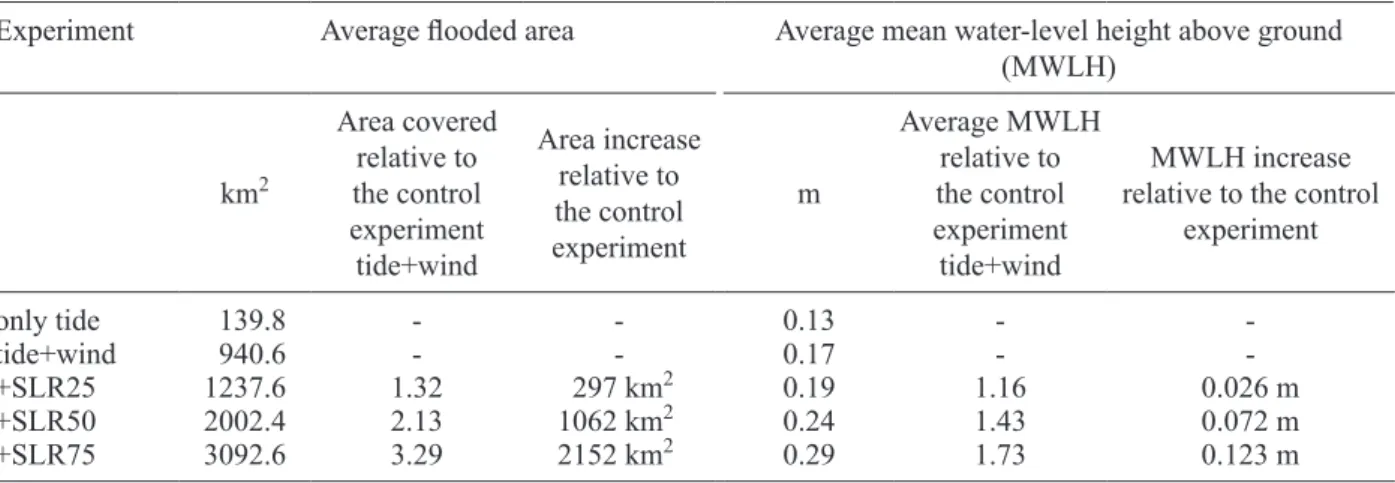
water-level height (MWLH) were calculated for each hour of all simulations. Results for the five cases, using the meteorological conditions from February 1 to April 1, 2010, were obtained (Fig 10). The flood-ed areas corresponding to +SLR25, +SLR50, and +SLR75 from the model simulations are shown in Figure 10a. The flood area was computed by selecting the wet cells and adding their corresponding area at each time step. For the MWLH (Fig. 10b), the water level height at each wet node over land at each time was considered and the mean was computed. The effect of the Norte appears on February 25, and it is clearly seen in Figure 10b. It is interesting to point out that when averaging the flooded areas and the MWLH with a linear increase in the SLR at regular intervals of 0.25 m, the difference respect to the tide+wind case is not linear (Table I). To clarify the non-linearity a specific study is necessary, but the causes may be that when the water column is larger the associated momentum is higher if the speed is similar. Also, regional topographic characteristics may influence this response.
The increase of the flooded area in SLR simu-lations relative to the area inundated considering the current conditions is extremely large, since the increases correspond to 1.3, 2.1 and 3.3 times for the three cases of SLR (0.25, 0.50, and 0.75 m), respectively (Table I). These increments represent areas of 297, 1062, and 2152 km², respectively, and for reference, the mangrove area surrounding the TL is around 2590 km2 (Robadue et al., 2004). The
19.4ºN 19.2ºN 19.0ºN 18.8ºN 18.6ºN 18.4ºN 18.2ºN 92.4ºW –1.5 –1 –0.5 0 0.5 1 1.5 a b c 92.2ºW 92.0ºW 91.8ºW 91.6ºW91.4ºW 91.2ºW 92.4ºW 92.2ºW 92.0ºW 91.8ºW 91.6ºW91.4ºW 91.2ºW 92.4ºW 92.2ºW 92.0ºW 91.8ºW 91.6ºW91.4ºW 91.2ºW Forcings:
Tide+wind February 24, 2010, at 14:00 GMT Tide+windForcings: February 25, 2010, at 04:00 GMT Tide+windForcings: Maximum surface elevation
Fig. 8. Maps of free surface elevation (m) from the outputs of the tide+wind simulation: (a) 14 hours before the peak of flooded area; (b) during the peak of flooded area, and (c) maximum surface elevation during the entire analyzed period.
19.0ºN a c e f d b 18.8ºN 18.6ºN 18.4ºN 18.2ºN 19.0ºN 18.8ºN 18.6ºN 18.4ºN 18.2ºN 19.0ºN 18.8ºN 18.6ºN 18.4ºN 18.2ºN 92.4ºW 92.0ºW –1.5 –1 –0.5 0 0.5 1 1.5 91.6ºW 91.2ºW 92.4ºW 92.0ºW 91.6ºW 91.2ºW Forcings:
Tide+wind+SLR25 February 25, 2010, at 04:00 GMT Tide+wind+SLR25Forcings: Maximum surface elevation
Forcings:
Tide+wind+SLR50 Maximum surface elevation
Forcings:
Tide+wind+SLR75 Maximum surface elevation Forcings:
Tide+wind+SLR50 February 25, 2010, at 04:00 GMT
Forcings:
Tide+wind+SLR75 February 25, 2010, at 04:00 GMT
Fig. 9. Maps of free surface elevation (m) from the tide+wind simulations increasing the mean sea level by (a, b) 0.25 m, (c, d) 0.50 m, and (e, f) 0.75 m. Left column shows snapshots during the peak of the inundation. Right column shows the maximum surface elevation during the analyzed period.
nonlinear response is expected to be a particular char-acteristic of each region since it depends on factors like the topography, the run up, and the land cover. The increase in water level height has a lower pro-portion, which shows that inundation is not a linear function of sea level change in some cases.
The flooded area on February 25, 2010 at 04:00 GMT was plotted in an incremental manner for the different experiments (Fig. 11). The +SLR75 case shows the largest flooded area, followed by the +SLR50 case, the +SLR25 case, the tide+wind case, and the only-tide run with the smallest area.
The basic case is the only-tide simulation (yellow in Fig. 11), which shows some areas that would nor-mally be inundated during spring tides. The control experiment is the tide+wind, which corresponds to the flooded area during the Norte in February 2010. The other cases indicate scenarios of how much the flooded area may increase with a specific SLR.
The flooded regions for Carmen Island, where most of the population lives in the western part, are also shown in detail (Fig. 11b). The east and southeast parts are mainly wetlands with mangrove. Future sce-narios present an increase in the hazard of flooding in
a +SLR75 +SLR50 +SLR25 tide+wind only tide
Feb/01 Feb/11 Feb/21 Mar/03 Mar/13 Mar/23
Date (2010) 0 500 1000 1500 2000 2500 3000 3500 4000 Flooding area (km 2)
Feb/01 Feb/11 Feb/21 Mar/03 Mar/13 Mar/23
Date (2010) 0.1 0.15 0.2 0.25 0.3 0.35
Mean water-level height (m)
b
Fig. 10. Time series of (a) the flooded area (km2) and (b) the mean water-level height above ground (m) for each of the simulations.
Table I. Average flooded area and MWLH during the analyzed period relative to the control experiment (tide+wind). All cases were forced with the prevailing meteorological conditions during February-March, 2010.
Experiment Average flooded area Average mean water-level height above ground
(MWLH) km2 Area covered relative to the control experiment tide+wind Area increase relative to the control experiment m Average MWLH relative to the control experiment tide+wind MWLH increase relative to the control
experiment only tide 139.8 - - 0.13 - -tide+wind 940.6 - - 0.17 - -+SLR25 1237.6 1.32 297 km2 0.19 1.16 0.026 m +SLR50 2002.4 2.13 1062 km2 0.24 1.43 0.072 m +SLR75 3092.6 3.29 2152 km2 0.29 1.73 0.123 m
the central part of the island, which is almost divided in this part. Coastal protection structures for flooding control may need to be considered in the future.
The different SLR scenarios show that more areas will become flooded during Norte events due to storm surge, as it is evident from figure 10a. But new areas
will also be flooded during high tides since there will be an increase in the mean sea level, as observed in the scenarios prior to the arrival of the Norte (Fig. 10). Larger oscillations of water-level height that occur under the SLR scenarios over land (Fig. 10b) are due to the greater inertia that a higher water column has.
This change will give a better hydrological exchange, which may improve the conditions to facilitate the es-tablishment, survival, and growth of mangrove. It also can help the recovery of the forest structure and the productivity of underground roots if there are recovery programs that consider the changing conditions.
4. Conclusion
The water level and environmental conditions during an intense Norte event occurred in February 2010 were analyzed based on tide gauge and weather station data and by numerical simulations using a calibrated hydrodynamic model.
The FVCOM model turned out to be a suitable tool to study changes in storm surge impacts due to sea level rise because of its adequate representation of water level variations during the event. The model simulated wet and dry cells, tidal propagation, and the response to atmospheric forcing. WRF wind was used for the surface momentum forcing. The simu-lations performed for this study covered the period
Fig. 11. (a) Maximum flooding areas during the Norte event for different SLR scenarios. (b) Zoom of the Carmen Island. Colors represent cells with water height greater than zero for each simulation.
19.0ºN 18.9ºN 18.8ºN 18.7ºN 18.6ºN 18.5ºN 18.4ºN 18.3ºN 18.2ºN 18.80ºN 18.78ºN 18.76ºN 18.74ºN 18.72ºN 18.70ºN 18.68ºN 18.66ºN 18.64ºN 18.62ºN 18.60ºN 92.4ºW +SLR75 +SLR50 +SLR25 tide+wind only wind 91.85ºW 91.80ºW 91.75ºW 91.70ºW 91.76ºW 91.60ºW 91.56ºW 91.50ºW 92.2ºW 92.0ºW February 25, 2010, at 04:00 GMT a b 91.8ºW 91.6ºW 91.4ºW 91.2ºW
from January to March 2010, they were calibrated performing several test runs with different bottom roughness, and validated with several observed water level datasets that have a wide coverage in space and time in the TL.
Results from the case study showed that an intense Norte could generate a significant storm surge in the TL area flooding large zones, includ-ing Carmen Island where the CdC city is located. Changes in flood areas and water level due to storm surges were studied under different sea level rise scenarios expected by the end of this century. The results indicate that the flood area may grow in large proportion around the TL, even in a conservative scenario such as RCP6.0. Flood areas south of the TL, currently covered by mangroves, will increase as well as the water level associated with the storm surge, leaving some regions below water for long or permanent periods. Carmen Island will suffer from higher-level floods, particularly in its central zone and the southern coast.
Some regions that are currently occupied by wetlands may be permanently inundated, while some areas that are currently dry will be flooded frequently. Considering the effect of Nortes, the flooding frequency in Carmen Island will increase if sea level continues to rise as expected, even if the annual number and intensity of Nortes remain as today. Results from this study are important for the coastal development planning and may be considered by policymakers.
Acknowledgments
ODG would like to thank the National Council of Science and Technology (CONACYT) from Mex-ico for the Ph.D. scholarship grant. CCA-UNAM and DGTIC-UNAM for computing resources. Bi-national programs JEST (Joint Environmental Study of Términos Lagoon) and ECOS-NORD (Evaluation-orientation de la COopération Scien-tifique) between France and Mexico. This research has been funded by the Mexican National Council for Science and Technology-Mexican Ministry of Energy-Hydrocarbon Fund, project 201441. This is a contribution of the Gulf of Mexico Research Consortium (CIGoM). We acknowledge the specific request of PEMEX to the Hydrocarbon Fund to
address the environmental effects of oil spills in the Gulf of Mexico. We would like to thank to Rosario Romero-Centeno for her valuable comments and suggestions to a previous version of the manuscript.
References
Appendini CM, Torres-Freyermuth A, Salles P, López-González J, Mendoza ET. 2014. Wave climate and trends for the Gulf of Mexico: A 30-yr wave hindcast.
Journal of Climate 27:1619-1632.
DOI: 10.1175/JCLI-D-13-00206.1
Appendini CM, Hernández-Lasheras J, Meza-Padilla R, Kurczyn, JA. 2018. Effect of climate change on wind waves generated by anticyclonic cold front intrusions in the Gulf of Mexico. Climate Dynamics 51:3747-3763. DOI: 10.1007/s00382-018-4108-4
Beardsley RC, Chen C, Xu Q. 2013. Coastal flooding in Scituate (MA): A FVCOM study of the 27 December 2010 nor’easter. Journal of Geophysical Research:
Oceans 118:6030-6045. DOI: 10.1002/2013JC008862.
Chen C, Liu H, Beardsley RC. 2003. An unstructured, finite-volume, three-dimensional, primitive equation ocean model: Application to coastal ocean and estuaries.
Journal of Atmospheric and Oceanic Technology
20:159-186. DOI: 10.1175/1520-0426(2003)020<0159:AUG-FVT>2.0.CO;2
Chen C, Cowles G, Beardsley RC. 2006. An unstructured grid, finite volume coastal ocean model: FVCOM user manual. 2nd ed. School for Marine Science and Technology, University of Massachusetts, Dartmouth, New Bedford, MA, 315 pp.
Chen C, Xu Q, Houghton R, Beardsley RC. 2008a. A mod-el-dye comparison experiment in the tidal mixing front zone on the southern flank of Georges Bank. Journal
of Geophysical Research 113, C02005.
DOI: 10.1029/2007jc004106
Chen C, Qi J, Li C, Beardsley RC, Lin H, Walker R, Gates K. 2008b. Complexity of the flooding/drying process in an estuarine tidal-creek salt-marsh system: An application of FVCOM. Journal of Geophysical
Research 113, C07052. DOI: 10.1029/2007jc004328
Chen C, Gao G, Qi J, Proshutinsky A, Beardsley RC, Kowalik Z, Lin H, Cowles GW. 2009. A new high-res-olution unstructured-grid finite-volume Arctic Ocean model (AO-FVCOM): an application for tidal studies.
Journal of Geophysical Research 114, C08017.
DOI: 10.1029/2008jc004941
Chen C, Beardsley RC, Luettich RA Jr., Westerink JJ, Wang H, Perrie W, Xu Q, Donahue AS, Qi J, Lin H, Zhao L, Kerr PC, Meng Y, Toulany B. 2013. Extratrop-ical storm inundation testbed: Intermodel comparisons in Scituate, Massachusetts. Journal of Geophysical
Research: Oceans 118:1-20.
DOI: 10.1002/jgrc.20397
Chim L, Sánchez M, Morales AT, Lastra J, Bañuelos C, Valadez A, Gutiérrez U. 2010. Oleaje, inundaciones y cierre de puertos en el Golfo por frente frío 33.
La Jornada, Thursday, February 25, p. 31. Available
at: http://www.jornada.unam.mx/2010/02/25/es-tados/031n1est (accessed July 20, 2019).
Church JA, Clark PU, Cazenave A, Gregory JM, Jevre-jeva S, Levermann A, Merrifield MA, Milne GA, Nerem RS, Nunn PD, Payne AJ, Pfeffer WT, Stam-mer D, Unnikrishnan AS. 2013. Sea Level Change. In: Climate Change 2013: The Physical Science
Basis. Contribution of Working Group I to the Fifth
Assessment Report of the Intergovernmental Panel on Climate Change (Stocker TF, Qin D, Plattner GK, Tignor M, Allen SK, Boschung J, Nauels A, Xia Y, Bex V, Midgley PM, Eds.). Cambridge University Press, Cambridge, United Kingdom and New York, NY, USA, pp. 1137-1216.
DOI: 10.1017/ CBO9781107415324.026
Contreras Ruiz-Esparza A, Douillet P, Zavala-Hidalgo J. 2014. Tidal dynamics of the Términos Lagoon, Mexi-co: Observations and 3D numerical modelling. Ocean
Dynamics 64:1349.
DOI: 10.1007/s10236-014-0752-3
Contreras Ruiz-Esparza A, 2017. Respuesta y vulnerabili-dad ante eventos atmosféricos de la Laguna de Térmi-nos. Ph.D. Thesis, Universidad Nacional Autónoma de México. Available at: http://oreon.dgbiblio.unam.mx/F/ L58CC5RL51U9V9EH1636FFT4Y5B8M2GBDS-G28CAY73XJ2T3B9P-11441?func=full-set-set&set_ number=015482&set_entry=000001&format=999 (accessed July 20, 2019).
David LT, Kjerfve B. 1998. Tides and currents in a two-in-let coastal lagoon: Laguna de Términos, Mexico.
Continental Shelf Research 18(10):1057-1079.
DOI: 10.1016/S0278-4343(98)00033-8
Egbert GD, Erofeeva SY. 2002. Efficient Inverse Modeling of Barotropic Ocean Tides. Journal of Atmospheric and
Oceanic Technology 19:183-204.
DOI: 10.1175/1520-0426(2002)019<0183:EI-MOBO>2.0.CO;2
Engwirda D. 2014. Locally optimal Delaunay-refine-ment and optimization-based mesh generation. Ph.D. Thesis. School of Mathematics and Statistics, The University of Sydney. Available at http://hdl.handle. net/2123/13148 (accessed July 20, 2019).
Fuss S, Canadell JG, Peters GP, Tavoni M, Andrew RM, Ciais P, Jackson RB, Jones CD, Kraxner F, Naki-cenovic N, Quéré CL, Raupach MR, Sharifi A, Smith P, Yamagata Y. 2014. Betting on negative emissions.
Nature Climate Change 4:850-853.
DOI: 10.1038/nclimate2392
García-Cuéllar J, Arreguín-Sánchez F, Hernández-Vázquez S, Lluch-Cota D. 2004. Impacto ecológico de la indu-stria petrolera en la sonda de Campeche, México, tras tres décadas de actividad: una revisión. Interciencia 29(6):311-319.
Henry WK. 1979. Some aspects of the fate of cold fronts in the Gulf of Mexico. Monthly Weather Review 107:1078-1082.
DOI: 10.1175/1520-0493(1979)107<1078:SAOT-FO>2.0.CO;2
INEGI. 2012. Modelos digitales de elevación de alta resolución LiDAR. Instituto Nacional de Estadística y Geografía, Mexico. Available at:
https://www.inegi.org.mx/contenidos/temas/mapas/re-lieve/continental/metadatos/lidar_alta_resolucion.pdf (accessed July 20, 2019)
INEGI. 2016. Censos Económicos 2014. Campeche. Instituto Nacional de Estadística y Geografía, Mexico. Available at: http://internet.contenidos.inegi.org.mx/contenidos/ Productos/prod_serv/contenidos/espanol/bvinegi/ productos/nueva_estruc/CE_2014/702825082628.pdf (accessed July 20, 2019)
Khalil GM. 1992. Cyclones and storm surges in Bangla-desh: Some mitigative measures. Natural Hazards 6:11. DOI: 10.1007/BF00162096
Kjerfve B, Magill KE. 1989. Geographic and hydrodynam-ic characteristhydrodynam-ics of shallow coastal lagoons. Marine
geology 88(3-4):187-199.
DOI: 10.1016/0025-3227(89)90097-2
Kuc AG, Posada G, Vega BE. 2015. Evaluación hidrodinámi-ca en la Laguna de Términos. In: Aspectos socioambien-tales de la región de la laguna de Términos, Campeche (Ramos Miranda J, Villalobos Zapata GJ, Eds.). Univer-sidad Autónoma de Campeche, pp. 145-166.
Langella G. 2010. Inverse distance weighted (IDW) or simple moving average (SMA) interpolation. In: MathWorks File exchange. Available at: https://www.
mathworks.com/matlabcentral/fileexchange/27562-in- verse-distance-weighted--idw--or-simple-moving-av-erage--sma--interpolation/content/gIDW.m (accessed July 20, 2019)
McInees KL, Hubbert GD. 2003. A numerical modelling study of storm surges in Bass Strait. Australian
Mete-orological Magazine 52:143-156.
Mitsch WJ, Hernández ME. 2013. Landscape and climate change threats to wetlands of North and Central Amer-ica. Aquatic Sciences 75:133-149.
DOI: 10.1007/s00027-012-0262-7
Murty TS, Flather RA, Henry RF. 1986. The storm surge problem in the Bay of Bengal. Progress in
Oceanog-raphy 16(4):195-233.
DOI: 10.1016/0079-6611(86)90039-X
NCAR. 2009. Weather Research and Forecasting ARW: Modelling systems user’s guide (version 3.0). Meso-scale and MicroMeso-scale Meteorology Division, National Center for Atmospheric Research, Boulder, Colorado, 280 pp.
Ojeda E, Appendini CM, Mendoza ET. 2017. Storm-wave trends in Mexican waters of the Gulf of Mexico and Caribbean Sea. Natural Hazards and Earth System
Sciences 17:1305-1317.
DOI: 10.5194/nhess-17-1305-2017
Reding PJ. 1992. The Central American cold surge: An observational analysis of the deep southward pene-tration of North American cold fronts. M.Sc. Thesis. Department of Meteorology, Texas A&M University, USA, 177 pp.
Rego JL, Li CY. 2010. Storm surge propagation in Galves-ton Bay during Hurricane Ike. Journal of Marine
Sys-tems 82:265-279. DOI: 10.1016/j.jmarsys.2010.06.001
Rey W, Salles P, Mendoza ET, Torres-Freyermuth A, Ap-pendini CM. 2018. Assessment of coastal flooding and associated hydrodynamic processes on the south-east-ern coast of Mexico, during Central American cold surge events. Natural Hazards and Earth System
Sciences 18:1681-1701.
DOI: 10.5194/nhess-18-1681-2018
Robadue D, Calderón R, Oczkowski A, Bach L, Cepeda MF. 2004. Characterization of the region of the Laguna de Términos Campeche. The Nature Conservancy/ University of Rhode Island, 52 pp.
Rodríguez-Zúñiga T, Troche-Souza C, Vázquez-Lule AD, Márquez-Mendoza J, Vázquez-Balderas B, Valder-rama-Landeros L, Velázquez-Salazar S, Cruz-López MI, Ressl R, Uribe-Martínez A, Cerdeira-Estrada S,
Acosta-Velázquez J, Díaz C. 2013. Manglares de México, extensión, distribución y monitoreo. Comisión Nacional para el Conocimiento y Uso de la Biodiver-sidad, Mexico, 128 pp.
Saha S, Moorthi S, Pan H, Wu X, Wang J, Nadiga S, Tripp P, Kistler R, Woollen J, Behringer D, Liu H, Stokes D, Grumbine R, Gayno G, Wang J, Hou Y, Chuang H, Juang HH, Sela J, Iredell M, Treadon R, Kleist D, Van Delst P, Keyser D, Derber J, Ek M, Meng J, Wei H, Yang R, Lord S, van den Dool H, Kumar A, Wang W, Long C, Chelliah M, Xue Y, Huang B, Schemm J, Ebisuzaki W, Lin R, Xie P, Chen M, Zhou S, Higgins W, Zou C, Liu Q, Chen Y, Han Y, Cucurull L, Reyn-olds RW, Rutledge G, Goldberg, M. 2010. The NCEP Climate Forecast System Reanalysis. Bulletin of the
American Meteorological Society 91:1015-1058.
DOI: 10.1175/2010BAMS3001.1
Skamarock WC, Klemp JB, Dudhia J, Gill DO, Barker DM, Duda MG, Huang X, Wang W, Powers JG. 2008. A description of the Advanced Research WRF version 3.0. NCAR Technical Note NCAR/TN-475+STR. Mesoscale and Microscale Meteorology Division, National Center for Atmospheric Research, 113 pp. Weisberg RH, Zheng LY. 2006. Hurricane storm surge
simulations for Tampa Bay. Estuaries and Coasts 29:899-913.
DOI: 10.1007/BF02798649
Weisberg RH, Zheng LY. 2008. Hurricane storm surge sim-ulations comparing three-dimensional with two-dimen-sional formulations based on an Ivan-like storm over the Tampa Bay, Florida region. Journal of Geophysical
Research 113, C12001. DOI: 10.1029/2008JC005115.
Weisberg RH, Barth A, Alvera-Azcárate A, Zheng LY. 2009. A coordinated coastal ocean observing and modeling system for the west Florida continental shelf. Harmful
Algae 8:585-597. DOI: 10.1016/j.hal.2008.11.003
Yang ZQ, Khangaonkar T. 2008. Modeling of salt intru-sion, intertidal mixing, and circulation in a Braided estuary. Journal of Coastal Research 52:171-179. DOI: 10.2112/1551-5036-52.sp1.171
Zavala-Hidalgo J, de Buen-Kalman R, Romero-Centeno R, Hernández-Maguey F. 2011. Tendencias del nivel del mar en las costas mexicanas. In: Vulnerabilidad de las zonas costeras mexicanas ante el cambio climático (Botello AV, Villanueva-Fragoso S, Gutiérrez J, Rojas Galaviz JL, Eds.). 2a ed. Universidad Autónoma Met-ropolitana-Iztapalapa, UNAM-ICMYL, Universidad Autónoma de Campeche, pp. 315-334.
Zheng L, Weisberg RH, Huang Y, Luettich RA, Westerink JJ, Kerr PC, Donahue AS, Crane G, Akli L. 2013. Implications from the comparisons between two- and three-dimensional model simulations of the Hurricane Ike storm surge. Journal of Geophysical Research Oceans 118:350-3369. DOI: 10.1002/jgrc.20248