HAL Id: hal-01865076
https://hal.archives-ouvertes.fr/hal-01865076v2
Submitted on 17 Sep 2018HAL is a multi-disciplinary open access
archive for the deposit and dissemination of sci-entific research documents, whether they are pub-lished or not. The documents may come from teaching and research institutions in France or abroad, or from public or private research centers.
L’archive ouverte pluridisciplinaire HAL, est destinée au dépôt et à la diffusion de documents scientifiques de niveau recherche, publiés ou non, émanant des établissements d’enseignement et de recherche français ou étrangers, des laboratoires publics ou privés.
Low-Power Wake-Up System based on Frequency
Analysis for Environmental Internet of Things
Manon Fourniol, Valentin Gies, Valentin Barchasz, Edith Kussener, Herve
Barthelemy, Remy Vauche, Hervé Glotin
To cite this version:
Manon Fourniol, Valentin Gies, Valentin Barchasz, Edith Kussener, Herve Barthelemy, et al.. Low-Power Wake-Up System based on Frequency Analysis for Environmental Internet of Things. 14th IEEE/ASME International Conference on Mechatronic and Embedded Systems and Applications (MESA 2018), Jul 2018, Oulu, Finland. �10.1109/MESA.2018.8449164�. �hal-01865076v2�
Low-Power Wake-Up System based on
Frequency Analysis for Environmental Internet
of Things
Manon Fourniol1, Valentin Gies1, Valentin Barchasz3, Edith Kussener1, Herv´e Barthelemy1, Remy Vauch´e1 and Herv´e Glotin2
1Aix Marseille Universit´e, Universit´e de Toulon, ISEN, CNRS, IM2NP - UMR 7334,
13397 Marseille, France
2Aix Marseille Universit´e, Universit´e de Toulon, CNRS, LIS - UMR 7020,
83000 Toulon, France
3Universit´e de Toulon, SMIoT, 83000 Toulon, France
September 2018
Abstract
Being used in for environmental and military Internet of Things (IoT), a low power wake-up system based on frequency analysis is presented in this paper. It aims at detecting continuously the presence of specific very high frequencies in the input acoustic signal of an embedded system. This can be used for detecting specific animal species, and for triggering a recording system or generating alerts. Used for harmful species detection, this helps to save harvests or to protect strict nature reserves. It can also be used for detecting the presence of drones in a specific restricted area. This acoustic low power wake-up system uses a simple 16 bits micro-controller (MCU), with a strong emphasis on the low power management of the system, having a target of continuous detection for at least one year on a single standard 1.2Ah - 12V lead battery. For that, it makes the most of mixed analog and digital low power MCU modules. They are including comparators, timers and a special one present on Microchip MCU, called Charge Time Measurement Unit (CTMU). This is a driven constant current source for making time to frequency conversions at a very low power and algorithmic cost.
Optimizing low power modes, this low power wake-up system based on frequency analysis has a power consumption of 0.56mW , leading to approximately 3 years of battery life on a single standard 1.2Ah - 12V lead cell.
1
Introduction
Environmental and military surveys can last several months without any human intervention, due to operational or environmental constraints such as installation of a device in a strict nature reserve or in a restricted access area which requires unmanned operations for long periods. This is hardly compatible with autonomous high frequency environmental recording systems, because power consumption is too important. For example, acoustic recording of animals such as bats or rats, having a communication and localization system emitting up to 120kHz [1] and aerial drones producing a characteristic noise around 40kHz [2], requires to have a data acquisition system working at a minimum of 240ksps with a resolution of 24 bits for detecting low level signal. This leads to store 2.5GB of data every hour. In order to add 3-dimensional source localization feature to these applications, 4 or 5 microphones are necessary, creating a huge quantity of 10GB of data every hour.
In these conditions, it is almost impossible to have a portable autonomous long term data acqui-sition system able to record continuously. Fortunately, continuous recording is mostly not necessary, but can be reduced to periods with interesting data.
In this paper we propose a solution that can be used in a common class of environmental issues : recording or analyzing acoustic signals emitted by animals or drones, by pre-filtering instants when they are present or suspected to be there. As an example, we coped with this issue for protecting a strict nature reserve island (Ilot Bagaud, part of the Parc National de Port Cros in France) from rats intrusions with the Qualilife system [3] integrating the low power acoustic wake-up system shown in Fig. 1.
Figure 1: Low Power Acoustic Wake-Up System integrated in ”Qualilife” recording system Rats intrusions have to be detected, recorded and also analyzed in order to send an alert message to the biologists monitoring the island or to local environmental authorities in real time [4]. Furthermore, the detection system has to work autonomously for at least 12 months because the area is strictly protected. In the case of aerial drone detection in a restricted military area, the wake-up system can be used for generating alerts in order to prevent malicious behaviors.
In these cases, continuous recording is not possible on a long term, due to the important power consumption of the high frequency 2 channels recording system : 500mW for signal capture and storage. We have to cope with an issue described in [5], [6], [7] and [8]. Our recording system is working on a standard 12V − 1.2Ah lead battery having a global capacity of 14.4W h. In continuous recording, batteries would last only 30 hours, without including the energy necessary for processing signals and generating alerts. Considering that rats invasions are rare, we can assume that the maximum acceptable average power consumption is equal to the battery capacity divided by the needed autonomy of the system (i.e. 12 months). This leads to allow a power consumption of 1.6mW in continuous mode. Considering that each of our two microphones (necessary for 2D source localization) power supply draws 0.4mW , the available average power remaining for rats detection is 0.8mW . It is the same for aerial drones detection systems, considering intrusions are rare. The only difference is post-processing : alarms are much more likely to be generated than acoustic recordings thus leading to activate advanced signal post-processing.
In order to store efficiently the high frequency acoustic signals occurring sparsely at a random time, we need to trigger the records at the moments where an interesting signal is present. This allows
to avoid useless power consumption, useless data storage saturation, and useless post-processing work to rise alarms or to find out interesting events. Following the emerging idea of using edge computing techniques, this pre-filtering process allows to detect only the interesting events, and thus consuming less, saving a huge amount of data storage and making the device record for a long time.
Some low power wake-up systems based on raw frequency detection exist, like [9] but they are mainly specified on detecting a specific frequency and are specialized in radio frequency analysis in for example RFID technologies [10]. There are also some detectors using advanced digital processing techniques and having more developed capabilities such as pattern detection, like [11] or [12], but with a limited sampling frequency and at a higher overall power cost due to analog to digital conversions.
2
Acoustic Environmental Monitoring System Description
This paper focuses on the low power wake-up system based on frequency analysis, however a global description of the recording and analysis system is presented in Fig. 1. It explains how the acoustic low power wake-up system based on frequency analysis is connected with other parts of the high frequency recording system using a low power device. Then, the architecture and implementation of the wake-up system is presented and described precisely.
The global description of our acoustic recorder is shown in Fig. 2. Processing is done in three steps, each one having an increasing power cost :
• Signal from the microphone is first processed by the low power wake-up system which will wake up a supervisor with an interruption when the desired frequency is detected. This operation is performed in a continuous way at a very low energy cost of 13µW when there is no significant input signal, and is not exceeding 0.56mW in the most hard processing case (excluding micro-phone power supply) on a few peripherals of a micro-controller (MCU). This low power acoustic wake-up system is the main topic of this paper.
• Then the supervisor can activate advanced signal processing based on traditional linear or non-linear filters, neural network, wavelets transforms and so on [13], [14], [15], [16] and [17]. They are used to precisely characterize the detected signal and to validate its interest. These operations are performed on demand with the same MCU as before, with a more important power consumption of about 17.5mW at 16M IP S. The supervisor stage is also able to launch an alarm. It is interesting to notice that, depending on the signal interest, our low power wake-up system based on frequency analysis could be sufficient, as the high frequency (from 40 kHz to 200 kHz) will be rare in our environment which are far away from the human activities. This filtering stage is not the topic of this paper.
• Then, if the signal is analyzed as interesting, a high frequency and high quality recorder is started for a defined amount of time, in order to record the next occurrences of the interesting signal. It is important to notice that this way of proceeding cannot be used for recording one shot signals because signal used for low power acoustic wake-up is lost. A solution using an analogical to digital signal buffer converter could be implemented but would not be low power.
3
Low-Power Wake-Up System based on Frequency Analysis
This paper focuses on the low power wake-up system. Its architecture is simple as simplicity is a virtue for achieving a very low power detection working continuously on raw acoustic high frequency data. To limit power consumption, we have decided to implement it using an extra low power 16 bits MCU from Microchip [18], having interesting low power mixed digital-analog peripherals.
Figure 2: Global Project Description.
Implementation makes the most of peripherals autonomously used in order to reduce power con-sumption. Modules used are analog comparators, timers and a specific Microchip module : the Charge Time Measurement Unit (CTMU) [19] [20]. This is a very flexible mixed digital-analog module working as a configurable and externally triggerable current source that can be used to generate asynchronously controlled charges or discharges of capacitors.
3.1 Architecture Description
The proposed acoustic wake-up system based on frequency analysis is described in Fig. 3.
The processing system is precisely explained with chronograms in Fig. 4. First, acoustic signal US
incoming from a low power microphone (0.5mW ) enters the MCU by an analog comparator having an adjustable comparison level.
Output of the comparator is the signal UInCp entering a high frequency monostable timer. This
monostable timer generates a pulse of fixed length Tmon each rising edge of the signal UInCp, as shown
on signal Um. At this step the moving average value of Um is almost proportional to the incoming
frequency. However, filtering would introduce a delay and a loss of information we want to avoid. Logical output Um of the monostable timer enters the CTMU module and activates the charge of
a capacitor with a fixed current I0 as long as the monostable is high. Hence, the capacitor voltage is
growing linearly during these phases as shown on signal UC in Fig.4. For a fixed amount of time, the
higher the input frequency, the higher the capacitor voltage is. The Fig. 4 shows UC, the charge of
the capacitor, becoming higher or smaller according to the US frequency.
We introduce the following equation : UC = Z t 0 IC(t) C dt = Z t 0 I0 CUm(t)dt = I0 C ∗ N ∗ Tm (1) = I0 C ∗ FS FT rCp ∗ Tm (2)
where Um is a logical level 1 or 0 depending on the monostable output state, N the number of
pulses between two successive resets, FT rCp the comparator trigger frequency, and FS is the input
Figure 3: System Architecture.
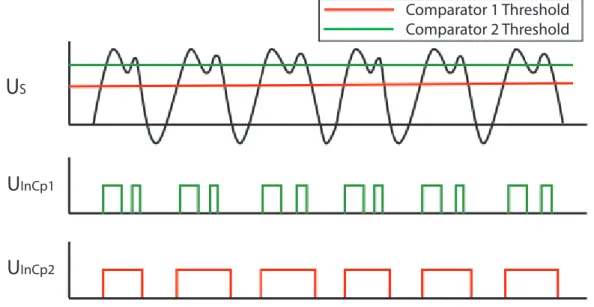
Simultaneously, a signal UT rCp is generated from a low frequency pulse generator, independently
from US and at a fixed frequency FT rCp It is used to periodically trigger analog voltage
compar-isons between the capacitor voltage and numerically defined fixed thresholds as described in fig. 5. These comparisons allow to know if the incoming signal frequency is lower or higher than reference frequencies, because analog output voltage UC value is proportional to FS as shown in equation 2.
Finally, capacitor is discharged (as shown in Fig.5) by UReset(Fig.4) just after analog comparisons.
This is done by switching numerically an internal NMOS to discharge the external capacitor of the CTMU module. UResetis generated as a delayed signal from UT rCpnumerically on the interrupt raised
by the lower frequency timer.
As a final result, outputs of comparators 1 and 2 (respectively UOutCp1 and UOutCp2 on Fig.5)
give an accurate information on whether the input frequency is in a specific frequency band or not. This allows to activate further processes using more energy if incoming frequency matches the desired frequency, depending of the application, in order to confirm whether the input signal is interesting or not.
3.2 Implementation
In this section, the role and tuning of each part of the low power frequency wake up system is explained in details.
Figure 4: Processing System Description.
Figure 5: Comparator Selection.
As previously said, the purpose of our system is to be a low-power frequency wake up system, in order to keep the global recording system installation working for several months or years. To this end, we first chose a low-power MCU device, such as the PIC24FJ256GB410 from Microchip for his Extreme Low Power (XLP) processor. Indeed, this device power consumption is only 170µA per 1M Hz, is reduced to 4µA in Sleep Mode.
3.2.1 Input Comparator
A comparator is used to compare the input signal to a reference value. In our case, we use it to convert the signal from the microphone which can be very small to an exploitable digital input. The comparator voltage reference is a 16-tap, resistor ladder network that provides a software selectable reference voltage. Without using it, the input of the timer generating monostable signal would not trigger on each period of the input signal. Avoiding this is the role of the input comparator. However, there can be some side effects in case comparator level is not adjusted correctly, because comparator is a single one and not a Schmitt trigger with adjustable low and high thresholds.
Fig. 6 shows two possible tunings of the trigger level. The first one leads to a good frequency measurement, whereas the second one leads to have two rising edges on the output for each signal period, leading to a wrong frequency measurement at the end. This can be avoided by a software algorithm comparing successive instant of comparator output rising edges. When there is a wrong measurement, time interval between two rising edges is variable (first comparison in Fig. 6). Whereas time interval between two rising edges is constant in case of no multi-detection (second comparison in Fig. 6).
Figure 6: Signal Selection by the First Comparator
3.2.2 High frequency monostable timer
The monostable is triggered by UInCprising edges. Monostable duration Tmmust be adjusted carefully.
Longer than input signal period Ts, it leads to have rising edges arriving on the input whereas the
output is still active as shown in Fig. 7. This rising edges will not be taken into account, thus leading to a wrong frequency evaluation.
A too small Tm requires to have a higher frequency internal clock leading to a higher power
consumption.
Finally, if the signal frequency is limited to 100kHz, choosing a monostable period of 2µs leads to an accurate estimate of the frequency up to 500kHz. This allows to cut the input signal having a frequency higher than 100kHz with a simple RC low pass filter, with an attenuation of about −14dB at 500kHz. This attenuation is sufficient for removing unwanted highest frequency signal components, like in anti-aliasing filters, without having a complex or power consuming analog active filter in input. Finally, this leads to have a system clock at 0.5M IP S with a timer counting up to 1 only, leading to a reduced power consumption of the processor of about 560µW . Increasing monostable period is
possible to reduce system clock frequency, but at the price of filtering the input with a sharp analog anti-aliasing filter, leading to an important power consumption.
Figure 7: Monostable Overlapping at High Frequency
3.2.3 CTMU module
The CMTU module is a controlled current source. Charging an external capacitor, it is the heart of the system. Um is triggering the constant current charge periods of the capacitor, leading to phases
of linear increase of the capacitor voltage UC as shown on Fig. 4. UC cannot exceed power supply
voltage (Vdd = 3.3V ), and thus needs to be reset periodically by UReset at the frequency FT rCp.
Figure 8: CTMU Principle Overview [21]
Tuning CTMU parameters is fundamental in order to reduce power consumption while having a precise measurement. In our application, we want to detect a high frequency signal at 100kHz. This detection is done at a frequency FT rCp = 1kHz, in order to have a good reactivity of the wake-up
system. This leads to integrate N = 100 current pulses of duration Tm = 2.10−6s between 2 resets as
described in equation 1. Because UC cannot exceed Vdd= 3.3V , this leads to :
I0
C < Vdd
N ∗ Tm
The CTMU current can be configured by software to 550µA, 55µA, 5.5µA or 550nA, leading respectively to minimum capacitor values of 33nF , 3.3nF , 330pF or 33pF according to equation 3. Choosing the minimum current leads to the lower power consumption, but in this case capacitor has to be very low in order to reach an acceptable voltage for further comparisons. This very low capacitor reduces the precision of the CTMU integrator, because parasitic capacitance and resistance are not taken into account, leading to both a precision and linearity error. It is better to charge a bigger capacitance in order to avoid these side effects, such as 470pF coupled with a current of 5.5µA. In this case the voltage obtained with an input signal at 100kHz is UC = 2.34V according to equation
2, with a limited current delivered by the CTMU.
3.2.4 Output Comparators
Just before reset, UC gives a good approximation of the average frequency of the input signal between
the last reset and the future one as shown in equation 2. Therefore this value is to be used as an output of the system. Converting it into a digital value using the ADC module would draw to much energy, so it is more efficient to use comparators which are only activated just before the reset of UC
and latched during the rest of the time.
Several comparators can be used in order to select a specific range of frequencies : for example one is activated when the measured frequency is lower than a specified value, and another one activated when the frequency is higher than another specified value, as shown in Fig. 5.
Configuration of the output comparators thresholds is done by software [22], with a limited number of 32 evenly distributed voltage references between Vss= 0V and Vdd = 3.3V . Detecting UC = 2.34V
can be done by setting voltage references UOutCp1= 2.37V for the high threshold, and UOutCp2= 2.26V
for the low threshold. This thresholds configuration will detect an input signal having its frequency between 96.5kHz and 101.3kHz. This selection band is very narrow compared to much more power consuming high order analog bandpass filters.
However, the selection band width is strongly related to the CTMU charge unit configuration described in 3.2.3. A too small current, or a too big capacitance would lead to reach a smaller analog value UC, requiring to reduce the level of the thresholds for a given input frequency. This would lead
to decrease the precision of the selection band.
In conclusion of this part, knowing the frequency range of a signal is an important and useful information for indicating that there is a strong presumption that the input signal corresponds to something wanted. Then, more precise but more energy consuming operations can be triggered for checking the signal, but they are not in the field of this paper.
3.3 Low Power Management
In this paper, we aim at reducing drastically the power needed for detecting interesting signals hap-pening rarely. Thus, low power mode management is important and described in this section.
Our MCU, a P IC24F J 256GB410 has extended low power features. Power consumption in normal mode at 16 MIPS under 3.3V is 17.5mW , which is important compared with the microphone one (0.5mW ). In sleep mode, the MCU consumes 13µW .
Having the MCU in sleep mode most of the time is necessary to reduce power consumption. However, the monostable timer cannot be used in sleep mode, because system clock is stopped. Con-sequently, the MCU has to be active during monostable pulse generation. During this phase, system clock frequency has to be reduced to a minimum, having a period Tcycorresponding to the duration of
a monostable pulse. As explained before, that leads to operate at a system frequency Fcy= 0.5M IP S,
with a power consumption of 0.56mW . This low frequency mode is enabled while incoming signal is present, sleep mode is activated when there is no signal for 1 second.
As a result of this low power management scheme, even when incoming signal is always present (that could happen in windy environment for example), the power consumption of the wake-up detec-tor (0.56mW ) is equivalent to the microphone power consumption (0.5mW ). Further improvement is possible to divide power consumption by 4 if the input frequency is lower than 100kHz, by activat-ing the sleep mode between monostable pulses. This can be interestactivat-ing when processactivat-ing data from extremely low power sensors.
Current drawn by the CTMU module is not significant if the CTMU is set-up correctly has de-scribed in 3.2.3.
4
Results
One of the main goal of our frequency wake-up system is to process signal continuously with a limited power consumption. Every function has been optimized carefully for reducing it. Our system works with a limited power consumption of less than 0.6mW , not including the microphone, which can drop to 13µW in sleep mode.
This allows to use it to optimize drastically battery life in environmental IoT devices by selecting only the useful moments of the signal. Considering a system having two ultrasonic microphones to allow basic 2D source localization, each one consuming 0.5mW , and powering the system by a 14.5W h battery (classical 12V − 1.2Ah lead battery), our wake-up system can be active about almost 3 years in continuous mode, compared with a 30 hours of continuous recording with most of the time no useful signal as explained in introduction.
5
Conclusion and future works
In this paper, we have presented a low power wake-up system based on frequency analysis which can be used as a first continuous signal processing stage for detecting the presence of a desired frequency in a signal.
Although the implementation is simple, it is very efficient when trying to record very high fre-quency environmental signals happening rarely. In theses situations, average power consumption of the recording system can be reduced by a factor 200 or more, and mass storages are filled only with potentially interesting data.
To go further, we are focusing on reducing power consumption of our wake-up system to use it with lower throughput data on very small embedded systems, such as wearable sensors for studying birds. In this case, power consumption for recording is reduced and the wake-up system power consumption has also to be reduced to make it still relevant. To achieve that, we will investigate for replacing the MCU by ultra low power discrete components in a first time, and by a silicon implementation in a second step.
Furthermore, our system will be tested on submarine monitoring systems using hydrophones for detecting Mediterranean marine mammals in the Pelagos Sanctuary, a marine protected area.
Acknowledgment
The authors would like to thank the Parc National de Port Cros in France for their cooperation in the development and use of our recording systems and acoustic wake-up systems.
The authors would particularly like to thank the Embedded Electronics Technology Platform of Toulon University named SMIoT ( Scientific Microsystems for Internet of Things) [23] for its support in the achievement of the system.
References
[1] J.O. Whitaker, ”National Audubon Society Field Guide to North American Mammals”. New York, 1996, pp. 310-312.
[2] S. R. Ganti and Y. Kim, ”Implementation of detection and tracking mechanism for small UAS,” 2016 International Conference on Unmanned Aircraft Systems (ICUAS), Arlington, VA, 2016, pp. 1254-1260.
[3] SMIoT, ”Technical Report on High Frequency Recording Systems”, 2017 [Online]. Available : http://www.smiot.fr.
[4] H. Glotin, M. Poupard, F. Monia, J. Ricard, V. Roger, V. Barchasz, V. Gies and D. Geoffroi, ”Analyse temps-r´eel de masse acoustique pour le suivi d’esp`ece nuisible `a Port-Cros”, 2017. Re-search Report, UTLN CNRS LSIS, December 2017, 23 pages.
[5] B. Gestner, J. Tanner and D. Anderson, ”Glass Break Detector Analog Front-End Using Novel Classifier Circuit”, 2007 IEEE International Symposium on Circuits and Systems (ISCAS), New Orleans, LA, 2007, pp. 3586-3589.
[6] S. Jeong and Y. Chen and T. Jang and J. Tsai and D. Blaauw and H. S. Kim and D. Sylvester, ”21.6 A 12nW always-on acoustic sensing and object recognition microsystem using frequency-domain feature extraction and SVM classification”, 2017 IEEE International Solid-State Circuits Conference (ISSCC), San Francisco, CA, 2017, pp. 362-363.
[7] B. Rumberg, D. W. Graham, V. Kulathumani and R. Fernandez, ”Hibernets: Energy-Efficient Sensor Networks Using Analog Signal Processing,” 2011, IEEE Journal on Emerging and Selected Topics in Circuits and Systems, vol. 1, no. 3, pp. 321-334, Sept. 2011.
[8] R. A. Dobre, V. A. Nit¸ˇa, A. Ciobanu, C. Negrescu and D. Stanomir, ”Low computational method for siren detection”, 2015 IEEE 21st International Symposium for Design and Technology in Elec-tronic Packaging (SIITME), Brasov, 2015, pp. 291-295.
[9] F. H¨oflinger, G. Ulrich Gamm, J. Albesa, L. M. Reindl, ”Smartphone remote control for home au-tomation applications based on acoustic wake-up receivers.” in Instrumentation and Measurement Technology Conference, 2014 Conference Record on IEEE 2014 p.p. 1580-1583.
[10] A. Sanchez, S. Blanc, P. Yuste and J. J. Serrano, ”RFID Based Acoustic Wake-Up System for Underwater Sensor Networks,” 2011 IEEE Eighth International Conference on Mobile Ad-Hoc and Sensor Systems, Valencia, 2011, pp. 873-878.
[11] F. Ge and Y. Yan, ”Deep neural network based wake-up-word speech recognition with two-stage detection,” 2017 IEEE International Conference on Acoustics, Speech and Signal Processing (ICASSP), New Orleans, LA, 2017, pp. 2761-2765.
[12] G.Cauwenberghs, A. Andreou, J. West, M. Stanacevic, A. Celik, P. Julian, T. Teixeira, C. Diehl, L. Riddle , ”A miniature low-power intelligent sensor node for persistent acoustic surveillance”, 2005 Unattended Ground Sensor Technologies and Applications VII, Carapezza, E. M. May 2005, V. 5796, pp. 294-305.
[13] R. Kojima, O. Sugiyama, R. Suzuki, K. Nakadai and C. E. Taylor, ”Semi-automatic bird song analysis by spatial-cue-based integration of sound source detection, localization, separation, and identification,” 2016 IEEE/RSJ International Conference on Intelligent Robots and Systems (IROS), Daejeon, 2016, pp. 1287-1292.
[14] K. Nakamura and K. Nakadai, “Robot audition based acoustic event identification using a bayesian model considering spectral and temporal uncertainties,” in Intelligent Robots and Systems (IROS), 2015 IEEE/RSJ International Conference on. IEEE, 2015, pp. 4840–4845.
[15] T. Otsuka, K. Ishiguro, H. Sawada, and H. G. Okuno, “Bayesian nonparametrics for microphone array processing,” T-ASLP, vol. 22, no. 2, pp. 493–504, 2014.
[16] D. Rybach, R. Schluter, and H. Ney, “Silence is golden: Modeling nonspeech events in wfst-based dynamic network decoders,” in ICASSP- 2012. IEEE, 2012, pp. 4205–4208.
[17] M. L. Chin and J. J. Burred, “Audio event detection based on layered symbolic sequence rep-resentations,” in Acoustics, Speech and Signal Processing (ICASSP), 2012 IEEE International Conference on. IEEE, 2012, pp. 1953–1956.
[18] Microchip Technology Incorporated, PIC24FJ256GA412/GB412 Family : 16-Bit Flash Micro-controllers with Dual Partition Flash Memory, XLP, LCD, Cryptographic Engine and USB On-The-Go, DS30010089D datasheet, February 2015 [Revised December 2016].
[19] Microchip Technology Incorporated, Charge Time Measurement Unit (CTMU) and CTMU Op-eration with Threshold Detect, DS30009743B datasheet, March 2011 [Revised April 2016]. [20] Padmaraja Yedamale and Jim Bartling, Microchip Technology Incorporated, AN1375 : See What
You Can Do with the CTMU, DS01375A Application Note, February 2011.
[21] Microchip Technology Incorporated, ”Overview of Charge Time
Measurement Unit (CTMU)”, 2008, p 15. [Online]. Available:
http://www.microchip.com/stellent/groups/SiteComm sg/documents /DeviceDoc/en542792.pdf. [Accessed: 20-February-2018]
[22] Microchip Technology Incorporated, Comparator Voltage Reference Module, DS39709A datasheet, June 2006.
[23] SMIoT, ”SMIoT : Scientific Microsystems for the Internet of Things”, 2017. [Online]. Available: http://www.smiot.fr. [Accessed: 19-February-2018].


![Figure 8: CTMU Principle Overview [21]](https://thumb-eu.123doks.com/thumbv2/123doknet/14641215.735316/9.892.195.715.619.926/figure-ctmu-principle-overview.webp)