HAL Id: tel-02524361
https://tel.archives-ouvertes.fr/tel-02524361
Submitted on 30 Mar 2020
HAL is a multi-disciplinary open access archive for the deposit and dissemination of sci-entific research documents, whether they are pub-lished or not. The documents may come from teaching and research institutions in France or abroad, or from public or private research centers.
L’archive ouverte pluridisciplinaire HAL, est destinée au dépôt et à la diffusion de documents scientifiques de niveau recherche, publiés ou non, émanant des établissements d’enseignement et de recherche français ou étrangers, des laboratoires publics ou privés.
Web
Camille Bernard
To cite this version:
Camille Bernard. Immersing evolving geographic divisions in the semantic Web. Mathematical Soft-ware [cs.MS]. Université Grenoble Alpes, 2019. English. �NNT : 2019GREAM048�. �tel-02524361�
Pour obtenir le grade de
DOCTEUR DE LA COMMUNAUTÉ
UNIVERSITÉ GRENOBLE ALPES
Spécialité : InformatiqueArrêté ministériel : 25 mai 2016
Présentée par
Camille Bernard
Thèse dirigée parM. Jérôme Gensel codirigée parM. Hy Dao
et co-encadrée parMme Marlène Villanova-Oliver
préparée au sein duLaboratoire d’Informatique de Grenoble
et de l’École Doctorale Mathématiques, Sciences et Technologies de l’Information, Informatique
Immersing evolving geographic divisions
in the semantic Web
Towards spatiotemporal knowledge graphs to reflect territorial dynamics over time
Thèse soutenue publiquement le27 novembre 2019, devant le jury composé de :
Mme Sihem Amer-Yahia
Directrice de recherche CNRS Délégation Alpes, LIG, Université Grenoble Alpes, Présidente
Mme Nathalie Aussenac-Gilles
Directrice de Recherche CNRS Délégation Occitanie Ouest, IRIT, Université de Toulouse, Rapporteur
M. Christophe Claramunt
Professeur des Universités, Institut de Recherche de l’Ecole navale, Rapporteur Mme Thérèse Libourel
Professeur émérite, Université de Montpellier, Examinatrice M. Christophe Cruz
Maître de Conférences HDR, Université Bourgogne Franche-Comté,
Examinateur
Mme Marlène Villanova-Oliver
Maître de Conférences HDR, Université Grenoble Alpes, Co-Encadrante de thèse M. Jérôme Gensel
Professeur des Universités, Université Grenoble Alpes, Directeur de thèse M. Hy Dao
Au cours de cette thèse, il y a eu bien des événements et des changements, comme certainement au cours de toutes les thèses d’ailleurs. Une période courte où tant de choses se bousculent, où les doctorants eux-mêmes sont amenés à tant changer, à voyager, faire des rencontres, franchir des obstacles tout en ne perdant pas de vue l’objectif "majeur", rendre un manuscrit et avoir par celui-ci contribué (au moins un tout petit peu) à sa discipline. Ce parcours se clôt par des échanges avec des chercheurs dont bien souvent nous lisons avec admiration les travaux depuis longtemps, c’est combien vous assurer l’honneur que me font l’ensemble des membres de mon jury par leur présence lors de cette soutenance.
Je souhaite exprimer ici en premier lieu mes plus sincères remerciements à Madame Aussenac-Gilles et à Monsieur Claramunt, tous deux rapporteurs de ces travaux. Merci à vous pour le temps consacré à l’évaluation de ces travaux, pour vos remarques et propositions, qui alimentent depuis de nouvelles réflexions. Mes sincères remerciements vont également à Madame Amer-Yahia, Madame Libourel et Monsieur Cruz examinateurs de ces travaux. Un petit mot particulier pour Madame Libourel, qui lors d’une courte discussion au cours de ma thèse, a su donner un nou-vel éclairage à ma problématique.
Je remercie ensuite très chaleureusement mes trois encadrants Madame Marlène Villanova-Oliver, Monsieur Jérôme Gensel et Monsieur Hy Dao, pour leur confi-ance et leur soutien tout au long de ces années. Merci Jérôme pour tes lectures et relectures multiples, un peu partout dans le monde. Merci pour ton humour qui permet à tous de décompresser en réunion. Merci Hy pour tes conseils et ton ent-housiasme pour ces travaux. Merci d’avoir fait le pas vers ces problématiques très informatiques. Merci beaucoup Marlène pour tous ces moments de discussion, et de co-construction de ces travaux de recherche, pour tout ce que tu m’as appris, pas uniquement en recherche. Merci pour ta rigueur scientifique, ton sens du détail mais surtout merci pour ta générosité et ton soutien que tu offres à tous les membres de l’équipe STeamer. J’ai pris beaucoup de plaisir à travailler avec vous trois et j’estime avoir eu beaucoup de chance d’être encadrée par trois chercheurs très différents mais aussi très complémentaires.
Si je remonte maintenant le temps pour en revenir au début de ce parcours universitaire, je souhaite en premier lieu remercier chaleureusement mes professeurs du DCISS (en particulier Monsieur Jean-Michel Adam, Monsieur Daniel Bardou et Monsieur Jérôme Gensel) qui, par leur démarche pédagogique, savent accompagner des étudiants en reconversion (avant l’informatique, j’ai étudié la linguistique, pas sans lien d’ailleurs avec ces travaux de thèse, car les cours qui me passionnaient à l’époque étaient alors des cours de sémantique et sémiologie).
Viennent ensuite des années en tant qu’ingénieur auprès de Madame Isabelle Salmon, Monsieur Ronan Ysebaert et Benoit Le Rubrus. Merci à vous trois pour tout ce que vous m’avez appris, j’ai maintenant quelques tic et tocs (de travail)
certainement suite à ces années, parce que vous vous engagez tellement dans ce que vous faites qu’il est difficile ensuite de ne pas en faire autant. Merci beaucoup Benoit pour toutes nos discussions et pour tes encouragements à poursuivre en thèse.
Au commencement de cette thèse, je prends conscience du travail de recherche remarquable accompli par Madame Christine Plumejeaud, au cours de sa thèse quelques années auparavant au LIG, STeamer. Je remercie alors Marlène et Jérôme pour m’avoir fait rencontrer Christine. S’ensuivent des échanges et des collabora-tions pour des articles et je te remercie Christine pour tes conseils et ta formidable énergie partagés à cette occasion. Ces travaux n’auraient pas pu autant aboutir sans ton implication et tes connaissances.
Je remercie également tous les enseignants-chercheurs de l’équipe STeamer : Paul-Annick Davoine, Danielle Ziebelin (merci Danielle pour toutes nos discussions scientifiques ou non, et pour m’avoir impliquée dans tes projets de recherche), Mar-lène Villanova-Oliver, Philippe Genoud, Sylvain Bouveret, Jérôme Gensel et toutes les personnes rencontrées au labo depuis le début de cette thèse. Merci aux in-génieurs, aux doctorants, aux stagiaires et mes remerciements tous particuliers à Yagmur Cinar, Lina Toro, Mahdieh Khosravi, Raffaella Balzarini, Aline Menin, Camille Cavalière, Karine Aubry, Maeva Seffar, Fatima Danash, Anna Mannai, Jacques Gautier, David Noël, Anthony Hombiat, Gabriel Lopez, Thibaut Thonet, Lies Hadjadj, Matthieu Viry, Clément Chagnaud, Adrien Dulac, Matthew Sreeves, Georgios Balikas. Un grand merci également pour leur chaleureux accueil à tous mes nouveaux collègues de l’IUT2 Grenoble départements Tech. de Co. et Info-com, et en particulier, merci pour la confiance qu’ont su me faire Didier Schwab et Benjamin Lecouteux. Un grand merci aussi à toutes les personnels techniques et administratifs du laboratoire LIG qui, par leur accompagnement, nous permettent de réaliser nos recherches sereinement. MERCI en particulier à Pascale Poulet, Michèle Hamm, Sylvianne Flammier, Francoise Jeewooth, Zilora Zouaoui, Christiane Plumere et enfin un grand merci à Christian Seguy pour m’avoir dépannée et aidée dans des installations serveur à de nombreuses reprises.
Une thèse sur la filiation me permet de placer facilement mes plus tendres remer-ciements à ma famille et en particulier à mes chers parents, mon grand frère, et ma petite soeur. Vous êtes là au quotidien pour moi, alors pour vous les changements se font plus continus que discrets, et c’est en ça que je souhaite vous remercier, pour toutes ces petites choses que vous faites et m’apportez depuis toujours. Je voudrais aussi remercier mes ami(e)s Julia (et p’tite patate Lucas), Cécile (et sa petite Lise), Ambre & Laura, Cynthia (et ma belle Alex, mon p’tit Darel), Miléna, Marine, An-dré, Mihary, Anja, Ivan, Kevin. A ma belle-famille et tout particulièrement dadabe Claude et bebe Honorine, Masy, Rindra, Maeva, Josoa. Enfin, je remercie du plus profond de mon coeur Aronarivo le premier a m’avoir parlé de SIG, présent au quo-tidien pour me faire rire et m’aider à avancer dans mes études -tiako ianao-. A notre fille Clara Line-Tsoa, le plus Grand changement et le plus bel événement survenu au cours de cette thèse.
Dans le Web des données ouvertes, on observe de nos jours une augmentation du volume de données provenant du secteur public, d’organismes gouvernementaux et notamment d’instituts officiels de statistique et de cartographie. Ces institutions publient des statistiques géo-codées à travers des découpages géographiques permettant aux responsables politiques de disposer d’ana-lyses fines du territoire dont ils ont la charge. Ces découpages, construits pour les besoins de la statistique mais dérivant généralement de structures électorales ou administratives, sont nommés Nomenclatures Statistiques Territoriales (acronyme TSN en anglais). Les TSN codifient les unités géographiques qui, sur plusieurs niveaux d’imbrication (par exemple, en France les niveaux ré-gional, départemental, communal, etc.), composent ces territoires. Or, partout dans le monde, les découpages dont ces territoires font l’objet sont fréquemment soumis à des modifications : de nom, d’affiliation, de frontières, etc. Ces changements sont un obstacle patent à la comparabilité des don-nées socio-économiques au cours du temps, celle-ci n’étant possible qu’à la condition d’estimer les données dans un même découpage géographique, un processus compliqué qui finit par masquer les changements territoriaux. Dès lors, des solutions conceptuelles et opérationnelles sont nécessaires pour être en mesure de représenter et de gérer différentes versions de TSNs, ainsi que leur évolu-tion dans le temps, dans le contexte du Web des Données Ouvertes. De tels outils permettraient en effet d’améliorer la compréhension des dynamiques territoriales, de documenter les changements territoriaux à l’origine de ruptures dans les séries statistiques et d’éviter des interprétations et manipulations erronées des données statistiques disponibles.
Dans cette thèse, nous présentons un framework nommé Theseus qui s’appuie sur les techno-logies du Web sémantique pour représenter les découpages géographiques et leurs évolutions au cours du temps sous forme de données ouvertes et liées (Linked Open Data (LOD) en anglais). Ces technologies garantissent notamment l’interopérabilité syntaxique et sémantique entre des sys-tèmes échangeant des TSNs. Theseus est composé d’un ensemble de modules permettant la gestion du cycle de vie des TSNs dans le Web des LOD : de la modélisation des zones géographiques et de leurs changements au cours du temps, à la détection automatique des changements, jusqu’à l’exploitation de ces descriptions dans le LOD Cloud. L’ensemble des modules logiciels est arti-culé autour de deux ontologies nommées TSN Ontology et TSN-Change Ontology, que nous avons conçues pour une description spatiale et temporelle non ambiguë des structures géographiques et de de leurs modifications au cours du temps.
Theseus s’adresse tout d’abord aux agences statistiques, car il facilite considérablement la mise en conformité de leurs données géographiques avec les directives Open Data. De plus, les graphes de connaissances générés améliorent la compréhension des dynamiques territoriales, en fournissant aux décideurs politiques, aux techniciens, aux chercheurs et au grand public des descriptions sé-mantiques fines des changements territoriaux, exploitables pour des analyses fiables et traçables. L’applicabilité et la généricité de notre approche sont illustrées par des tests du framework Theseus menés sur trois TSN officielles : la Nomenclature européenne des unités territoriales statistiques (versions 1999, 2003, 2006 et 2010) de l’Institut statistique européen Eurostat ; les unités adminis-tratives de la Suisse de l’Office fédéral suisse de la statistique, décrivant les cantons, districts et communes de la Suisse en 2017 et 2018 ; l’Australian Statistical Geography Standard, construit par le Bureau australien de la statistique, composé de sept divisions imbriquées du territoire australien, dans les versions 2011 et 2016.
On the Open Data Web, there is an increase of the amount of data coming from the public sector. Most of these data are created by government agencies, including Statistical and Mapping Agencies. These institutions publish geo-coded statistics through geographic divisions. These statistics are of utmost importance for policy-makers to conduce various analyzes upon the territory they are responsible for. The geographic divisions built by Statistical Agencies for purposes of data collection and restitution are called Territorial Statistical Nomenclatures (TSNs). They are sets of artifact areas although they usually correspond to political or administrative structures. TSNs codify the geographic areas which, on several nested levels (for instance, in the United Kingdom, the regions, districts, sub-districts levels, etc.), compose these territories. However, all around the world, these geographic divisions often change: their names, belonging or boundaries change for political or administrative reasons. Consequently, these changes are a clear obstacle to the compa-rability of socio-economic data over time, as this is only possible if data are estimated in the same geographical divisions, a complicated process that, in the end, hide territorial changes. Conceptual and operational solutions are needed to be able to represent and man-age different versions of TSNs, as well as their evolution over time, in the Open Data Web context. By extension, these tools should improve the understanding of territorial dynam-ics, document the territorial changes causing breaks in the statistical series and avoid wrong interpretations and manipulations of the available statistical data.
In this thesis, we present the Theseus Framework. Theseus adopts Semantic Web tech-nologies and Linked Open Data (LOD) representation for the description of the TSNs’ areas, and of their changes: this guaranties among others the syntactic and semantic in-teroperability between systems exchanging TSN information. Theseus is composed of a set of modules to handle the whole TSN data life cycle on the LOD Web: from the model-ing of geographic areas and of their changes, to the automatic detection of changes and exploitation of these descriptions on the LOD Web. All the software modules rely on two ontologies, TSN Ontology and TSN-Change Ontology, we have designed for an unambiguous description of the areas and of their changes in time and space.
This framework is intended first for the Statistical Agencies, since it considerably helps them to comply with Open Data directives, by automating the publication of Open Data representation of their geographic divisions that change over time. Second, the gener-ated knowledge graphs enhance the understanding of territorial dynamics, providing policy-makers, technicians, researchers, general public with fine-grained semantic descriptions of territorial changes to conduct various accurate and traceable analyses. The applicability and genericity of our approach is illustrated by testing Theseus on three very different official TSNs: The European Nomenclature of Territorial Units for Statistics (NUTS) (versions 1999, 2003, 2006, and 2010) from the European Eurostat Statistical Institute; The Switzer-land Administrative Units (SAU), from The Swiss Federal Statistical Office, that describes the cantons, districts and municipalities of Switzerland in 2017 and 2018; The Australian Statistical Geography Standard (ASGS), built by the Australian Bureau of Statistics, com-posed of seven nested divisions of the Australian territory, in versions 2011 and 2016.
Contents . . . xv
Acronyms . . . xix
List of Figures . . . xxiv
List of Tables . . . xxv
List of Listing Codes . . . xxviii
1 Introduction . . . 1
1.1 Context . . . 1
1.2 Problematic . . . 7
1.3 Contributions . . . 8
1.4 Thesis Outline . . . 10
A State of the Art . . . 13
2 Territorial Statistical Information . . . 15
2.1 Current states of Territorial Statistical Information . . . 15
2.1.1 Not fully interconnected data . . . 15
2.1.2 Broken time-series . . . 20
2.1.3 Removal of territorial changes . . . 21
2.2 Territorial Statistical Nomenclature Structures . . . 22
2.3 Territorial Statistical Nomenclature that change over time . . . 30
Preliminary Remarks – Data management process in the Semantic Web . . . 40
3 Specifying and Modeling spatiotemporal entities . . . 41
3.1 Specifying . . . 41
3.1.1 Spatiotemporal entities . . . 41
3.1.2 Identity concept . . . 42
3.1.3 Versioning in computer science . . . 42
3.2 Modeling . . . 44
3.2.1 Standard space and time ontologies . . . 44
3.2.2 Fundamentals for the modeling of spatiotemporal entities . . . 47
4 Modeling evolving geographic divisions and TSNs . . . 59
4.1 Modeling evolving geographic divisions . . . 59
4.1.1 Land-cover context - The Continuum Model . . . 59
4.1.2 Historical Context - The Finnish Spatiotemporal Ontology . . 63
4.1.3 Political context - The Jurisdictional Domain Ontology . . . . 66
4.1.4 Administrative Context - The SONADUS Ontology . . . 70
4.2 Modeling evolving TSNs and their changes . . . 72
4.2.1 Ontologies for TSN representation . . . 74
4.2.2 TSN data sets as Linked Data . . . 76
4.2.3 A spatiotemporal model for TSN . . . 77
5 Generating and Exploiting descriptions of evolving TSN . . . 81
5.1 Generating . . . 81
5.1.1 Conflation Algorithms . . . 82
5.1.2 Algorithm for the automatic matching of two TSN versions . 83 5.1.3 Methodology for constructing filiation links in CLC data sets 84 5.1.4 Version Control System . . . 86
5.2 Exploiting . . . 88
5.2.1 Linked Open statistical data sets . . . 89
5.2.2 Contextual information about territorial changes . . . 91
6 Synthesis . . . 93
B Contributions . . . 99
7 The Theseus Framework . . . 101
7.1 Introduction . . . 101
7.2 Motivations and requirements . . . 102
7.3 Use Cases . . . 103
7.4 Prerequisites . . . 104
7.5 Overall Architecture . . . 105
7.6 Conclusion . . . 106
8 The TSN ontological model . . . 109
8.1 Introduction . . . 109
8.2 Specifications . . . 109
8.3 The TSN Ontology . . . 112
8.4 The TSN-Change Ontology . . . 115
8.5 Conclusion . . . 120
9 Populating the TSN ontological model . . . 121
9.1 Introduction . . . 121
9.2 Workflows . . . 121
9.3 Populating the TSN Ontology . . . 122
9.4 Populating the TSN-Change Ontology . . . 124
9.4.1 Methodology . . . 124
9.4.2 The TSN Semantic Matching Algorithm . . . 126
9.4.3 The Workflow . . . 138
9.5 Conclusion . . . 139
10 Case studies and discussion . . . 141
10.1 Introduction . . . 141
10.2 Case Studies . . . 141
10.2.1 Main characteristics of the three TSNs . . . 142
10.2.2 The NUTS Eurostat Nomenclature . . . 143
10.2.3 The Swiss Administrative Units . . . 148
10.2.4 The Australian Statistical Geography Standard . . . 153
10.3 Discussion . . . 160
10.3.1 Algorithm Complexity . . . 160
10.3.2 Geometries Generalization Problem . . . 162
10.3.3 Genericity of the approach . . . 166
10.4 Conclusion . . . 169
11 Exploring and Exploiting the TSN model and data . . . 171
11.1 Introduction . . . 171
11.2 Knowledge extraction from TSN history graphs . . . 171
11.2.1 Vertical reading of the change graphs . . . 171
11.2.2 Horizontal reading of the change graphs . . . 176
11.2.3 Towards a user interface to geo-visualize changes . . . 176
11.3 Automatic contextualization of territorial changes . . . 179 11.4 Exploitation of TSN history graphs with Linked Open statistical Data 182
11.5 The TSN catalogs of areas for statistics . . . 185
11.6 Conclusion . . . 187
12 Conclusion . . . 189
12.1 Summary of the contributions . . . 190
12.2 Future research and development directions . . . 192
12.2.1 Automatic contextualization of changes . . . 192
12.2.2 Managing other kinds of geographic divisions . . . 193
12.2.3 Create bridges between TSNs . . . 197
12.2.4 Describe other kinds of changes . . . 197
12.2.5 GUI for territorial changes visualization . . . 199
References . . . 201
A The Theseus data life cycle . . . 219
The following papers were published as part of this thesis:
— Bernard, C., Villanova-Oliver, M., Gensel, J., and Le Rubrus, B. (2017a) Spatio-Temporal evolutive Data Infrastructure: a Spatial Data Infrastructure for managing data flows of Territorial Statistical Information, International Journal of Digital Earth, 10(3):257–283,. ISSN: 1753-8947, 1753-8955. DOI-URL https://ww w.tandfonline.com/doi/full/10.1080/17538947.2016.122200.
— Bernard, C., Villanova-Oliver, M., Gensel, J., and Dao, H. (2017b) TSN et TSN-change : ontologies pour représenter l’évolution des découpages territoriaux statistiques. Conférence internationale de géomatique Sageo, Novembre 2017, Rouen, France.
— Bernard, C., Villanova-Oliver, M., Gensel, J., and Dao, H. (2018a) Modeling changes in territorial partitions over time: Ontologies tsn and tsn-change. ISBN: 978-1-4503-5191-1. In Proceedings of the 33rd Annual ACM Symposium on Applied Computing, SAC’18, pages 866–875. ACM. DOI-URL http://doi.acm.org/10. 1145/3167132.3167227.
— Bernard, C., Villanova-Oliver, M., Gensel, J., and Dao, H. (2018b) On-tologies pour représenter l’évolution des découpages territoriaux statistiques. Revue Internationale de Géomatique, 28 4 (2018) 409-437. DOI-URL: https://doi.or g/10.3166/rig.2019.00069.
— Bernard, C., Plumejeaud-Perreau, C., Villanova-Oliver, M., Gensel, J., and Dao, H. (2018c) An ontology-based algorithm for managing the evolution of multi-level territorial partitions. ISBN: 978-1-4503-5889-7. In Proceedings of the 26th ACM SIGSPATIAL International Conference on Advances in Geographic Information Systems, SIGSPATIAL’18, pages 456–459, New York, NY, USA. ACM. DOI-URL http://doi.acm.org/10.1145/3274895.3274944.
— Bernard, C., Plumejeaud-Perreau, C., Villanova-Oliver, M., Gensel, J., and Dao, H. (will be published in 2020) Semantic graphs to reflect the evolution of geographic subdivisions. Handbook of Big Geospatial Data edited by Martin Werner and Yao-Yi Chiang, Springer.
ASGS Australian Statistical Geography Standard CLC Corine Land Cover
COSP Change Of Support Problem ESMS Euro-SDMX Metadata Structure GUI Graphical User Interface
LAU Local Administrative Units LOD Linked Open Data
MAUP Modifiable areal Unit Problem MUA Morphological Urban Areas NSA National Statistical Agency
NUTS Nomenclature of territorial units for statistics OGC Open Geospatial Consortium
QB RDF Data Cube
R2RML Relational Databases to RDF Mapping Language RDF Resource Description Framework
SA Statistical Agency
SAU Switzerland Administrative Units
SDMX Statistical Data and Metadata eXchange SMA Semantic Matching Algorithm
SPARQL SPARQL Protocol and RDF Query Language TSI Territorial Statistical Information
TSN Territorial Statistical Nomenclature TU Territorial Unit
UMZ Urban Morphological Zones URI Uniform Resource Identifier VCS Version Control System W3C World Wide Web Consortium
1.1 Tim Berners-Lee, the inventor of the Web and Linked Data initiator, suggested a 5-star deployment scheme for Open Data [Hausenblas, 2012]. . . 3 1.2 Example of Linked Resources on the Web using URI and the RDF
syntax for their identification and representation. . . 4 1.3 Simplified illustration of the RDF Graph representing territorial changes
we want to achieve. . . 9 2.1 Extract of the ESMS model (based on the Eurostat Metadata
Struc-ture, source: http://ec.europa.eu/eurostat/data/metad ata/metadata-structure . . . 17 2.2 INSPIRE data model extract (Based on: INSPIRE Consolidated
UML Model http://inspire.ec.europa.eu/data-model/a pproved/r4618-ir/html/) . . . 18 2.3 Eurostat Unemployment rates by sex, age and NUTS regions data set
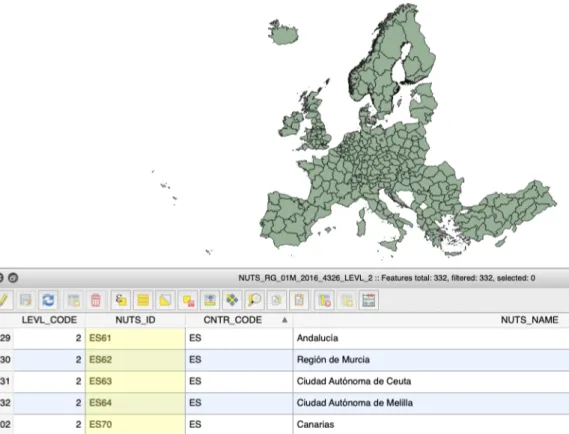
extract (source https://ec.europa.eu/eurostat/web/prod ucts-datasets/-/LFST_R_LFU3RT) . . . 19 2.4 Eurostat NUTS 2016 Level 2 ESRI shapefile. Data was rendered using
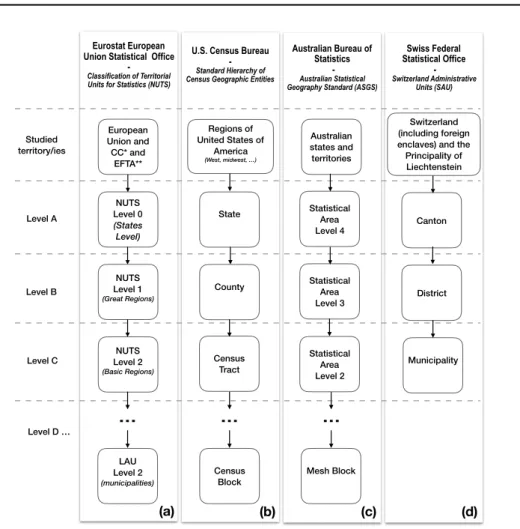
the QuantumGIS software (source https://ec.europa.eu/eur ostat/cache/GISCO/distribution/v2/nuts/download/re f-nuts-2016-01m.shp.zip) . . . 19 2.5 Schema of a Territorial Statistical Nomenclature Structure. . . 22 2.6 Four TSNs Structures from four agencies producing, managing and
delivering official statistics (Eurostat, the U.S. Census Bureau, the Australian Bureau of Statistics and the Swiss Federal Statistical Office). 25 2.7 The NUTS divisions of the French territory into four levels. . . 26 2.8 Territorial nomenclatures heterogeneity: example of the NUTS and
UMZ nomenclatures. . . 27 2.9 Example of two versions of a TSN represented as tree data structures. 28 2.10 Example of covering and non-covering hierarchies. . . 28 2.11 Example of strict and non-strict hierarchies. . . 29 2.12 Example of onto and non-onto hierarchies. . . 29 2.13 Intercommunalities: a non-covering, non-strict, and non-onto
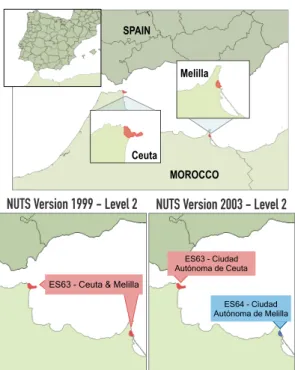
nomen-clature. Source: [Plumejeaud et al., 2011]. . . 30 2.14 Example of territorial change - Split of the territorial unit ES63 from
NUTS Version 1999 to NUTS Version 2003, at Level 2. . . 32 2.15 Different Problems related to spatial sampling (Figure inspired from
[Louvet et al., 2015]) . . . 34 2.16 Modifiable areal Unit Problem (MAUP) – scale effect and zoning
effect (Figure inspired from [Loidl et al., 2016]) . . . 35 2.17 State of Utah Census Tracts – Source [Census Tracts Geographic
Products Branch, 2013] . . . 35 2.18 United States census geographic units [ESRI, 2017] . . . 36
2.19 Modifiable areal Unit Problem (MAUP) over time – zoning effect at time t and zoning effect over time (evolving zoning problem) . . . 37 2.20 Linked Government Data information management process, proposed
in [Villazón-Terrazas et al., 2011]. . . 39 3.1 Ship of Theseus illustration from [Vazirani, 2014]. . . 42 3.2 GeoSPARQL main classes [Perry and Herring, 2012]. . . 45 3.3 GeoSPARQL main topological relations between geo:SpatialObject A
and B [Perry and Herring, 2012]. . . 45 3.4 The GeoSPARQL main classes [Cox and Little, 2017]. . . 46 3.5 Thirteen elementary possible relations between time periods [Cox and
Little, 2017; Allen and Ferguson, 1997]. . . 47 3.6 Generic behaviour of spatiotemporal objects using the Statechart
no-tation, from [Renolen, 1997]. . . 48 3.7 Typology of spatiotemporal processes from [Claramunt and
Théri-ault, 1995]. . . 49 3.8 The story of a land area (above) shown in the history graph notation
(below), from [Renolen, 1997]. . . 50 3.9 The main concepts of the BFO ontology. . . 54 3.10 Schematic representation of the concept of time-determined
ontol-ogy[Baratis et al., 2009]. On the left: a series of snapshot ontologies. On the right: a 4D-Fluents (perdurantist) ontology. . . 55 3.11 Example of N-ary Relations from [Batsakis et al., 2017]. . . 56 3.12 Example of 4D-Fluents from [Batsakis et al., 2017]. . . 56 4.1 Continuum Main concepts [Harbelot et al., 2013]. . . 60 4.2 Timeslice in the LC3 Model [Harbelot et al., 2015]. . . 60 4.3 The Continuum Model with different levels of filiation relationship
[Harbelot et al., 2013]. . . 61 4.4 Filiation Graphs of evolving land-parcels example [Harbelot et al.,
2015]. . . 62 4.5 A Change bridge example from [Kauppinen and Hyvönen, 2007]. . . 64 4.6 The Jurisdictional domain ontology (upper, domain and application
ontologies) from [Lopez-Pellicer et al., 2012]. . . 67 4.7 Meaning of the different succession relations in the model of
[Lopez-Pellicer et al., 2012]. . . 67 4.8 Change types of SONADUS [Gantner, 2011]. . . 71 4.9 A model for identifying geographic units into various nomenclatures,
from [Plumejeaud et al., 2011]. . . 78 4.10 Typology of territorial events in TSN, from [Plumejeaud et al., 2011]. 79 4.11 The geographical units of a TSN represented in relation to the
terri-torial events they are involved in and that lead to their change over time (LifeEvent), from [Plumejeaud et al., 2011]. . . 80 5.1 List of patterns detected in the LC3 Model [Harbelot et al., 2015]. . 85
5.2 Excerpt of a statistical data set measuring the Life Expectancy (in years), in France (the codes FR02, FR03, FR04 are the codes for french areas in the NUTS TSN). . . 89 7.1 The Theseus Semantic Framework Use Cases. . . 103 7.2 The Theseus Framework Modules. . . 105 8.1 TSN Ontological Model main concepts inherited from the BFO
on-tology (Occurrent and Continuant concepts from [Grenon and Smith, 2004]). . . 110 8.2 Combining approaches for the TSN/TSN-Change Ontological Model. 111 8.3 TSN Ontology - Example of three TSN declared using the TSN
Nomenclature main concept. . . 112 8.4 TSN Ontology main concepts. . . 114 8.5 TSN-Change Ontology main elements. . . 116 8.6 TSN-Change Ontology X-ChangeBridge Model. . . 117 8.7 Split of a TU - Scission and Extraction. . . 118 8.8 TSN-Change Ontology TU Life line. . . 119 9.1 The workflows of the Theseus Framework to populate semi-automatically
the TSN ontological model. . . 122 9.2 Ceuta and Melilla TUs in the NUTS TSN. . . 127 9.3 NUTS Hierarchy of levels linked to the example of Figure 9.2. . . 127 9.4 Iterations of the SMA Algorithm in order to find a set of TUs involved
in a same StructureChange. . . 133 9.5 Example of a multi-level change graph created with Theseus, linked
to the example Figure 9.2. . . 137 10.1 Example of three TSNs’ structures declared using the TSN Ontology. 143 10.2 SAU Districts Neuchâtel changes. . . 150 10.3 The ASGS Structures (source: https://www.abs.gov.au/web
sitedbs/D3310114.nsf/home/Australian+Statistical+G eography+Standard+(ASGS)). . . 153 10.4 The ASGS map representation of the Split of the TU 508 at level 4
and representation of the sub-changes on the sub-TUs of TU 508. . . 156 10.5 Visualization of the TUs listed in Listing 10.6 that change their code
in the NUTS from V1999 to V2003. . . 159 10.6 A solution to reduce the calculation time of ST_Intersects() on
com-plex polygons (more than 100 vertices) by reducing somewhat the number of vertices required to represent elementary polygons [Furi-eri, 2011]. . . 163 10.7 A Map of Australia highlighting the Western Australia TU (source:
https://commons.wikimedia.org/wiki/File:Western_Au stralia_locator-MJC.png. . . 165 10.8 Western Australia TU (ASGS version 2011) – The offset between the
10.9 The two TUs named Salisbury (id 40204) of the ASGS TSN in version 2011 and 2016 (the TU version 2016 is displayed in yellow, under the TU in the version 2011 to observe the boundaries differences). . . 168 11.1 The Multi-levels change graph of the NUTS 1999 TU ES6 (result of
the query in Listing 11.2, also online at http://purl.org/steam er/nuts_V1999_ES6_change_graph). . . 173 11.2 The life line of the NUTS TU ES63 (result of the query in Listing
11.6, also online at http://purl.org/steamer/nuts_ES63_l ifeline). . . 176 11.3 Visualization of evolving geospatial data with GitHub [Balter, 2014]. 177 11.4 The Theseus Framework Web Mapping GUI using request to the
Geoserver WMS (available at http://lig-tdcge.imag.fr/tsn -catalog/). . . 187 12.1 Boundaries for Illinois’s 4th United States Federal Congressional
Dis-trict, since 2013 (source: GIS (congressional districts, 2013) shapefile data was created by the United States Department of the Interior. Data was rendered using ArcGIS software by Esri. File developed for use on Wikipedia (Public domain)). . . 193 12.2 Corine Land Cover Classes (source: Copernicus Project https://
land.copernicus.eu/Corinelandcoverclasses.eps.75dp i.png/). . . 195 12.3 An example of three kinds of derivation in the CLC data set: weak,
medium and strong derivation [Harbelot et al., 2015]. . . 196 12.4 GUI proposition – Geo-visualization of the change of the district 4th
in Illinois: two maps are shown (on the left the congressional districts in 1983, and on the right the congressional districts in 1993). (Source: Jeffrey B. Lewis, Brandon DeVine, Lincoln Pitcher, and Kenneth C. Martis. (2013) Digital Boundary Definitions of United States
Con-gressional Districts, 1789-2012. Retrieved from http://cdmaps.polisci.ucla.edu on 2019-11-06.) . . . 200 1.1 The Theseus Framework data life cycle . . . 220
9.1 Extract of the list of TUs of the NUTS version 1999 (V0) (Algorithm
1 input). . . 126 9.2 Extract of the list of TUs of the NUTS version 2003 (V00) (Algorithm
1 input). . . 126 9.3 TSN Semantic Matching Algorithm Constants. . . 127 10.1 TSN triplestore numbers of triples . . . 142 10.2 Configurations for test of the Theseus Framework on the NUTS TSN.144 10.3 The NUTS TSN Change Graph – number of change nodes. . . 145 10.4 The NUTS TSN Change Graph – main change types distribution
from version 2006 to 2010. . . 146 10.5 Configurations for test of the Theseus Framework on the SAU TSN. 148 10.6 The SAU TSN Change Graph – main change types distribution from
version 2017 to 2018. . . 149 10.7 The TSN SMA Algorithm 1 implementation – configurations for
tests on the SAU TSN. . . 154 10.8 The ASGS TSN Change Graph – main change types distribution
from version 2011 to 2016. . . 155 10.9 The result of the query 10.5 that returns a chain of StructureChange
nodes, starting from the change that affects the TU asgs:V2011_-L4_508 . . . 157 10.10 Key Figures on several TSNs data sets, processed by the TSN SMA
Algorithm 1. . . 161 10.11 Variability of the TSN matching Algorithm outputs after modifying
the Spatial Thresholds. . . 169 11.1 Excerpt of the list of TUs that change at NUTS Level 1, from version
1999 to 2003, result of the query 11.1. . . 172 11.2 Part of the result of the SPARQL query 11.10. . . 180
4.1 Example of the use of the Change Vocabulary to model the merge of East Germany and West Germany in 1990. . . 64 4.2 Nested Spatial Reference Features using QB4ST [Atkinson, 2017] . 73 5.1 RDF Data Cube Observation example in turtle [Atkinson, 2017] . . 90 8.1 Description of the NUTS and ASGS nomenclatures using the TSN
Ontology vocabulary (RDF-Turtle syntax) . . . 113 9.1 URIs’ Patterns for the elements of a TSN. . . 123 9.2 An implementation of the Levenshtein distance algorithm that
al-lows to make an approximate comparison of the matching between two given strings (Author: Christine Plumejeaud). . . 130 10.1 The NUTS 1999 ES63 TU description using concepts from the TSN
and GeoSPARQL Ontologies. . . 144 10.2 The RDF change description of TU ES63 from NUTS version 1999
to 2003 – please note that the Figure 9.2 is a map representation of this event. . . 146 10.3 The RDF change description of the Canton of Neuchâtel from SAU
version 2017 to 2018. . . 151 10.4 A SPARQL query that returns all the change nodes of type "Split"
in the ASGS change graph version 2011 to 2016 at the highest level SA4. . . 155 10.5 A SPARQL query that returns the whole chain of changes that
oc-curred on the sub-TUs to the TU with code 508 that split in ASGS version 2006. . . 157 10.6 One result of the implementation of IdentificationRetructuration
search by spatial proximity (in the NUTS V1999 to 2003). . . 158 10.7 The Areal Distance Test implementation – The PostGIS DBMS SQL
request executed during the SpatialMatchTest (see Algorithm 1 line 4) ("geom1" and "geom2" are input parameters – multi-polygon geometries of the two processed TUs in V0 and V00). . . 161
10.8 The SQL script that recalculates the topological network of a TSN and simplifies each TU geometry (polygon) while maintaining a net-work where simplified units are adjacent. . . 164 11.1 A SPARQL query that returns all the TUs that change between two
TSNs versions at a specified territorial level. . . 172 11.2 A SPARQL query that returns the multi-levels change graph of a TU.172 11.3 Pathfinder syntax of path queries, source Sirin [2017]. . . 174 11.4 A SPARQL query that searches for the sub-graph of changes of a
super-TU. . . 174 11.5 A SPARQL query that, from a TU in the lowest level, goes up the
chain of changes until a super-TU. . . 175 11.6 A SPARQL query that returns the life line of a TU. . . 176 11.7 Query the TUs that do not change from one version to another at a
11.8 Query the TUs that change from one version to another at a specific territorial level. . . 178 11.9 Query the TUs that disappear from one version to another at a
specific territorial level. . . 178 11.10 A SPARQL request to the DBPedia Service in order to find
contex-tual information about a territorial change. . . 179 11.11 A description of two versions of the TUs ES63 in NUTS 1999 and
2003 using the TSN and the GeoSPARQL ontologies (RDF-Turtle syntax). . . 183 11.12 A description of the Total population Eurostat indicator - Two
ob-servations of the same indicator in different NUTS versions for the ES63 TU (RDF-Turtle syntax). . . 184 11.13 A WFS GetFeature Request on the OGC Web Services of the
The-seus Framework. . . 185 11.14 A WFS GetFeature Response on the OGC Web Services of the
The-seus Framework. . . 186 B.1 The Theseus R2RML Mapping File between an input TSN shapefile
Introduction
1.1
Context
Directives or laws are enacted all around the world to open up data to citizens. Publishing data on the Open Data Web is the most common way to achieve this open data movement. Thus, public institutions in the world are facing the challenge of publishing data on the Open Data Web, on behalf of governments or other political organizations. For instance, the Open Data Directive1 in Europe sets up a legal
framework to make public sector information widely accessible and reusable. Indeed, according to the European Commission, by allowing public sector data to be re-used one can foster the participation of citizens in political and social life and increase the transparency of public policies. Similarly, in Brazil, the Information Access Law2 has been applied by public authorities since it came into force on 16 May 2012. Then, in 7 years, Brazil has experienced a considerable improvement in the volume of information accessible to population. As a consequence, the volume of data coming from the public sector is growing rapidly. Today, more and more political union, or state (or region) in the world has an Open Data Portal in order to centralize data and make it accessible to citizens (e.g., the opendata.swiss portal3,
the U.S. Government’s open data portal4, the European Union Data Portal5, etc.).
The main actors in this process are (National) Statistical Agencies (NSA or SA) and Mapping Agencies which create and disseminate official statistics and geo-graphic information (such as the administrative or electoral boundaries), on behalf of their government, in order to monitor their jurisdictions. For the (N)SAs the Open Data challenge is all the more important that their statistics cover a multi-tude of themes (demographic, economic or environmental, ...), and evolve in time and space, i.e., they are multi-dimensional. Official statistics measure diverse socio-economic or natural phenomena that occur and evolve on these jurisdictions (e.g., demography). The expression geo-coded statistics is used to designate such official territorial statistics, meaning that data refer to a territorial reference system, using alphanumerical codes of geographic areas (e.g., numbers assigned to each area) Eu-rostat [2001]. All these geographic areas are organized by (N)SAs into what is called
1. https://ec.europa.eu/digital-single-market/en/open-data
2. (Law number 12.527 at http://www.planalto.gov.br/ccivil_03/_ato2011-2014/ 2011/lei/l12527.htm
3. https://opendata.swiss/ 4. https://www.data.gov/
a Territorial Statistical Nomenclature (TSN). A Territorial Statistical Nomencla-ture is a set of artifact geographic areas (also called Territorial Units (TU)) built by (N)SAs to observe a given territory at several geographic subdivision levels (e.g., regions, districts, sub-districts levels). Numerous TSNs exist throughout the world. A Territory, in this thesis report, refers to the largest geographic area of the TSN, (that bounds all the others subdivisions), a portion of space (on Earth) well delim-ited. One example of TSN is the Eurostat6 nomenclature, called the Nomenclature
of Territorial Units for Statistics (NUTS)7, that provides four nested divisions of the European Union (EU) territory, for the collection of EU regional statistics: Level 0 corresponds to the division of the European territory into its State members, Level 1 splits each of the States obtained at Level 0 into major Regions, Level 2 divides each major Region of the Level 1 into basic Regions, and Level 3 into small Regions. The concept of TSN is a central topic in this thesis.
Geo-coded statistics are of utmost importance for policy-makers to conduct var-ious analyses, in time and within the space of their jurisdiction. For instance, using data available at two or more periods of time, they can observe the evolution of the unemployment rate in a given administrative region. As a matter of fact, the analysis of territories through the evolution of statistical series over time allows stakehold-ers to be aware of the impact of past policies, to undstakehold-erstand territory at present time, and to better grasp the future [Bernard et al., 2017]. Thus, there is a strong demand from governments, organizations and researchers regarding time-series of official territorial statistics.
However, even if statistical data are available for several points in time, they are often not comparable through time due to changes in concepts (e.g., definition of unemployment), in acquisition methods or in territorial units. This latter aspect is the focus of the thesis. Past geo-coded data cannot be compared to more recent data if the geographic areas observed have changed in the meantime i.e., data collected in different versions of a TSN are not directly comparable because the observed geographic areas are potentially not the same areas anymore. Then, territorial changes lead to broken time-series and are source of misinterpretations of statistics, and statistical biases when not properly documented. Territorial changes are very frequent in Europe (for instance in France, in 2016, administrative regions have been merged into greater regions) or in the U.S.A., as a result of a well-known process called gerrymandering or, more broadly redistricting. They lead to broken statistical time-series because data are collected for and from areas that have changed. This problem, well known as the Change of Support Problem (COSP) [Openshaw and Taylor, 1979; Gotway Crawford and Young, 2005; Howenstine, 1993], describes the phenomenon where data collected in different zonings or versions of a zoning are not comparable due to potential differences between the geographic areas used as supports for the collected data.
As a result of territorial changes, TSNs also change over time: statistical agencies usually update their geographic areas every 1 to 10 years in order to reflect the real 6. The European Statistical Agency that provides official statistics to the NSAs of the European Union member states
world evolution over time. However, the codes of the geographic areas themselves do not necessarily change, even if the areas have changed their name or merged with a neighbor. Then, the main drawback of using such codes for areas lies in their lack of consistency in time and space, as they may designate a region that has changed over time in its boundaries or/and name.
To address this problem, statistical services often transfer former statistical data into the latest version of the TSN. Hence, statistical data sets do not contain traces of territorial changes. However, this non-evolving view hampers a good understand-ing of the territory life itself. Indeed, changes of the areas are not meanunderstand-ingless because they are decided or/and voted by an authority pursuing some objective. Thereby, solutions for representing different versions of the geographic divisions, and their evolution on the Open Data Web are to be proposed in order to en-hance the understanding of the way territories evolve (i.e., which means in this report, understand the way the territories are organized into several geographic ar-eas with neighborhood, governance and genealogy relationships, and understand the way these relationships evolve over time) providing statisticians, researchers, citi-zens with descriptions to comprehend the motivations and the impact of changes on geo-coded data (on electoral results for instance). In fact, providing an explicit representation of territorial changes through times is a prerequisite to a reliable analysis of time-series of statistical data. Therefore, it is crucial to keep and enrich such information about territorial changes with metadata and other resources avail-able on the Web that may contribute to explain the changes (e.g., societal reasons, historical events).
Going back to the open data challenge for the SAs, it should be noted that there are different degrees of data openness, depending on the data format chosen by institutions. While this format determines what can be made with data available on the Web and how they can be linked with other resources available on the Web.
Figure 1.1 – Tim Berners-Lee, the inventor of the Web and Linked Data initiator, suggested a 5-star deployment scheme for Open Data [Hausenblas, 2012].
Tim Berners-Lee, the inventor of the Web and Linked Data initiator, suggested a deployment scheme for Open Data (Figure 1.1) that starts from, at least, the publication of data as PDF data on the Web, then as structured data (e.g., within an Excel file instead of an image scan of a table, so that a computer program may
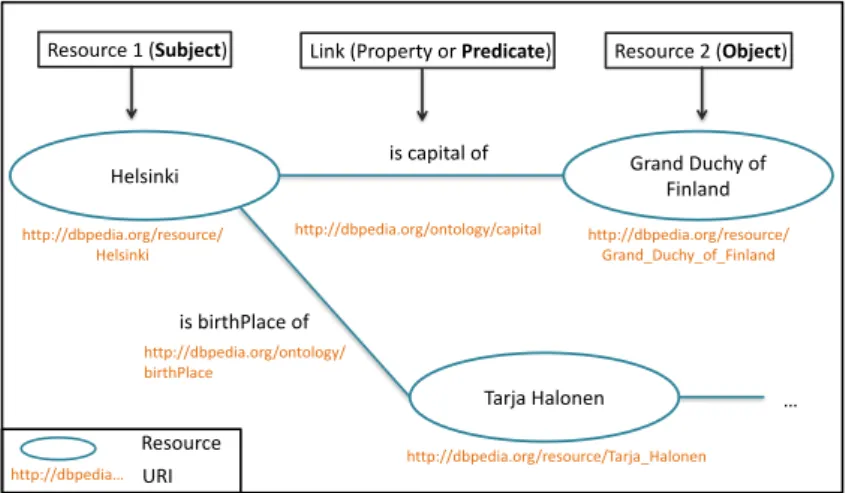
extract the value of each cell). The next step is to make data available but in a non-proprietary format (e.g., comma-separated values instead of Excel). Data reach 4 stars when each of them (e.g., each cell of a table) may be identified uniquely using a Unique Resource Identifier (URI), so that people can point at data using their URI. The Open data process ends when linking each URI with each other i.e., each cell data being identified uniquely by a URI is connected to other data on the Web using a link (also identified by a URI). Indeed, the more data are linked, the more users can discover new facts, by going from one node of the distributed Web graph database to another. Such a linking of two resources on the Web is called a triple (subject-predicate-object) (Figure 1.2). Most of the time, the Resource Description Framework (RDF) standard syntax is used to write these triples, called RDF triples. For instance, from the data resource "Helsinki" identified by the URI http://dbpedia.org/resource/Helsinki on the LOD Web, users discover people born in Helsinki by visiting linked nodes.
Grand Duchy of Finland is capital of http://dbpedia.org/ontology/capital http://dbpedia.org/ontology/ birthPlace is birthPlace of http://dbpedia.org/resource/
Helsinki http://dbpedia.org/resource/Grand_Duchy_of_Finland
http://dbpedia.org/resource/Tarja_Halonen Helsinki Resource 1 (Subject) Link (Property or Predicate) Tarja Halonen … Resource 2 (Object) Resource http://dbpedia… URI
Figure 1.2 – Example of Linked Resources on the Web using URI and the RDF syntax for their identification and representation.
For the (N)SAs, the stakes behind adopting the LOD approach and technologies are crucial because the more contextualized data are (linked to historical, environ-mental information, etc.), and linked to each other, in time and space, the more analyzes carried out on the territories using these data will be multi-criteria, rel-evant and reusable by the policies and researchers. As a matter of fact, the more statistical data are linked together (two statistical indicators8 that describe the
same geographic area could be linked together for instance on the spatial dimension of data), the more analysts may explore correlations, causalities and understand the territory under analysis. So far, (N)SAs share their statistics at the data set level. Then, users have to download the whole data set in order to perform their analysis, 8. According to Eurostat (Source: https://ec.europa.eu/eurostat/statistics-exp lained/index.php/Glossary:Statistical_indicator) "A statistical indicator is the rep-resentation of statistical data for a specified time, place or any other relevant characteristic [...]. It is a summary measure related to a key issue or phenomenon and derived from a series of observed facts. Indicators can be used to reveal relative positions or show positive or negative change..
even if they are interested in only one indicator or one value of the file. Then, (N)SAs are far from disseminating atomic data from which one may automate the process, re-used, or infer new fact from it. Similarly, to address a specific problem, analysts have to download multiple isolated data sets, each of them resolving only a part of the problem.
Using the LOD paradigm, each statistical data set available on the Web may be identified by a URI representing a resource, while each indicator, each data and metadata composing the data set as well: everything being a resource node in the distributed Web graph database. Thus, data sets as LOD are no longer isolated in-stances, they are immersed in the Web as graph(s). They are all interconnected, and at a finer granularity, the indicators and the statistical values can be interconnected as well. Furthermore, LOD technologies foster syntactic interoperability, and most of all semantic interoperability between systems. Indeed, for each data published on the LOD Web, it is necessary to define which set of things – real-world objects, events, situations or abstract notion – it belongs to, by linking it to a concept defin-ing this set. As part of LOD, ontologies are documents that formally define these concepts and their relations [Berners-Lee et al., 2001]. They help both people and machines to communicate, supporting the share of semantics and not only syntax [Maedche and Staab, 2001]. Hence, using RDF triples, the syntax of data is ho-mogenized, data can be transferred from one system to another, and because of the explicit semantic, systems "understand" data they receive and can determine the appropriate process to be applied (e.g., data tagged as geospatial data may auto-matically be displayed on a map). Thus, the term Semantic Web is also used to denote data sets, ontologies and technologies on the LOD Web. More recently the term knowledge graphs emerges to denote graph on the LOD Web containing both data sets and ontologies, bearing formal semantics, which can be used to interpret data and infer new facts [Ontotext, 2018]. A kowledge graph can be envisaged as a network of several data sets and ontologies which are relevant to a specific domain, and on which one can apply a reasoner in order to derive new knowledge [Ehrlinger and Wöß, 2016]. Even if the term is borrowed from a commercial data graph, the Google Knowledge Graph, it is now used to denote also available open graphs, such as DBpedia, YAGO, and Freebase [Paulheim, 2017].
Thus, there are many benefits for (N)SAs in using LOD technologies for their statistics:
– users may navigate from one data set to another; – data and metadata are interlinked;
– systems "understand" the data they receive and can determine the appropriate process to apply to data;
– data are put in context, as they are linked to other resources on the LOD Web; – each statistical indicators and value become addressable;
– using a network of ontologies and data sets, a knowledge graph representing the dynamics of the territories over time may be constructed, combining several statis-tical data sets from various disciplines (e.g., environment, socio-economy, ethology, transports), at different instants in time, observed in different meshes and versions of these meshes. Also historical and political information could be mobilized in order to explain the changes over time, such as the changes in boundaries over time.
From this knowledge graph one can build intelligent tools for the restitution of these very disparate data which, taken as a whole, may help in understanding the complexity of the change phenomenon, and the cascading effect of changes through all levels of the European territory, for instance. These tools might also be able to infer new data (such as the estimation of unemployment values after a redistricting), using a cross-sectoral approach for accurate estimation.
(N)SAs have just started publishing their data on the LOD Web to benefit from all the technologies and ontologies around this new data format. Various initiatives to disseminate Linked Statistical Data emerge throughout the world. For instance, the Aragón Statistical Office Open Data Portal provides LOD statistics on municipalities of the Aragon region of Spain9; the Italian Istat Linked Open
Data Portal10and the e-Stat Japanese Portal11disseminate statistical LOD for the National SAs of Italia and Japan; the European Union (EU) Open Data Portal12
gives access to (L)OD published by EU institutions such as Eurostat that provides official statistics on the European Union territory.
The W3C RDF Data Cube ontology (QB) is widely used to describe these LOD statistics in a way that is compatible with the Statistical Data and Metadata eX-change (SDMX), an ISO standard for exchanging and sharing statistical data and metadata among organizations [Cyganiak and Reynolds, 2014]. Using the QB vo-cabulary, one can publish statistical observations and a set of dimensions that define what the observation applies to: time, gender and geographic areas, for instance. However, the QB ontology does not provide the necessary vocabulary to achieve the description of the geographic areas and of the TSN these areas belong to. TSN levels and TUs have to be described elsewhere, using other ontologies than QB.
The (N)SAs, for their part, often create their own ontology for the description of statistical areas (e.g., the Territorio Ontology13 of the Italian National Institute
for Statistics, the Geography Ontology14 of the Scottish Government), which results into a counterproductive proliferation of non-aligned vocabularies. Consequently, there is no semantic interoperability between TSN data set nowadays.
The spatiotemporal model of Plumejeaud et al. [2011] (created few years ago by researchers of our STeamer LIG group) offers a way to represent hierarchies of geographic divisions used for statistical purposes. The geographic areas that com-pose the TSN are described over time, in relation to their ancestors or descendants. The constructed lineages of areas provide policy-makers with information about the changes of the territory observed over time. However, this conceptual model still needs to be immersed in the LOD world if ones want to address the NSAs today’s challenge with regard to dissemination of data. This still requires, as noticed by the Spatial Data on the Web Working Group15(a group that gathers members from the
9. http://opendata.aragon.es/ 10. http://datiopen.istat.it/index.php?language=eng 11. http://data.e-stat.go.jp/lodw/en 12. http://data.europa.eu/euodp/home 13. http://datiopen.istat.it/odi/ontologia/territorio/ 14. http://statistics.gov.scot/vocabularies/ 15. https://www.w3.org/2015/spatial/wiki/Main_Page
World Wide Web Consortium (W3C) and the Open Geospatial Consortium (OGC), "a significant change of emphasis from traditional Spatial Data Infrastructures (SDI) by adopting a Linked Data approach. " [Tandy et al., 2017].
Regarding TSN spatial data, even if some agencies published their TSN as LOD (i.e., using the RDF syntax), in most cases, TSNs data are available online as ESRI ®shapefiles i.e., an open format for geospatial data. If we refer to the Tim Berner-Lee deployment scheme for Open Data (see Figure 1.1), in the field of TSNs, such a deployment reaches level 3. TSN data are, most of the time, not yet available as Linked (Open) Data.
1.2
Problematic
We focus through this thesis report on the spatial dimension of geo-coded statis-tics, and we try to immerse TSNs on the LOD Web by taking into account the heterogeneity of existing TSNs and their evolving nature. Our work is a continua-tion of the previous work from Plumejeaud [2011] and extend the proposed model and algorithm for TSNs.
Since no ontology in the LOD Web is generic enough to enable the description of any TSN in the world, semantic interoperability of TSNs is not yet achieved though it would foster the exchange of information among SAs in the world, the compar-ison of these statistical areas in the world and the processing of these geo-coded statistics. Similarly, no ontology on the LOD Web enables the description of TSN evolution and changes over time while, by describing TSN changes, one can meet stakeholders’ needs for tools to:
a) geo-visualize changes in boundaries over time and understand the way territo-ries evolve through neighborhood, governance and genealogy relationships [Plume-jeaud et al., 2011], and also through information on the historical, societal or legal contexts when the change occurred;
b) automatically estimate the values of socio-economic indicators in a new geographic division, using a program able to determine the operation (e.g., aggre-gation, disaggregation) to be performed on data according to the nature of the territorial change [Goodchild et al., 1980; Flowerdew, 1991];
c) simulate the evolution of the territory to observe the effect of a redistrict-ing. For instance, the fusion of two municipalities into one may change the average income per capita, then may impact the budget subventions but, in turn, should reduce the cost of waste collection and treatment;
d) compare two territories each other, especially their evolution over time, in order to examine the relevance of following a similar trajectory (in terms of re-composition, extension, etc.) or not.
The fundamental question we address in this thesis report is: How to im-merse in the LOD Web any evolving hierarchy of geographic divisions, used for statistical purpose? How to provide statisticians and researchers with se-mantic descriptions of changes and life lines of evolving hierarchies and geo-spatial entities, paying attention to report on these changes on each of the element composing the hierarchy and on the cascading effects of changes? Secondly, how to interlink these TSNs as LOD and their change descriptions with other data on the LOD Web, towards spatiotemporal knowledge graphs composed of geo-spatial, statistical and historical data, so that experts, but also citizens can explore and exploit these knowledge graphs, cross mul-tiple data to conduct various analyses on many countries, or regions and understand, compare and predict the evolution of these regions?
Building such a knowledge graph implies to overcome four main challenges: (1) to reduce the lack of semantic interoperability between systems for TSNs exchange.
(2) to provide a description of TSNs evolution over time in a way that it helps understanding the reason for the changes, and assists statisticians in the operation of transferring statistical data from one TSN version to another.
(3) to take into account the vertical/hierarchical dimension of TSNs (i.e., made of several embedded geographic divisions) in their evolutions. (4) to populate automatically such a descriptive model of TSNs and of their evolution over time, by preserving its genericity, handling the fact that the characteristics of the TUs identity may vary depending on countries and on the quality of the input TSN data sets.
1.3
Contributions
To meet these challenges, we adopt a descriptive approach for the dynamics of the territories, strongly defended within the community of geo information science [Claramunt and Thériault, 1995; Wachowicz, 2003; Del Mondo et al., 2013; Harbelot et al., 2015]. As far as we know, this is the first time that this approach is used in the context of statistics in order to describe the processes that rule the evolution of areas and of the structures these areas belong to. Thus, we extend these descriptive approaches for the dynamics of the territories by applying them to complex, and multi-level territorial structures. We try to describe the evolution of hierarchical links in the structure over time. Our model is multiscalar and allows to zoom in, zoom out to visualize in a global way the main changes of the structure from one version to another, but also all the sub-changes, including the change of name of the smallest unit of the structure, all elements being interconnected in time and space. We focus on the links between the elements of a TSN (hierarchical links, spatiotem-poral links, filiation links) and the automatic publication of their description on the LOD Web.
Most of the time in statistics, data sets do not contain traces of territorial changes, i.e. the evolution of the areas are lost. While, in our approach, accord-ing to Grasland and Madelin [2006], we no longer consider the Change of Support Problem as a "Problem" but as a "Potential" that provides information about data and territories. Rather than erasing each former version of a TSN, we preserve it together with the new one. Our challenge is then to automatically find:
– What or,
– Who (legal authority) is responsible for the change in boundaries, – Where, and
– When changes have occurred on the territory,
– Why (because of a reform?) the change occurs and above all,
– How entities change (i.e., the nature of the change(s) e.g., a fusion of TUs). Thus, we try to automatically identify, describe and contextualize change events occurring between TSN versions.
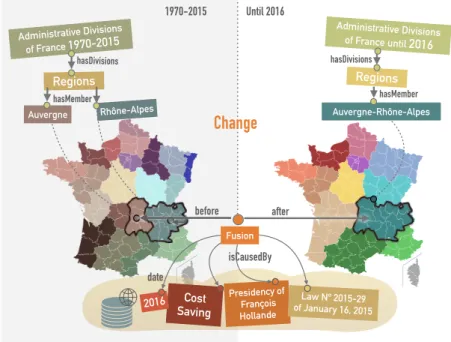
Figure 1.3 below presents, in a simplified way, the kind of RDF graph we intend to obtain automatically. Here, the chosen example takes place in France where a new administrative division of the country into region areas has been officially adopted in January 201516. Fusion Presidency of François Hollande Cost Saving
Change
Law Nº 2015-29 of January 16, 2015 2016 before after Administrative Divisions of France until 2016 hasDivisions Regions Administrative Divisions of France 1970-2015 hasDivisions date Auvergne Rhône-Alpes hasMember Regions hasMember Auvergne-Rhône-Alpes isCausedBy 1970-2015 Until 2016Figure 1.3 – Simplified illustration of the RDF Graph representing territorial changes we want to achieve.
As a first contribution, we present in this thesis report the Theseus Framework we have designed in order to supervise the whole life cycle of evolving TSNs on the 16. Law No 2015-29 of January 16th, 2015 https://www.legifrance.gouv.fr/eli/loi /2015/1/16/INTX1412841L/jo/texte
LOD Web: from the modeling of geographic areas to the exploitation of TSNs (and their successive versions) on the LOD Web. This framework is intended for Statistical Agencies, statisticians, or researchers who wish to publish on the LOD Web successive version of their TSN, as well as change and similarity descriptions between the versions i.e., filiation links between the features throughout the versions. Its main objective is to automate the detection and semantic description of a set of well identified processes (merge, split etc.) that characterize the evolution of TSNs and of all their features (levels, TUs), adopting a multi-level approach for the description of the territorial structure, as well as for the description of the changes that impact the embedded features of TSNs.
As a second contribution, this Theseus framework encapsulates two ontologies we have designed, called TSN-Ontology and TSN-Change Ontology. Their goal is twofold: unambiguous identification of the statistical areas in time and space, and the description of their filiation links (comprising similarity and change descriptions) over time on the Linked Open Data (LOD) Web.
Theseus also embeds an implementation of an extended version of the Algorithm for Automatic Matching of Two TSN Versions of [Plumejeaud, 2011]. This adapta-tion, called the TSN Semantic Matching Algorithm, is our third contribution. It has been designed to automate both the detection and the description on the LOD Web of territorial similarities and changes among various TSNs. Together, all the software modules of the Theseus framework contribute to the publication on the LOD Web of TSNs semantic history graphs. Those latter constitute catalogs of evolving statistical areas that enhance the understanding of dynamics of the territories, providing statisticians, researchers, citizens with descriptions to comprehend the motivations and the impact of changes.
Theseus is then a step towards the generation of knowledge graphs of evolving geo-coded statistics that link several ontologies and data sets: RDF Data Cube data sets, geospatial TSN data sets, (historical) event data sets, law data sets... from which one could build intelligent tools for the analysis of the territorial dy-namics (e.g., analysis the territorial evolution together with demographic, economic, environmental indicators, information on the history of the territories...) . These tools could be capable of inferring new data (such as estimating statistical values in a new TSN version).
1.4
Thesis Outline
In Chapter II, we present in more details the topic of this thesis. We describe the current states of Territorial Statistical Information (TSI), an information made of two peaces: the statistical information (geo-coded statistics), and the geographic areas, organized into Territorial Statistical Nomenclature, used for the collection and dissemination of official territorial statistics. We present the problems caused by the evolution of TSN over time.
In Chapter III, we introduce the main spatiotemporal concepts involved in the mod-eling of evolving spatial entities, the fundamentals for the modmod-eling of these entities,
and the existing approaches in the semantic Web.
In Chapter IV, we present the fundamentals for the spatiotemporal modeling of evolving TUs and TSNs, that are specific spatial entities, with a focus on the ap-proaches implemented in the semantic Web.
In Chapter V, we evaluate the existing methods for automatically generating, then exploiting in the semantic Web, descriptions of evolving TUs (descriptions of their life, filiation and changes over time).
In Chapter VI, we make a synthesis of the state of the art, and we list the require-ments that a system managing the whole life cycle of evolving TSNs in the Semantic Web should meet.
In Chapter VII, we introduce Theseus, a configurable framework designed for man-aging evolving TSNs in the semantic Web, according to a management process that consists of the following activities: Specify, Model, Generate, Publish, and Exploit. In Chapter VIII, we present the main component of Theseus, a ontological model, made of two ontologies, called TSN Ontology and TSN-Change Ontology, designed in order to describe in the semantic Web any TSN hierarchical structure and its changes over time.
In Chapter IX, we describe the two workflows created in order to populate our TSN ontological model. We present, in particular, the TSN Semantic Matching Algo-rithm designed in order to automatically detect and describe, on the LOD Web, similarities and changes of TSN structures throughout their versions.
In Chapter X, we present experiments performed on three very different TSNs in order to evaluate our Theseus Framework and the performances of the TSN Seman-tic Matching Algorithm.
In Chapter XI, we show how to explore and exploit data created by Theseus, in particular how to explore territorial change descriptions and how to exploit them with other data on the LOD Web, such as Linked Open statistical Data.
In the concluding Chapter, we list the main contributions of the thesis. We discuss the limitations of our work that focuses on a specif type of geographic divisions. We present how one could extend our approach, and some perspectives for future work in this respect.
Territorial Statistical Information
In this Chapter, we first describe in more details the current states of Territorial Statistical Information (TSI), an information made of two peaces: statistical (geo-coded statistics, statistics that are spatially referenced), and geographic information (geographic areas used for the collection and dissemination of geo-coded statistics). Second, we define in this Chapter the focus of our research: namely these geo-graphic areas, organized into Territorial Statistical Nomenclature. We focus on the problem caused by their evolution over time.
Please note that most of the concepts presented in this chapter are defined in the TSN Ontology (one of our proposition), available online at http://purl.org /net/tsn#. This ontology is an online glossary associated to this manuscript.
2.1
Current states of Territorial Statistical Information
In this manuscript, we focus on geo-coded statistical data that are aggre-gated data (not point-based data). Indeed, as noticed by [Cheng and Ade-peju, 2014]: "Observations of discrete geographic data are usually made at point locations, but are often aggregated into areal units for various reasons, such as confidentiality of individual records, data summary or to fit into an existing zoning system (e.g., districts, service areas, police beats etc.)." And, as Openshaw [1984] says, for many purposes the zones in a zoning system constitute the basic units for the observation and measurement of spatial phenomena.
2.1.1 Not fully interconnected data
In Plumejeaud [2011], the author highlights the structure of geo-coded statistics that usually comes in the form of data sets. Statistical data sets can be understood in three levels of information:
(1) the data set level,
(2) the level of statistical indicator(s) (e.g., Eurostat’s indicators: People living in jobless households, Early leavers from education and training,...) composing the data set, and
(3) the level of data, which describes the indicator values for each TU, subdivision of a territory.


![Figure 3.6 – Generic behaviour of spatiotemporal objects using the Statechart no- no-tation, from [Renolen, 1997].](https://thumb-eu.123doks.com/thumbv2/123doknet/14591388.730119/77.892.259.590.496.761/figure-generic-behaviour-spatiotemporal-objects-statechart-tation-renolen.webp)
![Figure 3.8 – The story of a land area (above) shown in the history graph notation (below), from [Renolen, 1997].](https://thumb-eu.123doks.com/thumbv2/123doknet/14591388.730119/79.892.230.645.430.734/figure-story-land-shown-history-graph-notation-renolen.webp)
