RESEARCH OUTPUTS / RÉSULTATS DE RECHERCHE
Author(s) - Auteur(s) :
Publication date - Date de publication :
Permanent link - Permalien :
Rights / License - Licence de droit d’auteur :
Bibliothèque Universitaire Moretus Plantin
Institutional Repository - Research Portal
Dépôt Institutionnel - Portail de la Recherche
researchportal.unamur.be
University of Namur
Micro-finance Lifespans: A Study of Attrition and Exclusion in Self-Help Groups in
India
Baland, Jean-Marie; somanathan, rohini; vandewalle, lore
Publication date: 2007
Document Version
Early version, also known as pre-print Link to publication
Citation for pulished version (HARVARD):
Baland, J-M, somanathan, R & vandewalle, L 2007, Micro-finance Lifespans: A Study of Attrition and Exclusion in Self-Help Groups in India: India Policy Forum, 4(1) 159-210..
General rights
Copyright and moral rights for the publications made accessible in the public portal are retained by the authors and/or other copyright owners and it is a condition of accessing publications that users recognise and abide by the legal requirements associated with these rights. • Users may download and print one copy of any publication from the public portal for the purpose of private study or research. • You may not further distribute the material or use it for any profit-making activity or commercial gain
• You may freely distribute the URL identifying the publication in the public portal ?
Take down policy
If you believe that this document breaches copyright please contact us providing details, and we will remove access to the work immediately and investigate your claim.
159 R O H I N I S O M A N A T H A N Delhi School of Economics L O R E V A N D E W A L L E University of Namur
Microfi nance Lifespans: A Study
of Attrition and Exclusion in
Self-Help Groups in India
*
Introduction
M
icrofi nance is often advocated as a solution to multiple social problems. Productive investments fi nanced by loans can bring households out of poverty, reduce income and wealth disparities, and groups can serve as forums for collective action to improve gender relations and local governance. Over the last few years, savings and credit groups have also helped manage some important social programs of the Indian government, such as the distribution of foodgrains and school meals in state-run primary schools.There are two principal institutional forms through which group lending takes place in the microfi nance sector of most countries. In the fi rst, spe-cialized institutions organize potential lenders into groups. Group compos-ition may be determined by random factors, as in the case of FINCA in Peru, or the matching preferences of members as in the case of Grameen Bank.1
These lending institutions are intimately and permanently involved with
* We thank the PRADAN team for many useful discussions and for their support in facilitating data collection; Sandeep Goyal, Sanjay Prasad, Amit Kumar, Rahul Sharan, and Saurabh Singhal for research assistance, and to FUCID (Fondation Universitaire de Cooperation Internationale et de Developpement, Namur,), and the Action de Recherches Concertees program of the French speaking community in Belgium for fi nancial support. The authors would also like to thank Mr Bhupendra Mehta for drafting the maps in this paper.
1. See Karlan (2007) for a description of group operations in FINCA and chapter 4 of Armendariz de Aghion and Morduch (2005) for Grameen Bank lending practices.
their members—they form groups, set interest rates and fi nes, and their re-presentatives are usually present in group meetings.
An alternative model is one in which several loosely connected institu-tions are involved with a given group of borrowers. Government and non-government agencies form credit groups, the groups determine their own rules for saving and lending, and some of these groups subsequently borrow from commercial banks. Microcredit is just a fraction of the loan portfolio of these banks who see it as a way of meeting their social responsibilities. This is the dominant institutional form in Indian microfi nance, in terms of both outreach and total loan disbursements.
The present structure of the microfi nance sector in India emerged in the early 1990s when the Reserve Bank of India (RBI) issued guidelines to nationalized commercial banks encouraging them to lend to informal self-help groups (SHGs). Since then, such groups have been actively promoted by a number of different agencies and the National Bank for Agriculture and Rural Development (NABARD) has provided banks with subsidized credit for lending to SHGs.2 Offi cial statistics currently report over two and a half
million groups and 32 million households in them.3 Most of these groups
are composed entirely of women (NABARD, 2006:38).
In spite of the phenomenal growth in the number of SHGs and total loans advanced to them, there is little systematic evidence on their internal functioning. In part, this is due to the nature of governance within the sec-tor. Statistics on Indian SHGs have emerged because the organizations promoting these groups provide their donors an account of the number of new groups created and because commercial banks are required to report their lending to the Reserve Bank. In neither case are details on the uses of funds or their distribution within a group reported. We therefore know little about group demographics, about whether groups, once formed, continue to function effectively or how many members leave groups that they initially joined. This paper attempts to fi ll this informational gap by using survey data on SHGs created during the period 1998–2006. We describe the survival of groups and members within groups, document group activities, and estimate the determinants of group and member duration using an econometric survival model.
Our data come from a survey of 1,102 rural SHGs and the 16,800 women who were members of these groups at some point during the period 1998– 2006. We consider all groups formed by PRADAN, [a non-government
2. See Reserve Bank of India (1991) and National Bank for Agriculture and Rural Development (1992) for the original policy statements.
organization (NGO) that has actively promoted SHGs since the start of the NABARD program] in the districts of Keonjhar and Mayurbhanj in northern Orissa and Raigarh district in the newly formed state of Chhattisgarh in central India. Groups are engaged in a variety of collective activities but saving and credit does seem the most important.3 Almost all groups we
sur-veyed had made small loans to their members and 68 percent of them had received at least one loan from a commercial bank. Each borrower re-ceived about Rs. 2,200 per year from internal group funds. For groups with at least one bank linkage, 83 percent of members in the group received some part of this loan and the average amount received by these members was Rs. 2,189 per year.4 Although loans provided by some specialized
micro-fi nance institutions are often larger, these SHG loans are sizable as a fraction of local earnings and, for women who received both group loans and banks loans, total borrowing from these two sources corresponds to roughly two months of labor earnings at the minimum wage in these areas.5
The Groups do undertake activities not directly related to credit. About 10 percent were involved in the preparation of school meals, 3 percent ad-ministered state programs to distribute subsidized foodgrains and about half of them had, at some point, been involved in resolving family or village confl icts. They also frequently reported helping members during periods of personal distress. These groups therefore seem to play a role in promoting solidarity networks in the community. The data we have collected so far do not allow us to investigate these activities in much detail. In terms of the fractions of groups and members involved however, they appear secondary.
We estimate models of both group and member duration and fi nd that factors behind group survival are quite different from those affecting mem-ber longevity. The maximum level of education in the group is important for its survival, perhaps because some educated members are needed to facilitate transactions and ensure that group accounts are accurate. The presence of other SHGs in the same village also has a positive effect on the duration. It may be that a dense cluster of groups allows for the sharing of
3. See Table 8.
4. Our survey did not explicitly ask members about the bank credit received each year. This number has therefore been computed using the total amount received by members from bank sources and dividing it by the number of years that the group has been active since fi rst bank linkage.
5. The minimum wages for each sector are determined by the Indian states under the Minimum Wages Act, 1948. The Central Government issues guidelines regarding these and currently recommends a fl oor of Rs. 66 per day. Agricultural workers who are privately employed typically receive about two-thirds of this amount.
costs and ideas or instills in members the desire to survive, compete, and be part of a larger network.
Based on a large literature that points to the importance of social heterogeneity in collective action, we explore whether such heterogeneity matters for the average duration of groups and of members within groups. For each surveyed member, we recorded both their individual caste or jati and the offi cial category to which this caste belongs. Our fractionalization measures are a function of the shares of group members that belong to each caste. There are over a hundred different castes in our surveyed area and all four of the offi cial categories are present—the Scheduled Tribes (ST), Scheduled Castes (SC), Other Backward Classes (OBC), and the residual category of Forward Castes (FC). We fi nd that commonly used measures of fractionalization and social heterogeneity based on these classifi cations do not have systematic effects on group survival but they do explain the de-parture of individuals from groups. Heterogeneity matters even within broad caste categories, suggesting that the offi cial classifi cation fails to fully capture the relevant social hierarchy. Members from traditionally disad-vantaged groups, especially poor communities within the ST, are the most vulnerable to group heterogeneity. In addition to heterogeneity, lower levels of education, smaller landholdings and the absence of relatives within the group are all associated with greater exit of member. We fi nd that most of the differences in the duration of membership within a group between Chhattisgarh and Orissa can be attributed to characteristics of groups in these areas and regional variations in duration are negligible once these characteristics are incorporated into our model.
Our results suggest that it is problematic to evaluate the success of micro-fi nance interventions based on conventionally reported coverage micro-fi gures be-cause these fi gures do not adequately account for attrition. The formation of groups is much better recorded in offi cial data than their closure and groups, rather than their members, are the unit of analysis. As a result, estimates of microfi nance outreach are infl ated because they are based on the initial and not the actual membership of SHGs.
One might argue that the attrition rates observed in our data are not particularly high compared with many government programs. Even groups that are no longer active functioned for a little over two years and members that left functioning groups stayed for an average of one and a half years. Besides, even if attrition rates were higher, it would be diffi cult to derive their welfare implications without more information on the types of credit contracts that these members have access to upon leaving their group. It is
possible, and perhaps desirable, that SHGs are an intermediate stage in the process of fi nancial integration of these households and that members leave groups when individual contracts with formal fi nancial institutions become sustainable.
We fi nd, however, that attrition rates are systematically related to meas-ures of social disadvantage. It is predominantly the poorer and socially marginalized communities that leave the SHG network, and this makes it unlikely that women moving out of SHGs enter individual contracts with lending institutions. It also means that some of those in desperate need of credit cannot obtain it from within this sector. An additional concern is that lending by commercial banks to SHGs is considered priority sector lending by the banking system and may therefore crowd out other lending. Disbursements by commercial banks to SHGs were 29 percent of all direct bank credit to small farmers in 2004–05 and SHG credit has been rapidly rising since.6
To arrive at concrete policy prescriptions for this sector, more informa-tion is needed about the fi nancial opportunities available to members once they leave this sector and the extent to which SHG lending substitutes for other types of lending to the poor. Although the duration of membership is only one, admittedly crude, measure of the performance of the microfi nance sector, our study suggests that survey data on the histories of members and groups in this sector is critical to an assessment of Indian microfi nance.
We provide a brief institutional history of the microfi nance sector in India in Section 2. Our survey data, some summary statistics, and empirical methods are described in Sections 3 and 4 respectively. Results are pre-sented in Section 5 and are followed by some refl ections on their implica-tions for policy.
Microfi nance Institutions in India
Many detailed accounts on the history of rural banking in India are avail-able. The All India Rural Credit Survey in 1954 was the fi rst major study of household access to credit. It found that the rural poor were heavily
6. The loan disbursements to farmers with less than 2.5 acres of land were Rs. 10,833 crore in 2004–05 while SHG linked loans increased by Rs. 2,994 crore over the same period (RBI, 2007, tables 59 and 72).
indebted and had very limited access to bank.7 As part of a process aimed
at providing banking services to this population, the State Bank of India was set up in 1955, the 14 largest commercial banks were nationalized in 1969, and the NABARD was created in 1982. Each nationalized bank was designated a lead bank for a particular state and these banks were required to maintain specifi c ratios of urban to rural branches in their state. As a result of these policies, a vast network comprising thousands of credit cooper-atives and regional rural banks was created. There is some evidence that this expansion reduced regional poverty (Burgess and Pande, 2005), but it was accompanied by operating costs and default rates that were too high to be sustainable. Moreover, the reliance on informal credit sources persisted among the very poor.
In the early 1990s central bankers tried to revitalize this elaborate and largely ineffi cient banking system. The start of institutionalized microfi nance in India is often attributed to the circular that was issued by the Reserve Bank to all nationalized commercial banks in 1991, announcing the objective of linking informal groups of rural poor with these banks. Some NGOs at the time had organized women into groups that used their pooled savings for mutual insurance and small credit needs. Based on studies of these informal groups, it was believed that they had the “potential to bring together the for-mal banking structure and the rural poor for mutual benefi t” (RBI, 1991). The following year NABARD launched a pilot project that linked 500 groups with commercial banks. The banks were offered fi nance from NABARD for such lending at the rate of 6.5 percent per annum. It was recommended that banks either lend directly to groups at 11.5 percent per annum or route their loans through voluntary agencies at the lower rate of 8.5 percent in order to cover the transaction costs of these agencies (NABARD, 1992). Banks were also permitted to classify such lending under Advances to Weaker Sections, and this category has historically accounted for a large fraction of their unprofi table loans.
Another major change came in April 1999, with the launching of the Swarnajayanti Gram Swarozgar Yojana, popularly known as the SGSY (RBI, 1999). This program was introduced to increase the membership of SHGs among families living below the poverty line. The introduction of the SGSY refl ected a signifi cant change in state policy by directly subsidizing borrowers (as only part of the initial loan had to be repaid) and by restrict-ing the composition of a group to families livrestrict-ing below the poverty line.
7. See, for example, Bell (1990) for summary statistics on rural borrowing and indebted-ness based on rural credit surveys and Karmakar (1999) for recent fi gures on the numbers of different types of rural banking institutions.
Subject to caps, the rates of subsidy were 50 percent for borrowers from the SC and ST and 30 percent for other poor households. A proper evaluation of the changes that the SGSY brought about in the composition and performance of SHGs is yet to be undertaken.8
The NABARD pilot program of 1992 was widely regarded as successful. As seen in table 1, the number of SHGs linked to the banking system has been rising rapidly over the last 15 years and is currently over 2.5 million. Over the past few years, alternative models of lending have appeared and private banks have also entered the sector. However, in spite of the rapid growth of specialized microfi nance institutions (MFIs) in India, they are estimated to cover only about one-half the number of households covered by SHGs.9
This contrasts sharply with countries such as Bangladesh and Indonesia, where each of the major MFI is, in proportional terms, larger than the com-bined non-SHG sector in India (RBI, 2005); Basu and Srivastava, 2005).
T A B L E 1 . Cumulated Bank Linkages, 1992–2007
Year (end-March) No. of SHGs linked Bank loans (Rs. crore)
1992–93 255 0.29 1993–94 620 0.65 1994–95 2,122 2 1995–96 4,757 6 1996–97 8,598 12 1997–98 14,317 24 1998–99 32,995 57 1999–2000 114,775 193 2000–01 263,825 480 2001–02 461,478 1,026 2002–03 717,360 2,048 2003–04 1,079,091 3,904 2004–05 1,618,456 6,898 2005–06a 2,238,565 11,397 2006–07 b 2,580,000 14,479
Sources: Figures from 1992–2005 have been taken from RBI (2006) and RBI (2007). Note: a. provisional estimates; b. up to end February 2007.
8. Our own surveys indicate that the combination of restrictions of group composition and subsidies may have been a factor causing the closure of some groups. Surveyed groups were asked about whether or not they received a subsidy. Although very few of the subsidized groups failed, other groups sometimes cited their exclusion from state subsidies as a reason for the failure of their group. In some cases, a few members were excluded from the group by the others because they were not on government poverty lists and the group was required to have a certain fraction of their members on these lists in order to be eligible for SGSY subsidies.
9. Ghate (2007, p. 17) estimates that about 14 million households are served by SHGs and 7.3 million by MFIs.
The dominance of SHGs in Indian microfi nance appears to have re-sulted from the combined presence of a vibrant non-government sector engaged in rural development and an extensive but unprofi table network of rural banks and agricultural cooperatives that were created with the ex-plicit purpose of providing small loans to the rural poor10 Policy makers may
have been impressed by the phenomenal expansion in the outreach of MFIs like the Grameen Bank in Bangladesh and other countries. The Grameen Bank alone, starting from a humble beginning, had reached almost a quarter of all Bangladeshi villages by 1991.11 The linking of banks with SHGs was
a creative approach that harnessed existing investments in rural banking to rapidly increase outreach among the poor and gave India its own particular brand of microfi nance.
Data
Our data comes from a survey of all of the 1,102 SHGs created by PRADAN in two of its fi eld locations, one in northern Orissa and the other in central Chhattisgarh. We collected information on the history of every group formed since the start of the program in these areas and on each of the 16,800 women who, at any stage, had been members of these groups. Our group-level sur-vey records all loans taken by the group from commercial banks, rules on interest rates, fi nes and repayment, and a summary of the production and social activities undertaken collectively by group members over the year pre-ceding the survey. Through member interviews we obtained their social and economic characteristics, and their borrowings from internal and bank sources. In the few instances in which current or former members of a group could not be traced at the time of the survey, we relied on other informed respondents. We begin this section with a brief outline of PRADAN’s micro-fi nance program. This is followed by a description of our survey methodology and some descriptive statistics on groups and members.
The PRADAN SHG Program
The fi rst SHG formed by PRADAN was in Alwar, Rajasthan in 1987. In subsequent years, the program expanded in several states in central India:
10. Harper (2002) provides some additional reasons for why SHGs rather than Grameen type institutions are more successful in the Indian context.
11. This proportion is based on fi gures for the total number of Bangladeshi villages pub-lished by the Bangladesh Bureau of Statistics (www.bbs.gov.bd) and the number covered by the Grameen Bank (available at www.grameen-info.org).
Jharkhand, West Bengal, Madhya Pradesh, Orissa, and Chhattisgarh. Table 2 provides a list of PRADAN locations in each of the six states in which the organization operates, together with the year of the fi rst SHG and the total number of SHGs in existence at the end of March 2006.12
T A B L E 2 . Number of PRADAN SHGs in India (As on March 31, 2006)
State Location Yeara First SHG # SHGs
Chhattisgarh Raigarh 1998 1999 532
Jharkhand Godda 1987 1989 314
Jharkhand Barhi 1992 1992 411
Jharkhand Lohardaga 1992 1995 449
Jharkhand West Singhbhum 1992 1996 363
Jharkhand Gumla 1994 1994 484
Jharkhand Dumka 1995 1989 318
Jharkhand East Singhbhum 1997 1996 392
Jharkhand Khunti 2000 1997 314 Jharkhand Koderma 2000 1992 359 Jharkhand Petarbar 2000 1998 322 Jharkhand Deogarh 2002 1989 280 Rajasthan Dausa 1999 1999 171 Rajasthan Dholpur 1999 2000 180
Madhya Pradesh Kesla 1986 1996 300 Madhya Pradesh Vidisha 2000 2000 44 Madhya Pradesh Sidhi 2002 2005 49 Madhya Pradesh Dindori 2005 2005 110
Orissa Keonjhar 1990 1998 506
Orissa Balliguda 2001 2001 201
Rajasthan Alwar 1986 1987 162
West Bengal Purulia 1987 1995 218 West Bengal Bankura 2005 2000 142
Total 6621
Source: Personal communication with PRADAN.
a. This refers to the year in which a PRADAN office was opened in the area. The Deogarh and Dumka SHGs were initially under the Godda office and the Koderma and Peterbar SHGs were managed by the Barhi office. This is why the first SHG in these areas predates the opening of the PRADAN branch office.
The groups formed by PRADAN are a small fraction of the total num-ber of SHGs in the microfi nance sector, but they have an important pre-sence in the areas in which they operate. The program targets administrative blocks with high levels of rural poverty and proceeds by building a dense net-work of SHGs in these areas over a few years. In recent years, SHGs have been the fi rst intervention by the organization in each village and group meetings have then been used to introduce other activities aimed at rais-ing agricultural productivity and rural incomes. The social composition of
these villages is often different from other parts of the state and district; the proportion of communities classifi ed as ST is higher and literacy rates are lower than the state average.
The groups themselves consist entirely of women and are formed according to the guidelines issued by NABARD and the Reserve Bank (RBI, 1999; NABARD, 1992). Each group has between 10 and 25 mem-bers and large villages often have multiple groups, one in each hamlet. The PRADAN professionals begin the process of group formation by meeting village women in a public space in the village. They discuss the benefi ts of membership and some general principles followed by successful groups (for example, compulsory attendance, weekly savings, sustainable interest rates, bookkeeping, and so on). Interested women are enlisted and a regular meeting time is set. A professional is usually present at meetings until mem-bership becomes fairly stable and all members are familiar with group prac-tices. Each group is provided with a register for keeping accounts and a cash box, and the group designates either designates one of the members to keep accounts or hires an accountant. The register, cash box, and keys are usually rotated among the members.
As groups mature, they get federated and select representatives who regularly attend cluster meetings organized by the federation. The groups that function smoothly typically open a savings account with a nearby commercial bank within a year of their inception. At this stage, PRADAN professionals discuss the feasibility of alternative self-employment pro-jects with the group, and, once a few members decide on particular propro-jects, the group applies for loan to a commercial bank. This loan constitutes their fi rst bank linkage. Bank funds come into the group and are then are lent to individual members. These members make payments to the group, which then repays the bank on the stipulated date.
Over time, the professionals who initiated the group withdraw and their interactions with members are limited to cluster meetings and occasional visits to the village. Regular communication with PRADAN takes place mainly through copies of weekly accounting transactions that are sent in to the local offi ce. Groups are free to determine the rules under which they operate and the stringency with which they are implemented. After the in-ception of the SGSY in 1999, some subsidies to groups are routed through PRADAN, provided the groups satisfy the selection criteria required by the scheme. Therefore both subsidized and unsubsidized SHGs co-exist in the same area.
In the absence of regular visits to older SHGs, the organizations pro-moting these groups are not always informed about their functioning. Suc-cessful groups may stop sending in accounts as they reduce their reliance on
PRADAN, others may temporarily suspend meetings because some mem-bers migrate seasonally, and yet others may stop their activities altogether. Survey data is therefore required to accurately track the performance of groups over time.
The Survey Design
As mentioned above, we surveyed all PRADAN groups created in the dis-tricts of Keonjhar and Mayurbhanj in northern Orissa and the district of Raigarh in eastern Chhattisgarh. Both the districts in Orissa are serviced by the professionals in Keonjhar and we henceforth refer to these groups as the Keonjhar SHGs. The three survey districts are shown in fi gure 1 and surveyed areas within each district are indicated in fi gures 2–4. Although only a small fraction of each district is actually covered by the program, groups are geographically clustered in dense pockets. This makes it easier for professionals to visit these areas and it also allows groups to benefi t from frequent contact with each other.13
In our analysis, we refer to a group as inactive if the group has not held any meetings over the three months prior to the survey and if its members declare that they have no plans to meet in the future. A group is considered as active if it is meeting regularly at the time of the survey. All women who left groups while the group was still functioning are called past members and the others are referred to as present members. This category therefore includes women in inactive groups if they remained with the group until its last meeting.14
At the group level we collected data on rules, activities, and the timing of some signifi cant events. These events include the inception of the SHG, the creation of savings accounts, bank loans, the group’s membership in an SHG federation, and, for inactive SHGs, their last meeting. Group rules include fi nes (for attendance and late repayment), minimum savings require-ments, interest rates, and the assignment of group responsibilities. We asked group members about their collective activities such as the involvement of its members in resolving village and family confl icts, their visits to government offi cials, and their administration of state-funded school meal programs in primary schools. We also recorded the total number of other SHGs formed by PRADAN in the same village.
13. Some of these benefi ts are studied by Nair (2005).
14. Our main reason for using this classifi cation is that we would like to distinguish between members who left existing groups and those whose membership ended because the group became inactive. It is likely that the factors underlying these two types of events are different. We intend to explore these differences more carefully in future research.
F I G U R E 1 . Study Area Madhya Pradesh Maharashtra Andhra Pradesh Legend State Boundary STUDY DISTRICTS Chhattisgarh Orissa Uttar Pradesh Jharkhand West Bengal Keonjhar Raigarh Mayurbhanj N
Source: Census of India.
For all present and past members, we collected information on a stand-ard set of characteristics relating to their social and economic background: caste, education, age, marital status, fertility, household landholdings, and some parental information. Our data on caste includes both the jati of each member and the offi cial caste category to which the jati belongs. We classify a group as homogenous if all its members belong to the same jati. For each
F I G U R E 2 . Raigarh District Boundary Tahsil Boundary Railway Line Road River Places
Sample Survey Location PRADAN Location : Raigarh Block: Raigarh PRADAN Sub-Location : Tamnar Block: Tamnar Dharmjaygarh Khargaon Tolonga Tariakela Gharghoda Kharsia RAIGARH Sarangarh Balamkela N Legend
F I G U R E 3 . Keonjhar Parsora Palasponga Keonjhargarh Dhenkikot Ghatgaon Kantalai Deogaon District Boundary Tahsil Boundary Railway Line Road River Places
Sample Survey Location
Legend PRADAN Sub-Location : Keonjhar Block: Keonjhar Sadar+Banspal PRADAN Sub-Location : Turumunga Block: Patana N
F I G U R E 4 . Mayurbhanj
Bahalda Kuchaibura
Damribera Asana
Bodo Raruan Joshipur
Bangriposi Bovinathpur BARIPADA Karanjia Kendumundi Thakurmunda Kaptipada Chitarda Betnoti PRADAN Location : Karanjia Block: Karanjia+Thakurmunda +Sukuruli Legend N District Boundary Tahsil Boundary Railway Line Road River Places
Sample Survey Location Source: Census of India.
member and for each accountant, we recorded their dates of entering and, if applicable, leaving the group, and the total value of loans taken by them. We also created a relationship matrix, which recorded family ties between members. For inactive groups, we asked members the main reason for group failure and recorded the most popular response. Similarly, we asked past members the main reason for their departure from a group.
Descriptive Statistics
Table 3 provides a chronology of the formation of SHGs in our study area. The survey in Keonjhar was conducted during the summer of 2006 and the Raigarh survey was in January 2007. In each case, we surveyed all groups created in the area from the start of the program until the date of our sur-vey. This gives us a total of 1,102 groups created in the period 1998–2006. Of these 10 percent were inactive by the time of the survey (12 percent in Raigarh and 9 percent in Keonjhar).
T A B L E 3 . Year-wise Formation and Dissolution of SHGs Survey Data, 1998–2006
Started Inactive Bank loan Year Keonjhar Raigarh Keonjhar Raigarh Keonjhar Raigarh
1998 4 0 0 0 0 0 1999 10 18 0 0 0 0 2000 51 61 0 0 0 3 2001 27 36 3 5 2 7 2002 155 30 4 5 14 23 2003 89 46 11 7 100 31 2004 95 172 9 8 95 100 2005 85 160 17 24 89 140 2006 16 47 2 20 62 91 Totala 532 570 46 69 362 395
Source: Survey Data, 1998–2006.
Note: a. There are two main reasons why the totals in this table do not match with those in table 2. First, we included all groups that were formed before the survey date, and some of these were created after March 2006. Second, table 2 is based on administrative data that do not always account for group failures since these are not consistently reported.
Table 4 contains descriptive statistics on groups by their survival status. A comparison of the two types of groups throws up some interesting pat-terns. First, active and currently inactive groups are both reasonably long-lived with inactive groups operating for an average of two years after they are formed. Second, there are many more homogenous groups in Keonjhar in both categories and these groups as a whole have lower survival rates. This pattern is driven by groups composed of ST, who form a majority of our surveyed population, and it does not hold systematically for the other caste categories. Since we have defi ned a homogenous group as one in which all women are of the same tribe or caste, the lower survival rates refl ect in part lower levels of education among some tribal communities, which make it hard to sustain a group. We discuss this issue in detail in Section 5. Third, groups that survive are more involved in the village activities and in the lives
T A B L E 4 . Group Characteristics by Survival Status
Keonjhar Raigarh Active Inactive Active Inactive
Number of groups 486 46 501 69
Percentage (91) (9) (88) (12)
Average duration (days) 1105 884 1129 620 COMPOSITION
Total number of castes in dataset 88 22 96 45 Average number of castes 2.4 1.8 4.0 3.4 Average number of caste categories
(ST, SC, OBC, FC) 1.8 1.3 2.3 2.2 Fractionalization index 0.26 0.17 0.51 0.46 HOMOGENOUS GROUPS (%) 34.8 52.2 10.2 13.0 ST (% of homogenous) 68.6 91.6 60.8 66.7 SC (% of homogenous) 8.9 4.2 19.6 33.3 OBC (% of homogenous) 22.5 4.2 17.7 0 FC (% of homogenous) 0 0 1.9 0
GROUP ACTIVITIES LAST YEAR
Midday meals (%) 9 0 12 1
PDS (%) 3 0 4 0
Panchayat meetings (%) 34 22 56 35
Exposure trips (%) 70 41 13 6
Federation meetings (%) 12 2 2 0 Meeting government officials (%) 20 7 32 16 Involvement in family or village conflict or
member in distress (%)
44 26 52 26
RULES
Minimum weekly saving (%) 100 100 94 96 Saving compulsory (%) 30 20 38 39 Groups with absence fines (%) 97 67 38 26 Absence fine (Rs.) 3.1 2.6 3.8 3.2 Higher interest rates default (%) 15 13 92 91 OTHER CHARACTERISTICS
Received a subsidy (%) 14 0 5 1 Developed a group project (%) 34 9 26 6 Accountant is a member (% of accts) 68 41 59 62 MEMBERS
Average number of members 16 15 15 15
Past member (%) 13 14 15 14
Literate (%) 33 12 29 25
No school (%) 59 87 64 70
Maximum education (years) 9 5 8 7 Mean education (years) 2.8 1.0 2.0 1.6 Mean land (Acres) 1.7 1.4 2.0 1.9
of their members. They are more likely to administer government schemes, meet government offi cials, attend cluster meetings, go on exposure trips or-ganized by PRADAN to observe projects in other villages, and get involved in resolving family and village confl icts. In terms of their demographic char-acteristics, members of active groups are, on average, more educated, they own more land, and more of them act as accountants for their group.15
Differences in group size are negligible.
Table 5 compares present and past members, homogenous caste groups retain a slightly higher proportion of their members. Demographic char-acteristics of past and present members are similar. Members who eventually
T A B L E 5 . Characteristics of Present and Past Members
Keonjhar Raigarh
Present Past All Present Past All
Number of women 7473 1116 8589 6995 1216 8211
(%) (87) (13) (100) (85) (15) (100)
Average duration (days) 1002 491 936 1071 542 993 CASTE CATEGORY COMPOSITION
ST (%) 60.8 62.0 61.0 46.7 52.2 47.5 SC (%) 10.6 10.9 10.6 19.3 23.0 19.8 OBC (%) 27.1 25.8 26.9 32.1 23.0 30.8
FC (%) 1.5 1.3 1.5 1.9 1.8 1.9
BACKGROUND
Education (number of years) 2.7 2.5 2.7 1.9 1.6 1.9 No school (%) 61 65 61 65 68 65 Read and write (%) 31 29 31 30 24 29 Father’s education (number of years) 2.2 1.5 2.1 2.1 1.3 2.0 Land (acres) 1.7 1.7 1.7 2.0 1.8 2.0 RELATION TO GROUP
Relatives within group (%)a 12.0 7.6 11.4 8.2 5.8 7.8
In homogenous groups (%) 35.3 32.3 34.9 9.8 7.3 9.4 Previous SHG membership (%) 4.4 9.0 5.0 5.7 6.5 5.8 Joined other SHG after leaving (%) 20.4 18.3 CHAIRMANb
membership < 2 years (%) 5.6 0.49 4.7 8.5 3.2 7.1 2 years < membership < 4 year (%) 7.7 3.3 7.3 9.1 3.7 8.7 4 year < membership (%) 8.3 0 8.1 8.7 5.8 8.5
Source: Survey Data, 1998–2006.
Note: a. Percentage of members who have at least one relative in their group.
b. Percentage of members who have been chairman, given the duration of their membership.
15. The average member characteristics for both types of groups are calculated using all members that were ever part of the group.
T A B L E 6 . Distribution of SHG Members by Caste Keonjhar Raigarh ST 5231 3878 (%) (61) (47) SC 916 1616 (%) (10) (20) BC 2397 2512 (%) (27) (31) FC 124 157 (%) (2) (2) SCHEDULED TRIBESa Bhuiyans 1127 203 Kharia 15 466 Ho 444 5 Munda 533 12 Santhals 501 0 Bathundi 811 0 Gond 432 620 Ganda 375 127 SCHEDULED CASTES Harijans 421 11 Chauhan 0 886
OTHER BACKWARD CASTES
Yadav 5 697
Mahanta 823 99
Kurmi 493 14
Teli 95 497
Source: Survey Data, 1998–2006.
Note: a. Only the largest groups are reported here.
leave have fewer years of education and a smaller fraction of them are literate, but these differences are not large. A striking contrast between those who remain in SHGs and those who leave is seen in the networks these women have within their groups and in the extent to which they are responsible for group decisions. In Keonjhar, 12 percent of women currently in groups had another relative in the groupwhile this was true of only 7.6 percent of past members, and those who stayed in their groups were at least twice as likely to have held the position of group chairman, conditional on the number of days spent in the group. Table 6 shows the distribution of present and past SHG members across the major caste groups in the area. We use these groups in our empirical analysis in the next section and investigate whether the durability of SHGs varies by community.
A variety of reasons were cited by respondents for group inactivity and exit of members from the groups. The principal responses are shown in table 7. We asked former members of inactive groups for their assessment
T A B L E 7 . Stated Reasons for Group Failure and Member Exit
Keonjhar Raigarh
GROUP
PRADAN withdrew support 18.2 11.8
Personal conflicts/leadership problems/accountant problems 45.5 38.2 Unpaid loans/irregular savings 27.3 25.0
Others 9.0 25.0 Total 100 100 Number of observations 46 69 MEMBER PERSONAL REASONS Illness/death 8.3 8.1
Left village/married/seasonal migration/going to school 17.8 12.0 RELATED TO GROUP
The family was not supportive 6.2 9.1 Could not reimburse a loan taken/difficulty in saving 29.2 17.1 Could not attend the meetings 9.8 12.8 Personal conflict with the group 15.5 20.3
Excluded by the group 4.9 1.0
OTHERS
Wanted to join another group 0.5 6.5
Othersa 7.8 13.1
TOTAL 100 100
Number of observations 1116 1216
Source: Survey Data, 1998–2006.
Note: a. Others includes not understanding the working of the SHG,PRADAN official stopped visiting the group, the group is too big, and no clear reason.
of why the group stopped functioning. In both regions, problems of leader-ship and confl ict turned out to be the most important (40 percent) followed by low savings and repayment rates. The stated reasons for member de-partures vary by region. Diffi culties in saving and reimbursement are most important in Keonjhar while personal confl icts matter more in Raigarh. These responses are not surprising given the higher levels of education of departing members in Raigarh and the greater social heterogeneity of their groups. Between one quarter and afi fth of all members who have left cite personal reasons, which often involve leaving their village.
The borrowing and lending activities of groups are summarized in table 8. Almost all active groups provided their members with loans from internal funds in the year prior to the survey and a fairly high fraction of members received such loans (87 percent in Keonjhar and 63 percent in Raigarh). Borrowing members of active groups received an average of between two and three loans during the year prior to the survey and they
T A B L E 8 .
Borrowing and Lending Activities of Groups
Keonjhar Raigarh Active Inactive All Active Inactive All
GROUP LOANS Lending from internal funds (%)
100 91 99 96 30 88
Members receiving loans (%)
88 14 78 63 10 55
Loans per member last year
(#) 3.1 2.4 3.1 2.1 2.1 2.1
Borrowing per member last year (Rs.)
a 2,792 1,831 2,769 1,320 1,024 1,312 2,220
BANK LINKAGES At least one bank linkage Total groups (%)
74 15 69 74 23 68 Number of linkages (#) 1.7 1.0 1.7 1.8 1.3 1.8
Total bank borrowing (Rs.)
46,555 13,500 45,924 52,206 23,571 50,958 48,518
Members receiving bank funds (%)
77 89 78 89 84 90
Loans per borrowing member (Rs.)
4,222 984 4,150 4,154 1,488 4,070 4,108
Duration of group since first linkage (days)
613 318 607 768 526 759
Exactly one bank linkage Total groups (%)
52 100 53 38 75 40
Average loan size per member (Rs.)
2,386 1,979 2,375 1,303 512 1,285 2,039
Members who received part of loan (%)
88 61 87 59 18 56
Source: Survey Data, 1998–2006. Note: a. For loans and borrowings, last year refers to the year before the survey for members of active groups. For inactive gr
oups it is the last year for which they were active.
borrowed an average of Rs. 2,298 from the group. For inactive groups, we recorded lending activities during the last year of their regular functioning. Most of these groups in Keonjhar did lend out internal funds while less than one-third of the inactive Raigarh groups were engaged in such lending dur-ing the last year in which these groups were active. In both cases, access to these loans was very uneven and less than 15 percent of members received such loans. Those who did borrow received sizable amounts of, on an aver-age, Rs. 1,831 in Keonjhar and Rs. 1,024 in Raigarh. It is plausible that this uneven distribution of group funds may have led to the high levels of group confl ict reported by members of inactive groups.
Nearly three-quarters of active groups in both areas have been linked with commercial banks. Linked SHGs have received an average of 1.7 bank loans and average total borrowings of Rs. 48,518. Over 80 percent of mem-bers in linked groups received these loans, resulting in average borrowings of a little over Rs. 4,000 per member.16 To better understand the extent of
credit provided by banks per year, we compute the number of days between the fi rst group linkage and the survey date for active groups and the days from the fi rst linkage to the last meeting for inactive groups. Using the aver-age duration of 685 days (across all regions and both active and currently inactive groups), members receiving bank credit get about Rs. 2,000 per year through these linkages.
Empirical Methods
General Issues
In the previous section, we have described various aspects of the compos-ition and functioning of SHGs and discussed some of the interesting cor-relations in our data. We have observed, for example, that groups that survive are more involved with village activities, they have more stringent attendance and savings requirements, and they share loans more equitably. Members who remain in groups are more educated than average and have a network of family connections within the group. We now proceed to estimate the effects of some of these group and member characteristics on the duration of group and on the length of time women remain in these groups.
16. This is roughly 100 US dollars at the current exchange rate and $ 273 using the pur-chasing power parity rate of 14.67 released by the International Comparison Program in December 2007.
The group and member life-spans that we are interested in have to be estimated using data that is right censored. In other words, we would like to estimate the length of time that groups and members survive using data in which most groups are still active and most women who joined these groups are still in them. This makes many standard regression techniques inappropriate for our purpose. To see why, suppose that we use a binary variable, which takes the value of one for groups (or members) that are no longer active and zero otherwise, and would like to estimate the effect of a set of co-variates on the likelihood of survival. Even if all groups had the same chances of survival, and our co-variates did not matter at all, we would observe older groups surviving at lower rates simply because they are older, and the characteristics of these groups would therefore appear to be nega-tively associated with the likelihood of survival. We would therefore obtain inconsistent estimates of the effects of group and member characteristics on survival rates. To take another example, suppose PRADAN started its SHG program in areas with low literacy. Even if literacy did not matter for group duration, it would appear to matter because older groups are less likely to have survived until our survey date and these groups have lower literacy rates.
If we try to avoid these types of biases by restricting our sample to in-active groups and to members who have completed their stay in a group, we lose a lot of the variability in our sample and reduce it to a fraction of its current size. What we do instead is to use methods of survival analysis, popular in the biomedical and quality control fi elds, which allow us to use censored observations by making use of information on the censored group or member until the time of censoring, rather than simply ignoring these observations or not accounting for the fact that they are censored. These methods are used to estimate the time until events occur in our case, the events being either the cessation of regular group activity for the group-level analy-sis, or the departure of a member for our study of member attrition.
We estimate the distribution of a random variable T which denotes the duration (in days) of a group, or of a member within a group. This dis-tribution can be represented in several ways.17 The survival function S
T(t)
represents the probability of surviving beyond a time t or, in other words, the probability that the random variable T > t or that the event has not occurred until time t. The hazard rate hT(t) is, in the language of survival
analysis, the instantaneous chance of failure at time t. For our purposes, it
is the probability a member will leave a group at time t, conditional on her being there until that point in time. Finally, the cumulative hazard rate HT(t)
is sum or integral of these hazard rates over (0, t), depending on whether T is discrete or continuous.
These three representations of the distribution of T can be estimated using either parametric or non-parametric methods. Non-parametric estima-tors are a natural choice when dealing with a homogenous population be-cause of the fl exibility they offer. Our population is far from homogenous but we begin with these nonparametric estimates as descriptive tools to summarize the survival behavior of groups and members. We then estimate a parametric model that allows us to incorporate co-variates and therefore estimate the causal effects of group and member characteristics on survival rates. A variety of different non-parametric estimators and parametric models are available. For non-parametric estimates we focus on the Nelson–Aalen estimator of the cumulative hazard function, which is shown to have desirable small sample properties and on a smoothed hazard rate derived from this estimator. For parametric estimates we use the Weibull model for reasons discussed below.
The Nelson–Aalen Estimator
With right censored data, the exact lifetime is only observed if failure or exit occurs before the time of censoring, namely the date at which the group was surveyed. In the following discussion, we will usually refer to events as the exit of SHG members although the same principle applies for group failure.
Suppose that in our data, members exit groups at D distinct times
ti < t2 < … < tD and that at time ti there are di departures. Time, in our case,
is the number of days since the member joined the group. Let Yi represent
the number of individuals who are at risk at time ti. In our case, this is the
number of members who are still part of the group at ti or who leave it at ti.
Members who do not leave but are observed for less than ti days in the group
are subtracted from Yi. The ratio di/Yi estimates the conditional probability
that a group or a member who survives to time ti, experiences the event at
time ti. The Nelson–Aalen estimator is then given by:
(1) H t( ) t t d Y t t t t i i i = ≤ ≤ ⎧ ⎨ ⎪ ⎩ ⎪
∑
≤ 0 1 1 if ifBy smoothing the jump sizes of this estimator with a parametric kernel, we can obtain a hazard function h(t).
The Weibull Model
We now impose some additional structure on the survival function to examine the importance of various group and member characteristics on survival times. We assume that both group and member duration follow a Weibull distribution. The natural log of the cumulative hazard function in the Weibull model is linear as a function of the log of member duration. Figure 5 plots these two variables for our dataset of members (using Nelson–Aalen estimates of H(t)). The model seems to fi t the data fairly well except for members with very short durations within groups. The group-level plot looks similar.
F I G U R E 5 . Appropriateness of the Weibull Model
Given a vector of covariates Z and corresponding coeffi cients β, the Weibull hazard rate is given by
h(x|Z) = (αλxα–1) exp(β′Z)
The fi rst expression (a\ xa–1) is referred to as the baseline hazard, ho and
of hazard ratios corresponding to our explanatory variables. For binary variables these tell us the factor by which the hazard function moves up or down relative to the baseline hazard. In general, it gives us the ratio of the hazard function to the baseline hazard for a unit change in the explanatory variable. If an explanatory variable has no effect on the risk of failure our estimated hazard ratio should be close to 1.
Results
We fi rst present non-parametric estimates of hazard functions separately for each of our areas and then discuss the effects of group and member char-acteristics based on the Weibull model.
Nonparametric Estimates
The Nelson–Aalen estimates of cumulative hazard functions are shown in the upper panel of fi gure 6. The lower panel shows hazard rates that are obtained by a kernel smoothing of the hazard contributions provided by the Nelson–Aalen estimators. Like all estimates obtained by kernel procedures, these hazard rates are not reliable at the end points of the time-interval because our sample is thin in this region.
The lower survival rates for SHGs in Raigarh shown in table 3 are also refl ected here.
The double-humped hazard rate for Raigarh suggests that there are two different phases in a group’s life when it is especially vulnerable: about a year after inception and then again after three or four years. The hazard rates in Keonjhar vary much less over a group’s lifetime. We noted that the Raigarh groups are much more socially heterogenous than those in Keonjhar and that group confl ict is often cited by members as a reason for leaving the group. One reason for the differences in estimated hazard rates across our two regions may be the higher levels of confl ict in Raigarh. The fi rst rise in hazard rates is at about the time that a group takes its fi rst bank loan and the sharing of this loan may be a possible source of confl ict in heterogeneous groups. In the absence of any direct evidence on this type of confl ict, this is of course purely speculative.
Figure 7 displays hazard rates for members in the two regions. The risk of exit in the early stages of membership is very similar, but once again, we see a second hump in the Raigarh hazard function that is missing for Keonjhar. Differences in these member-level hazard rates across the two areas appear less marked than the group-level estimates of fi gure 6.
As discussed earlier (under sub-section Descriptive Statistics), mem-bers who had left groups were asked for the principal reason for their de-parture. The two most frequently cited reasons were (a) diffi culty in saving and repayment and (b) confl ict with other group members. fi gures 8 and 9 estimate hazard rates based on restricted samples of members to illustrate the importance of these two factors as a function of the length of time a member stays in the group. Figure 8 is based on a sample that includes only those members that left due to diffi culty in savings or repayment. Similarly, fi gure 9 includes only those that stated confl ict as their reason for leaving the group. The reversal of hazard rates across regions in these two fi gures is striking. Exit due to diffi culty in saving and repayment is much more important in Keonjhar and reverses the relative position of the aggregate hazard functions seen in fi gure 7. As our summary statistics suggest in table 7, confl ict is more important in Raigarh.
F I G U R E 7 . Member Level Regional Hazard Rates
Parametric Estimates
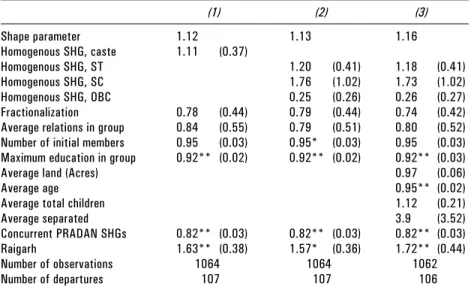
Weibull estimates using group-level data are presented in table 9. Of the various characteristics that we consider, the only ones that systematically affect group hazard rates are the number of other PRADAN-initiated SHGs in the village and the maximum level of education within the group. Both these lower the risk of group failure. In our most comprehensive specifi ca-tion, an additional year of education for the most educated member of the group lowers the hazard rate by 8 percent and an additional group in the same village lowers it by 18 percent. It is conceivable that the presence of an educated member facilitates interactions with banks and other offi cials, and ensures better book-keeping. Other groups in the village may help either through the sharing of information or by making it more likely that a PRADAN professional frequently visits the area. We have not looked at
F I G U R E 8 . Hazard Due to Difficulty in Saving: Member-Level Data
these mechanisms directly and at this stage these are simply conjectures that are consistent with our data and have some anecdotal support.
Before proceeding to study the exit of members from functioning groups, it is worth noting that many of the factors that are commonly believed to affect collective action processes do not seem to matter for the group sur-vival in our model. Group size, average landholdings, social networks or our various measures of social heterogeneity—none of these has statistically signifi cant effects on group survival. In particular, the lower survival rates observed for tribal communities seem to result from their demographic characteristics rather than their tribal status per se. Survival is admittedly a crude signal of group success and it may be that these group characteristics do matter for the fi nancial success of groups. We are currently in the process of collecting fi nancial data on the SHGs in our sample and plan to explore these questions in future work.
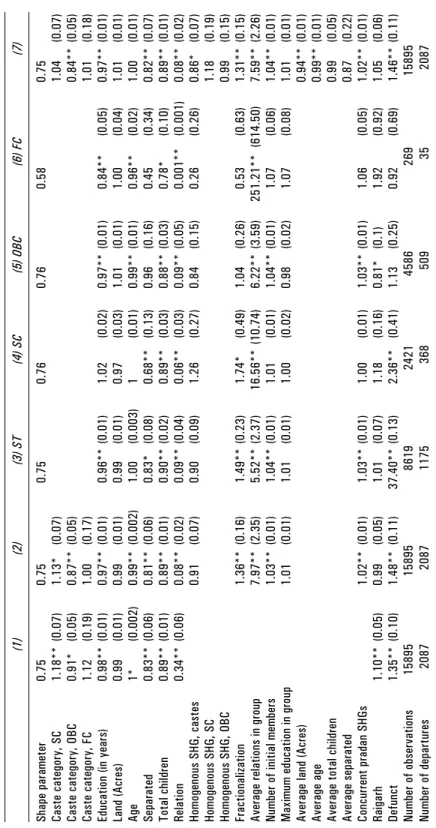
Table 10 is based on our member-level dataset and identifi es the deter-minants of member attrition from groups while these groups are still func-tioning. Member exit appears to be sensitive to both member characteristics and group composition. Women from the intermediate social category of OBCs have lower hazard rates than those from other castes. Education, chil-dren, and relatives within the group are also associated with longer life-spans. Separated women are less likely to leave their group, perhaps because they
T A B L E 9 . Hazard Rates for SHGs, Weibull Model
(1) (2) (3) Shape parameter 1.12 1.13 1.16 Homogenous SHG, caste 1.11 (0.37) Homogenous SHG, ST 1.20 (0.41) 1.18 (0.41) Homogenous SHG, SC 1.76 (1.02) 1.73 (1.02) Homogenous SHG, OBC 0.25 (0.26) 0.26 (0.27) Fractionalization 0.78 (0.44) 0.79 (0.44) 0.74 (0.42) Average relations in group 0.84 (0.55) 0.79 (0.51) 0.80 (0.52)
Number of initial members 0.95 (0.03) 0.95* (0.03) 0.95 (0.03) Maximum education in group 0.92** (0.02) 0.92** (0.02) 0.92** (0.03)
Average land (Acres) 0.97 (0.06)
Average age 0.95** (0.02)
Average total children 1.12 (0.21)
Average separated 3.9 (3.52)
Concurrent PRADAN SHGs 0.82** (0.03) 0.82** (0.03) 0.82** (0.03)
Raigarh 1.63** (0.38) 1.57* (0.36) 1.72** (0.44) Number of observations 1064 1064 1062
Number of departures 107 107 106
TABLE 10.
Hazard Rates for SHG Members, Weibull model
(1) (2) (3) ST (4) SC (5) OBC (6) FC Shape parameter 0.75 0.75 0.75 0.76 0.76 0.58 0.75 Caste category, SC 1.18** (0.07) 1.13* (0.07) 1.04 (0.07)
Caste category, OBC
0.91* (0.05) 0.87** (0.05) 0.84** (0.05) Caste category, FC 1.12 (0.19) 1.00 (0.17) 1.01 (0.18)
Education (in years)
0.98** (0.01) 0.97** (0.01) 0.96** (0.01) 1.02 (0.02) 0.97** (0.01) 0.84** (0.05) 0.97** Land (Acres) 0.99 (0.01) 0.99 (0.01) 0.99 (0.01) 0.97 (0.03) 1.01 (0.01) 1.00 (0.04) 1.01 Age 1* (0.002) 0.99** (0.002) 1.00 (0.003) 1 (0.01) 0.99** (0.01) 0.96** (0.02) 1.00 Separated 0.83** (0.06) 0.81** (0.06) 0.83* (0.08) 0.68** (0.13) 0.96 (0.16) 0.45 (0.34) 0.82** Total children 0.89** (0.01) 0.89** (0.01) 0.90** (0.02) 0.89** (0.03) 0.88** (0.03) 0.78* (0.10) 0.89** Relation 0.34** (0.06) 0.08** (0.02) 0.09** (0.04) 0.06** (0.03) 0.09** (0.05) 0.001** (0.001) 0.08** Homogenous SHG, castes 0.91 (0.07) 0.90 (0.09) 1.26 (0.27) 0.84 (0.15) 0.26 (0.26) 0.86* Homogenous SHG, SC 1.18 (0.19) Homogenous SHG, OBC 0.99 (0.15) Fractionalization 1.36** (0.16) 1.49** (0.23) 1.74* (0.49) 1.04 (0.26) 0.53 (0.63) 1.31**
Average relations in group
7.97** (2.35) 5.52** (2.37) 16.56** (10.74) 6.22** (3.59) 251.21** (614.50) 7.59**
Number of initial members
1.03** (0.01) 1.04** (0.01) 1.01 (0.01) 1.04** (0.01) 1.07 (0.06) 1.04**
Maximum education in group
1.01 (0.01) 1.01 (0.01) 1.00 (0.02) 0.98 (0.02) 1.07 (0.08) 1.01
Average land (Acres)
0.94** (0.01)
Average age
0.99** (0.01)
Average total children
0.99 (0.05) Average separated 0.87 (0.22) Concurrent pradan SHGs 1.02** (0.01) 1.03** (0.01) 1.00 (0.01) 1.03** (0.01) 1.06 (0.05) 1.02** Raigarh 1.10** (0.05) 0.99 (0.05) 1.01 (0.07) 1.18 (0.16) 0.81* (0.1) 1.92 (0.92) 1.05 Defunct 1.35** (0.10) 1.48** (0.11) 37.40** (0.13) 2.36** (0.41) 1.13 (0.25) 0.92 (0.69) 1.46** Number of observations 15895 15895 8619 2421 4586 269 15895 Number of departures 2087 2087 1175 368 509 35 2087
have greater need for the social network provided by it. The average age of members in a group and higher average landholdings are also positively associated with the survival of its members.
The role played by family connections within the group seems to be particularly important. Using the combined sample of all members and con-trolling for a large set of member and group characteristics (the last column in table 10), we fi nd that the hazard rate for a woman with one relative in the group is 92 percent below the hazard rate for a woman with no relatives. On the other hand, we fi nd that the average density of family networks in the group puts members at greater risk. This suggests that the most vulner-able members are those with no relatives in groups where the other mem-bers are closely related. Finally, the existence of competing PRADAN SHGs within the same village also encourages attrition, most likely by mem-bers who choose to participate in another group. This effect of competition is statistically signifi cant but not large.
There is a sizable literature on the role of social heterogeneity and con-fl ict in group settings.18 Almost a fi fth of the members in our survey who
have left groups report personal confl icts as their main reason for leaving. We explore the role of heterogeneity in a variety of different ways. Our fi rst approach is to construct a number of measures of social heterogeneity and use these as explanatory variables. We use our data on the jatis of individual members to construct a social fractionalization index that is commonly used in the literature. The value of the index is based on the shares of each caste or jati in the group and is obtained by subtracting the sum of squares of these shares from one. This variable therefore takes on strictly positive values whenever members of a group are of different castes even if they are all in the same offi cial caste category. We also include a set of dummy variables for groups where all members have the same caste and for those where they are of different castes but of the same caste category. We fi nd that group fractionalization raises hazard rates. When we estimate the model separately for each of our four offi cial caste categories, we fi nd this effect of fractionalization especially marked for the ST and the SC (columns 3 and 4, respectively, in table 10). To illustrate, if we estimate our duration model using only the SC women in our sample, we fi nd that a change in the fractionalization index from zero to one (the minimum and maximum values this index can take) causes the hazard function to jump up by 74 percent. This is double the value of the corresponding coeffi cient in our full sample of women.
Our second approach is to estimate the model only for those SHGs that have women from at most two offi cial caste categories. This means, for example, that we exclude groups with a combination of SC, ST, OBC, and FC women, but include groups that are constituted from any two of these categories. Our intention here is to examine whether the chances of exit vary based on whether a member forms part of a majority or a minority (in terms of these offi cial categories) within the SHG. These results are shown in table 7. Group heterogeneity affects ST women the most. SC women leave heterogenous and homogenous groups at similar rates and those from the OBCs are more likely to leave heterogenous groups only when they are in a minority. Somewhat surprisingly, the extent to which greater heterogeneity is associated with exit does not depend on whether the SHG is comprised entirely of tribal women or of a mixture of castes and tribes. These results point to a lack of solidarity among the ST and are consistent with other re-search that demonstrates that, unlike the SC, tribal communities have not succeeded in establishing a common identity.19
Caste, Education, and Family Networks
Our parametric estimates show that the attrition of women from SHG groups is selective along three major dimensions: caste, education, and the number of relatives in the group. We now examine the role of these characteristics more carefully.
19. Banerjee and Somanathan (2007) fi nd that the ST received far fewer government-fi nanced public goods than the SC over the period 1971–91.
T A B L E 1 1 . Hazard Rates for Members by Caste Categories: Weibull Model (Restricted Sample)
ST SC OBC FC
Shape parameter 0.78 0.78 0.77 1.09 Heterogenous within the same
caste category
1.44** (0.16) 0.66 (0.24) 1.2 (0.33) Heterogenous across caste
categories and member of the majority caste category
1.31** (0.11) 1.04 (0.20) 1.03 (0.17) 0.84 (2.66) Heterogenous across caste
categories and member of the minority caste category
1.23 (0.21) 1.19 (0.27) 1.68** (0.31) 1.35 (5.24) Concurrent pradan SHGs 1.03** (0.01) 1.01 (0.02) 1.06** (0.02) 0.77 (0.32) Number of observations 6706 1321 2962 87 Number of departures 848 182 301 7
Table 12 contains survival rates for women in each of the four caste cat-egories, separately for each region and for homogenous and heterogenous groups. Average attrition is greatest among the ST. Over the fi rst two years of membership, survival rates for homogenous groups are higher than those for heterogenous groups and higher for Keonjhar than for Raigarh, but at the end of three years about a quarter of the ST women have left their group and this rate does not vary much across region or across homogenous and heterogenous groups. Scheduled Castes remain longer in their groups in Keonjhar, but not in Raigarh and castes that comprise the OBCs survive longer in both areas.
T A B L E 1 2 . Member Survival by Caste
Keonjhar Raigarh
Homogenous Heterogenous Homogenous Heterogenous
ST Number of members 1945 2535 453 3064 1 year 92.4 91.2 90.8 87.8 2 year 82.5 82.6 84.5 80.2 3 year 75.3 76.3 75.0 74.4 SC Number of members 210 530 163 1248 1 year 97.0 90.3 85.3 87.7 2 year 93.8 85.4 70.1 79.1 3 year 89.4 81.3 67.2 76.8 OBC Number of members 495 1429 99 2210 1 year 93.3 92.8 100.0 89.1 2 year 90.5 88.2 98.7 82.7 3 year 84.0 83.9 98.7 79.4
Source: Survey Data, 1998–2006.
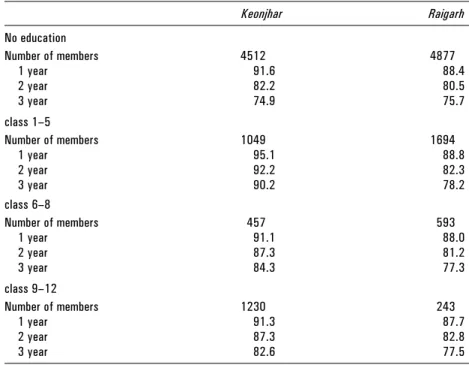
Table 13 presents results from a similar exercise, stratifying this time member survival by education levels. In Keonjhar there is a marked differ-ence in survival rates for uneducated women relative to those with some education. Over a quarter of those with no education left their groups within three years of joining them while only 10 percent of those with some pri-mary schooling did so. An interesting pattern seen in the table is the non-monotonicity of survival rates by education levels. In Keonjhar, women with between one and fi ve years of schooling stay longer in groups than those with some secondary schooling. Patterns in Raigarh are similar, though
less marked. One plausible hypothesis is that uneducated members leave because they are discriminated against or because they fi nd it diffi cult to meet the savings requirements of the group while the more educated ones leave because they have better prospects. This is worrying given our fi nding that group survival depends on the highest education level in the group.
Table 14 is based on a member’s education relative to others in the group. For each group we compute quantiles corresponding to the educa-tion levels of the bottom quarter, half and three-quarters of the populaeduca-tion. In Keonjhar, we observe the highest attrition among those below the fi rst quantile and the lowest attrition is found in the group between the fi rst and second quantiles. These differences in survival rates are not however large relative to those seen in table 13. No systematic pattern is seen in Raigarh.
Table 15 compares survival rates across members based on their family networks within the group. Members are classifi ed into two groups; those with no family relationships within the group and those with at least one relative in the group. The last column in table 15 shows that the differences across these types are large: in Keonjhar, members with no relatives have a
T A B L E 1 3 . Member Survival by Education
Keonjhar Raigarh No education Number of members 4512 4877 1 year 91.6 88.4 2 year 82.2 80.5 3 year 74.9 75.7 class 1–5 Number of members 1049 1694 1 year 95.1 88.8 2 year 92.2 82.3 3 year 90.2 78.2 class 6–8 Number of members 457 593 1 year 91.1 88.0 2 year 87.3 81.2 3 year 84.3 77.3 class 9–12 Number of members 1230 243 1 year 91.3 87.7 2 year 87.3 82.8 3 year 82.6 77.5
survival rate of 74.8 percent while those with at least one relative have a sur-vival rate of 83.1 percent. A similar difference can be observed for Raigarh (71.2 percent versus 81.7 percent). This differential attrition starts early and over the entire three-year period, the survival function for members with relatives lies above the one for members with no relatives in the group.
To get a better idea of how these family networks might operate, we further distinguish between the attrition caused by groups becoming inactive and the attrition that results from members leaving functioning groups. These fi gures are shown in the fi rst two columns of table 15. Recall, that present members are defi ned as all those in active groups and those who remained in groups that are currently inactive and until the last group meeting. In Keonjhar, the differential attrition of connected and un-connected members
T A B L E 1 4 . Member Survival by Relative Education
Quantile 1 Quantile 2 Quantile 3 Quantile 4
Keonjhar Number of members 3902 491 1033 884 1 year 93.4 93.5 93.3 93.2 2 year 88.6 90.3 91.0 89.5 3 year 85.0 89.2 88.5 86.9 Raigarh Number of members 4513 371 933 1084 1 year 92.2 93.8 93.2 93.6 2 year 87.7 88.4 90.0 89.2 3 year 84.6 86.3 87.4 86.6
Source: Survey Data, 1998–2006.
T A B L E 1 5 . Member Survival by Family Networks
Present members In active groups All members No relatives Relatives No relatives Relatives No relatives Relatives
Keonjhar Number of members 3661 3545 1 year 91.8 95.5 98.3 98.5 90.2 94.0 2 year 86.4 92.5 94.1 95.8 81.2 88.5 3 year 82.2 89.9 90.9 92.4 74.8 83.1 Raigarh Number of members 3697 3723 1 year 90.7 94.0 95.3 96.2 86.5 90.3 2 year 85.5 90.5 90.2 93.8 77.0 84.9 3 year 81.8 88.3 87.0 92.6 71.2 81.7