HAL Id: hal-01407766
https://hal.archives-ouvertes.fr/hal-01407766
Submitted on 27 Mar 2017HAL is a multi-disciplinary open access
archive for the deposit and dissemination of sci-entific research documents, whether they are pub-lished or not. The documents may come from teaching and research institutions in France or abroad, or from public or private research centers.
L’archive ouverte pluridisciplinaire HAL, est destinée au dépôt et à la diffusion de documents scientifiques de niveau recherche, publiés ou non, émanant des établissements d’enseignement et de recherche français ou étrangers, des laboratoires publics ou privés.
A perfect wetting of Mg monolayer on Ag(111) under
atomic scale investigation: first principles calculations,
scanning tunneling microscopy and Auger spectroscopy
Amani Migaou, Brice Sarpi, Mathilde Guiltat, Kevin Payen, Rachid Daineche,
Georges Landa, Sébastien Vizzini, Anne Hémeryck
To cite this version:
Amani Migaou, Brice Sarpi, Mathilde Guiltat, Kevin Payen, Rachid Daineche, et al.. A perfect wetting of Mg monolayer on Ag(111) under atomic scale investigation: first principles calculations, scanning tunneling microscopy and Auger spectroscopy. Journal of Chemical Physics, American Institute of Physics, 2016, 144 (19), pp.194708. �10.1063/1.4949764�. �hal-01407766�
1 A perfect wetting of Mg monolayer on Ag(111) under atomic scale investigation: first
principles calculations, scanning tunneling microscopy and Auger spectroscopy
Amani Migaoua,b
, Brice Sarpic
, Mathilde Guiltata,d
, Kevin Payena,b
, Rachid Daineche c
, Georges Landaa,b
, Sébastien Vizzinic
and Anne Hémerycka,b,*
a
CNRS LAAS, 7 avenue du Colonel Roche, F-31400 Toulouse, France b
Univ de Toulouse, LAAS, F-31400 Toulouse, France c
Aix Marseille Univ, IM2NP, Fac Sci St Jérôme, F-13397 Marseille, France d
Univ de Toulouse, UPS, LAAS, F-31400 Toulouse, France
Corresponding author:
Anne HEMERYCK, LAAS-CNRS, 7 avenue du Colonel Roche, BP 54200, 31031 Toulouse Cédex 4, email: [email protected]
Abstract
First-principles calculations, scanning tunneling microscopy and Auger spectroscopy experiments of the adsorption of Mg on Ag(111) substrate are conducted. This detailed study reveals that an atomic scale controlled deposition of a metallic Mg monolayer perfectly wets the silver substrate without any alloy formation at the interface at room temperature. A liquid-like behavior of the Mg species on the Ag substrate is highlighted as no dots formation is observed when coverage increases. Finally a layer-by-layer growth mode of Mg on Ag(111) can be predicted thanks to DFT calculations as observed experimentally.
2 Introduction
In the context of all-integrated stacked layers and extreme miniaturization of devices, control of interfaces in Microelectronics has become a major scientific and technological challenge in past decades 1,2
. To achieve nanoscale-controlled layer, new technological approaches for as-deposited atomically-controlled layers must be developed 3-5
and that cannot be fully exploited without a fundamental knowledge of interfacial effects and atomic organization such as
surface dynamics, bonding, ordering, and intermixing of the atoms 6-14
. Recent efforts have been provided to develop new technological processes to design controlled stacked layers directly integrated, as for instance Atomic Layer Deposition and Oxidation method (ALDO) 3
through a careful control of surface reaction at each step of the process 15-19
. The focus of the following discussion will be related to ALDO process although it can be applied to other technological issues encountered in Microelectronics or other classes of solid-state physics and solid-solid topics. For instance, perfect ultrathin layers and mastered interfaces are a hot topic especially in Spintronics where one of the major difficulty is to achieve highly thin oxide layer with both electrical and magnetic properties guaranteed by a high quality deposited layer 20,21
. This cannot be reached without a perfect control and understanding on layer composition and morphology, which has to be put in regards to its elaboration step itself. Magnesium oxide has gained great interest considering its integration as polar surfaces or as bi-metallic or catalytic systems in microelectronic devices. For these applications, the integration of this MgO oxide requires very good quality of interface to ensure enhanced performances. Nevertheless, many studies highlight that the MgO/Ag interfaces and more particularly the interfacial area is highly dependent of the deposition process 22-25
.
Usual theoretical calculations on interfacial effects are based on by-hand interface building, where oxide and substrate are stuck together 26
. In this paper, we pay attention to reflect technological deposition process, since the elaboration process will define structural properties of grown film. Thus, theoretical calculations are carried out with a careful attention to put it in close relation with the first steps of the experimental ALDO process as described in Ref. 3, i.e. focused on the deposition of the monolayer of the metallic species before oxidation step. We focus on the study of deposition of Mg species on Ag(111) substrate with the aim to identify growth mode and interfacial structure. Mg deposition is described for several coverages of Ag(111) by considering primary steps of adsorption, surface clustering, interfacial effects and growth mode thanks to Density Functional Theory (DFT) calculations. Comparisons to in situ Scanning Tunneling Microscopy (STM) and Auger Spectroscopy results are provided.
3 Computational details
All calculations are based on Density Functional Theory (DFT) as implemented in the plane-wave VASP 5.3.3 package (Vienna Ab initio Simulation Package) 27-30
using the Perdew-Burke-Ernzerhof exchange-correlation functional in the Generalized Gradient Approximation (PBE-GGA) 31
. The projector-augmented wave (PAW) potentials were used for the core electron representation 32,33
. With plane wave methods, the quality of the basis set is determined by a single parameter, the energy cutoff Ecut. We used a converged value of Ecut =
400 eV. The integration in reciprocal space was performed with a Monkhorst-Pack grid using 2x2x1 34
. Both NEB and drag methods have been carried out to calculate energy barriers 35-37
. The silver slab was created according to the (111) crystallographic bulk orientation, resulting in a hexagonal pattern of the face-centered cubic structure (fcc). The simulation cell is composed of 96 silver atoms distributed on 6 layers of 16 silver atoms each, i.e. a 4x4 sites surface. A 14 Šthick vacuum space is added in the z direction for creating a surface. The calculated dimensions of the orthorhombic simulation box are 11.71 x 10.14 x 25.00 ų. The two lowest layers are kept fixed during relaxation in order to replicate the behavior of the bulk material and simulate the presence of infinite atomic layers underneath. We checked that the size of our simulation cell is large enough to ensure no interaction between periodic images. Adsorption energies throughout the paper are calculated using E=Etotal-(Eadsorbate+Esurface), where
Eadsorbate and Esurface are the energies of the isolated adsorbate and of the surface slab alone,
respectively. In this way, negative values indicate exothermic adsorption and positive ones are activation barriers.
Theoretical Results
Primary steps of Mg deposition: from isolated behavior to clustering effects
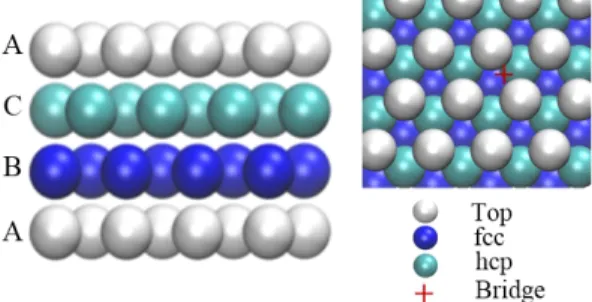
The interaction of atomic magnesium species is examined first. Considering the highly symmetric Ag(111) surface, four adsorption sites (fcc, hcp, bridge, top) have been investigated by positioning Mg atom above these identified sites depicted on the Figure 1. Two of these sites can be associated with possible type of stacking in fcc crystal with a (111) orientation: fcc site can be seen as a position obtained like in an epitaxial growth, whereas hcp one can be seen as a stacking fault in the fcc lattice. In the Figure 1b, stacking default associated to the hcp site is observable with a repeated ABCA stacking layers. In addition, two other sites were tested: the top position, where Mg atom is located right above one of the
4
silver atom of the surface layer and a bridge configuration where Mg atom can adsorbed between fcc and hcp sites right above Ag-Ag bond.
FIG. 1. (Left) Side view of the metallic Ag(111) slab used in the calculations. (Right) Top view where investigated adsorption sites are shown: top, fcc, hcp and bridge. The first and fourth layers are colored in
white, second layers on light blue and third layer in dark blue in order to highlight repeating layer stacking in (111) oriented fcc crystal.
This primary approach highlights that the top configuration does not exist, since Mg atom relaxes in fcc or hcp sites. Then, the three other configurations, shown in Figure 2, are isoenergetic with an adsorption energy of -1.423 +/-0.016 eV (Table I). These isoenergetic configurations can be explained by structural considerations: in fcc and hcp Mg configurations, three Ag-Mg bonds exist long of 2.74 Å, whereas in a Mg bridge, two shortened bonds of 2.65 Å help the stability with a stronger interaction coupled to two weak bonds of 3.19 Å adding a supplementary favorable energetic contribution.
FIG. 2. Top view of final configurations of the different adsorption sites of Mg on Ag(111). (a) hcp site, (b) fcc site and (c) bridge site. Pink and grey spheres are respectively magnesium and silver atoms, distances
are specified in Å. This color scheme is used throughout the paper.
TABLE I. Adsorption energies given for the identified Magnesium adsorbed states shown in Fig.2.
fcc hcp bridge
Eads (eV) -1.439 -1.438 -1.407
Finally, hcp and fcc sites appear to be stable adsorbed states, compared to the bridge. Actually, once a second magnesium atom is adsorbed in the vicinity of a bridge Mg atom, the bridge configuration looses its metastability, to reach an adjacent hcp or fcc site depending on the neighboring Mg configuration, resulting in fcc/fcc, or hcp/hcp configurations in close vicinity or hcp/fcc configuration in second neighbourhood. Bridge configuration is thus seen
5
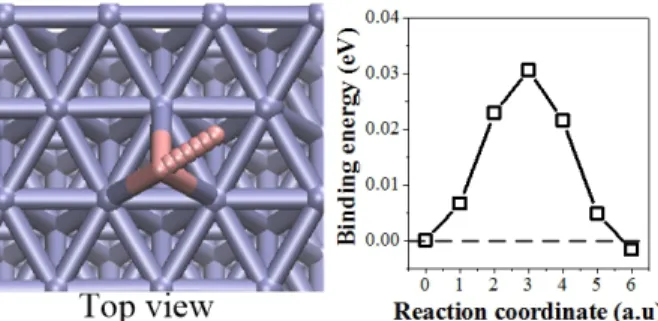
as a metastable step observed during the transition between fcc and hcp sites. The ability of Mg atom to diffuse on the Ag(111) surface is investigated using NEB calculation to obtain the minimum energy pathway and the related energy barrier between those two stable sites, i.e. hcp and fcc as shown on the top view in Figure 3. The calculated activation barrier (shown in Figure 3) is about 0.031 eV which is the same order of magnitude as kBT=0.025 eV at room
temperature. This very low diffusion barrier reveals a high mobility of the Mg atom that will move freely back and forth the surface at low coverage during the first steps of the deposition process.
FIG. 3. (Left) Top view of surface diffusion of magnesium atom on an Ag(111) surface from fcc to hcp sites. (Right) Activation energy for Mg atom on an Ag(111) surface given in eV.
In this section, we address the clustering effect of Mg atoms interacting all together on the Ag(111) surface. To do so, two, then three Mg atoms on the Ag(111) surface are adsorbed as close neighboring or/and non-interacting configurations.
Considering two Mg atoms in close neighboring configurations, we put both Mg in close-packed as fcc-fcc, hcp-hcp and fcc-hcp positions. The final obtained configurations are shown in Figure 4.a. Fcc-fcc initial position leads to fcc-fcc final position. Fcc-hcp and hcp-hcp initial positions lead to hcp-hcp configurations. The adsorption energy of both fcc/fcc and hcp/hcp is about -2.897 eV. Furthermore, two Mg atoms on the Ag(111) surface have been positioned on two fcc sites as second neighbors considered as far and non interacting configurations (5.84 Å distant from each other). Here, the observed adsorption energies in the non interacting configuration is lower than in close packed, so we can still deduce a favorable interaction energy between Mg species large of E=-0.021 eV since Eads(close packed 2Mg) <
2 x Eads(1Mg). The obtained energy highlights the existence of a small but nevertheless
favorable interaction between Mg-Mg atoms. In regards to the distances, we note that Mg-Mg and Mg-Ag are respectively about 3.23 Å and 2.10 Å for the two fcc configurations then, 3.24 Å and 2.13 Å for the two hcp configurations. Mg-Mg distances correspond to Mg-Mg bonds of the crystalline Mg structure (3.21 Å).
6
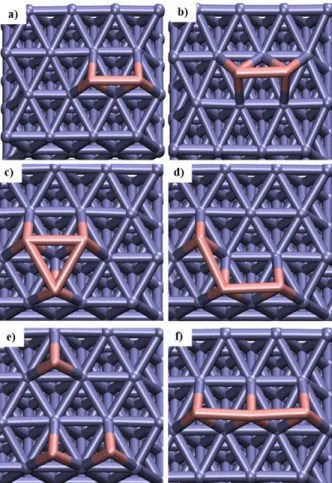
Same approach has been conducted for three Mg atoms on the Ag(111) surface, in order to study the strength of the formed Mg islands. Four fcc-like configurations were tested: the first one is a compact island where Mg atoms are placed as a triangle shape (c on Figure 4), the second one is obtained after moving one Mg along another Mg from triangle configuration, to form a L-like shape (d on Figure 4), the third one is obtained by separating one Mg far of the two others Mg as a dispersed shape (e on Figure 4) and the last configuration has the three Mg aligned referred as an in-line shape (f on Figure 4). Finally the triangle configuration with all atoms packed in close neighboring exhibits a stronger stability. Note that top configuration is still not stabilized even at higher coverage and on close-packed island.
Energy gains of the previously described configurations are given in Table II. Those four configurations do not have the same energy gains where the most stable is observed for the triangle shape as a close-packed configuration, highlighting the favorable formation of Mg island at the surface of Ag(111) substrate and revealing the tendency of Mg clustering effect. By comparing those energies, the interaction energy between Mg atoms is confirmed and can be estimated to be ∆E=-0.021 eV as between L shape and the dispersed shape. Despite in-Line shape can appear favorable because of multiple interactions exist between Mg atoms, we can notice that energy gain is not as favorable as in other tested configurations. This can be explained by structural considerations: referring to distances Mg-Mg, we note that for the triangle configuration, d1Mg-Mg= d2Mg-Mg= d3Mg-Mg =3.27 Å, for the L shape d1Mg-Mg= d2Mg-Mg= 3.21
Å and d3Mg-Mg= 5.37 Å, for the dispersed shape d1Mg-Mg= 5.18 Å, d2Mg-Mg= 3.22 Å and d
3Mg-Mg=5.93 Å and for the line shape d1Mg-Mg= d2Mg-Mg =3.14 Å and d3Mg-Mg=6.27 Å. In small close
packed island, free surrounding space enables to the Mg bond to adapt well both with the hosting Ag substrate and with the typical bond length Mg-Mg observed in Magnesium crystal lattice (3.21 Å) as a good compromise to deal with lattice mismatch. In in-line configuration, a lateral constraint appears and prevents Mg-Mg bond to expand as noticed with the measured distance of 3.14 Å, shortened compared to 3.21 Å in Magnesium perfect crystal. This constrained configuration has an energetic cost evaluated to be large of 0.080 eV when relaxing the central atom toward neighboring hcp site.
7
FIG. 4. Reduced top views of different relaxed configurations of two and three Mg adsorbed on Ag(111) in close neighboring: 2 Mg atoms in a) fcc-fcc and b) hcp-hcp configurations. Three Mg atoms configurations
in c) triangle shape, d) L shape, e) dispersed shape and f) line shape.
Table II. Adsorption energies of configurations for 2 Mg atoms (a and b) and 3 Mg atoms (c to f) as referred in Figure 4. Fcc-fcc a) Hcp-hcp b) Triangle shape c) L shape d) Dispersed shape e) In-Line shape f) Eads(eV) -2.896 -2.897 -4.397 -4.381 -4.338 -4.325
High diffusion velocity drives the early steps of Mg deposition on Ag(111) where Mg atom will diffuse back and forth on the surface when isolated. Clustering either in fcc or hcp configurations will favor the formation of Mg island at the surface of Ag(111). The weak but favorable interaction exists, that will be traduced by the formation of non-sharp shape and diffuse island.
Interface Effect and growth mode at low coverage
After getting clues on primary steps of adsorption reaction, we focus in the following on the interfacial effect such as penetration and on the growth mode of the Mg monolayer onto Ag(111) substrate.
8
To initiate the penetration process, we first consider the behavior of a single magnesium atom and investigate its ability to penetrate into the Ag(111) substrate. The atomic scale mechanism can be described as one Mg atom initially adsorbed on the surface in fcc site, which will replace one Ag atom of the surface by extracting it from its crystalline position toward an adsorbed fcc configuration on the surface. This mechanism is depicted on Figure 5. This exchange is thermodynamically favorable since the system will gain -0.197 eV. This insertion is associated to an activation barrier of 0.792 eV. Considering the goal of this study, to simulate the controlled deposition of a Mg monolayer on silver substrate as carried out in ALDO process at room temperature, this energetic barrier appears as too large to allow Mg to penetrate into Ag substrate, so that, we can assume that no Mg penetration will occur during the first step of ALDO process.
FIG. 5. (Left) Side view of Mg insertion into Ag(111), (Right) Activation energy for Mg atom insertion into Ag(111).
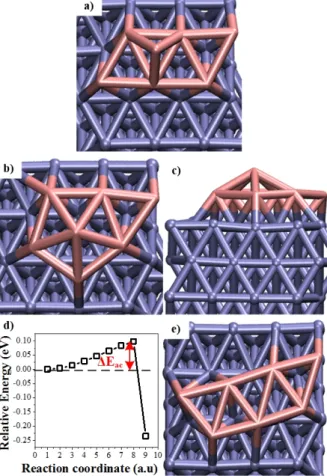
In the previous section, we demonstrate that Mg species forms island at the surface of Ag(111) substrate. At this stage, with increasing coverage, growth mode can be drastically influenced by the presence of this new surface topology. In this section, we thus focus on the 3D growth from small adsorbed islands, by exploring growth mode especially as a layer-by-layer mode. This approach is conducted by simulating the arrival of one Mg atom above an existing Mg island where the behavior of the incoming Mg atom on top of the island is characterized and the strength of this Mg adatom on the island or interaction with the substrate is quantified.
The first investigated island size is relatively small, i.e. 3 Mg atoms island in a triangle shape as observed as the most favorable at 0.18 ML coverage, on which a fourth Mg atom is adsorbed on top as shown in Figures 6a and c. The starting configuration to study the adsorption process is an incoming Mg atom placed above a relaxed triangle Mg island. Upon adsorption, two of the Mg atoms initially constituting the island are displaced from their initial fcc positions to reach nearest hcp sites, the third one does not move. The adsorbed atom reaches also the nearest hcp site compared to its initial positioning above the island, right in
9
the middle of the two others, to form a compact island. The total adsorption energy is -1.432 eV which is the same energy as one Mg atom deposited on Ag (-1.439 eV): here, despite the large relaxation of the Mg initial triangle island that could decrease adsorption energy, several favorable interactions between Mg-Mg atoms appear contributing to stabilize the final adsorbed state.
One can notice here that this is not the incoming atom which falls out from the three Mg atoms island in its vicinity, but this is the Mg atoms from the island which adapt to the presence of on top arriving Mg atom, to give it free space for its full adsorption on the Ag(111), resulting in a flat Mg island. This process is a barrierless mechanism, highlighting the low interaction energy between Mg atoms.
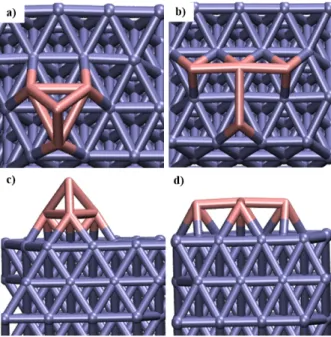
FIG. 6. a) and c) Top and side views of the initial configuration of one Mg incoming above a 3 Mg atoms island, b) and d) Top and side views of the final adsorbed configuration after relaxation of Figure a. The same calculation has been applied for higher coverage starting from a larger Mg atoms island. The starting configuration is a 6-Mg atoms close packed island in fcc configuration on the Ag(111) surface (0.38 ML). Above this island, a seventh Mg atom is approached (Figure 7a). On Figure 7b, we can observe the obtained configuration after adsorption and notice that 6 Mg atoms island undergoes a smooth deformation, as if Mg atoms adapt their arrangement to offer free space for the incoming Mg atom through the move of one Mg atom which slips gently from fcc site to close hcp site. Here again, the adsorption energy of the seventh Mg is the same as the deposition of one Mg on Ag (-1.416 eV).
Actually, when we look at this adsorbed adatom state given in Figure 7b, the added Mg atom is not totally inserted into the Mg island (Figure 7c). From this stage, a drag method has been
10
carried out by pushing down the topmost Mg atom to insert it into the Mg island: the minimum energy path has been plotted on Figure 7d. The corresponding activation barrier large of ∆E=0.087 eV appears as very low and is associated with a favorable energy gain of -0.236 eV. This low activation barrier confirms our previous assumption on magnesium spread and liquid-like behavior of Mg on Ag(111) surface. This observation is consistent with the favorable but not too strong interaction of Mg atoms that can easily adapt to the presence of surrounding Mg species and form smooth packed configurations (Figure 7e). In this paper, we qualify the ability of Mg atom to move on the surface of Ag(111) substrate as a liquid-like behavior, because Mg atoms are weakly bound all together when forming an island that makes them perfectly deformable as liquid. We observe that Mg atoms are able to rearrange themselves from site to site, moving away from their initial position but keeping cohesiveness with other Mg atoms.
From these calculations, we can assume that growth mode of the Mg monolayer on Ag(111) will not lead to 3D dots formation, but will form a uniform and perfectly wetting nanometer thick homogeneous layer.
FIG. 7. a) Top view of the initial configuration of one Mg incoming above a 6 Mg atoms island, b) Top view of the final adsorbed configuration after relaxation of a), c) Side view of the final adsorbed configuration after relaxation of Figure a), d) activation barrier of the insertion of Mg adatom on the Mg
11
In the frame of our performed calculations, where the aim is to establish the link with the experimental study dedicated to the achievement of nanostructured and controlled thin film through the ALDO process 3
, we can conclude that the behavior of Mg atom during the deposition of metallic species in the first step of the ALDO cycle, is limited to an adsorption of Mg on the surface forming flat island, and that no penetration of Mg species will occur giving rise to a perfect interface, with no intermixed layer formation.
Growth mode of Mg layers
As we observe that neither dot existence at the early stages of deposition nor alloy formation, we pursue the study in order to discriminate a Frank–van der Merwe mode characterized by a layer-by-layer growth or a Stranski–Krastanov growth where formation of 3D dots is observed from a primary deposited monolayer. In the following the starting configuration is chosen as a full covered Ag(111) by a monolayer of Mg atoms in fcc configurations as a perfectly wetting Mg Monolayer. The full coverage, simulated as sixteen Mg atoms adsorbed in fcc sites, has been obtained by successive adsorption of atomic Mg species, each time favorable considering energy gains ranging from -1.416 eV to -2.012 eV depending on the local adsorption configuration of the incoming Mg atom where two or more neighboring Mg atoms (until 6) can exist due to slab periodicity. During this procedure, we observe that Mg-Ag distance increases from 2 Å to 2.4 Å in order to reduce stress caused by lattice mismatch at the interface. Note here that we could not succeed as could be predicted by Mg crystalline lattice parameter, to insert a seventeenth Mg atom into the deposited Mg monolayer: this insertion process requires an activation barrier large of 1.133 eV and results in a complex rearrangement at this interface where the extraction of one Ag atom occurs to be replaced by one Mg atom.
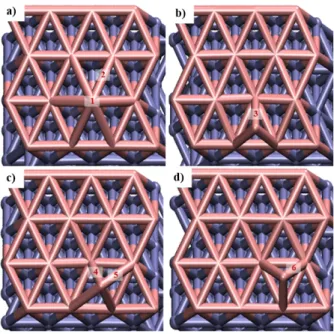
Then, considering the highly symmetric covered 16-Mg on Ag(111) surface, four adsorption sites (fcc, hcp, top and bridge as described in Figure 1) have been investigated by positioning Mg atom above the monolayer of Mg. Relaxed configurations are given in Figure 8 and associated adsorption energies and structural features in Table III.
12
FIG. 8. Adsorbed final top view configurations of 1 Mg atom on 1ML of Mg. (a) top site, (b) fcc site, (c) bridge site and (d) hcp site (labels from one to six are distances Mg-Mg given in Table III).
Table III. Adsorption energies and Mg-Mg distances related to adsorbed states given in Fig.8.
top fcc bridge hcp Eads (eV) -0.939 -0.919 -0.918 -0.907 d Mg-Mg (Å) d1: 2.68 d2: 3.45 d3: 2.93 d4: 2.89 d5: 3.27 d6: 2.94
We first notice that these four adsorbed configurations are isoenergetic with an adsorption energy of -0.923 +/- 0.016 eV, and remarkably that the top configuration is stabilized. In regards to the distances, we note that Mg-Mg bonds are about 3.45 Å and 2.68 Å for the configuration a) as one short and six extended bonds, and three equivalent bonds large of 2.93 Å and 2.94 Å for the configuration b) and d) respectively and 3.27 Å and 2.89 Å as previously observed for the bridge configuration c). Nevertheless, we observe that both top and bridge configurations are metastable configurations, which become either fcc or hcp configurations when a neighboring Mg atom is adsorbed in their vicinity.
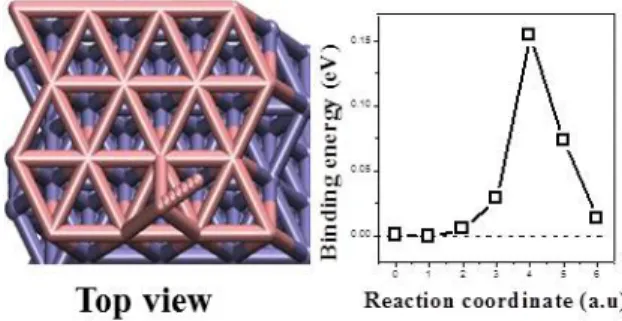
The Mg diffusion on the Mg monolayer is studied using NEB calculation (Figure 9). As top or bridge configurations are metastable, fcc to hcp diffusion path has been only characterized as a direct path, not considering top or bridge as intermediate state, even if they can be considered. This approach is the same as the one conducted in the first part of the paper, on perfect silver substrate. Here, the energy barrier increases to 0.154 eV compared to diffusion
13
on Ag(111) but remains small. We conclude that Mg atom, when isolated, still has a high mobility even when it diffuses on as-deposited Mg monolayer.
FIG. 9. (left) Top view of surface diffusion of 1 Mg atom on a monolayer of Mg between fcc and hcp site. (right) Energy associated to the diffusion path.
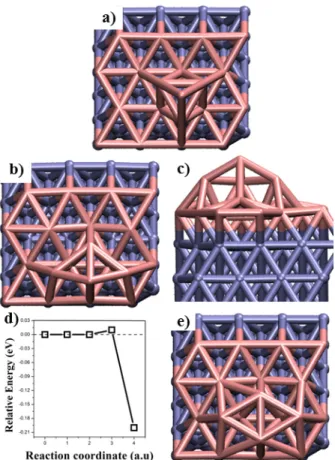
The clustering effect of three Mg atoms interacting all together on the monolayer of Mg is also observed at large coverage as a result of first steps of Mg crystallization. For this, several starting configurations have been investigated: Mg atoms are adsorbed on the monolayer of Mg in a triangle in hcp configuration or fcc configuration. Mg atoms relax close to their starting adsorption sites (hcp or fcc) (Figure 10a) with characteristic Mg-Mg distances of 3.08 Å. The adsorption energy of these configurations are Eads = -3.502 eV. These values highlight
a more favorable interaction between Mg species of different layers due to Mg crystallization compared to the clustering effect observed on Ag(111) substrate. Here, the whole interaction energy of this configuration has been estimated to be -0.733 eV as the energy difference of three isolated Mg atoms adsorbed on Mg monolayer (3 x Eads-1Mg=-2.769 eV).
The 3D growth mode is investigated from this as-considered island formation. As shown in Figure 10a, we simulate the arrival of one Mg atom centered above the existing three Mg-atoms triangle island. At the first stage of the relaxation procedure, spontaneously magnesium atoms spread on the surface to reach a metastable structure where the fourth magnesium atom is stabilized in a strand configuration above the surface (Figure 10b and 10c). Then this strand atom is pushed down toward the substrate to reach a stable structure easily (∆E=0.012 eV) associated with an energy gain of -0.196 eV. The final configuration is shown on Figure 10e. Here a close packed configuration is obtained with two Mg atoms in bridge, and two other Mg in as fcc and hcp sites. Further investigation must be conducted concerning crystallization of Mg supported film at higher coverage but this is beyond the scope of the current paper. Those results support our statement of the spreading liquid-like behavior of the magnesium species on Ag(111) and on Mg supported monolayer. The adsorption energy of the fourth atom is about -1.292 eV. This value is high compared to -0.923 eV observed previously but is
14
associated to a large surface rearrangement and indicating the favorable contribution of the Mg-Mg interaction.
FIG. 10. a) Top view of the initial configuration of one Mg incoming above a 3 Mg atoms island on 1ML of Mg, b) Top view of the final adsorbed configuration after relaxation of a), c) Side view of the final adsorbed configuration after relaxation of Figure a), d) activation barrier of the insertion of Mg adatom
on the Mg island and e) Top view of relaxed configuration after forced relaxation.
These calculations reveal that no Mg 3D dots can be formed even at larger coverage when Mg is deposited on Ag(111) substrate. The liquid-like behavior of the Mg on Ag(111) substrate is also observed when Mg evolves on a Mg monolayer supported on Ag(111).
From these calculations, we can assume that the growth mode of Mg species on Ag(111) substrate is a Franck van-der-Merwe mode 38
.
This modeling approach to investigate and identify growth mode of as-deposited materials on a given substrate is meaningful. Both structural and energetics (activation barriers, interaction energies between adsorbed atoms and between adsorbate and substrate) considerations must
be analyzed for a full understanding of the growth process. In the present study, 2D island
formation is highly favored because of both the fast diffusion of isolated Mg atom on the surface and favorable interacting energy. But weak interaction energy between Mg atoms and small interaction between adsorbate and substrate are not favorable to form highly stable
15 close-packed 2D Mg islands preventing 3D island growth to occur. A liquid-like behavior of as-deposited species on a substrate appears to be one of the features of the Franck van-der-Merwe growth mode.
Experimental Procedure
Experiments were performed in-situ in a ultra-high vacuum (UHV) chamber equipped with a Riber CMA Auger spectrometer, an Omicron Spectra low energy electron diffractometer (LEED) and a commercial Omicron variable temperature-scanning tunneling microscope (VT-STM). Prior to Mg deposition, bare surface of the Ag(111) single crystal was cleaned by repeated cycles of Ar+
sputtering (700eV) and annealing at 670K, resulting in sharp (1x1) hexagonal LEED pattern and atomically flat silver terraces observed by STM.
Magnesium was deposited at RT from a calibrated effusion cell with a background pressure in the 10-10 Torr range. The deposition of one Mg ML onto the substrate was calibrated using
Auger electron spectroscopy (AES) growth curve and coverage STM investigations.
Experimental Results: Scanning tunneling microscopy and Auger spectroscopy
To identify the Room Temperature (RT) growth mode followed by Mg onto Ag(111), a growth curve highlighting the variation of the silver main peak Auger intensity under the influence of Mg deposition was recorded 22
. From the shape of such a curve, the growth mode can be deduced. Figure 11a. presents AES spectra recorded for clean silver surface and as a consequence of 30 seconds and 88 seconds of Mg deposition at RT. The first spectrum evidences a high chemical purity for the bare Ag surface. After 30 seconds of deposition, an AES signature appears for magnesium with a Mg_(45eV) peak which induces a noticeable attenuation of the Ag_(356eV) main peak. Increasing the Mg quantity, the substrate-related Auger peak appears completely attenuated after 88 seconds of deposition, indicating formation of a complete Mg thin film onto the substrate, and thicker than AES detection depth (around 3 nm). The silver Auger intensities measured for these labeled spectra are displayed in Figure 11b. with a logarithmic representation of the growth curve giving normalized peak-to-peak Auger intensity of the Ag_(356eV) signal versus magnesium deposition time. The nearly linear decay observed corresponds here to an exponential attenuation of the silver substrate and reveals a layer-by-layer growth mode for Mg at RT, so called Frank-van der Merwe 38
16
FIG. 11. a) AES spectra recorded for bare Ag surface (label 1), after 30 sec of Mg deposition (label 2) and after 88 sec of Mg deposition (label 3), b) Logarithmic representation of the normalized peak-to-peak
Auger intensity of Ag_(356eV) signal versus Mg deposition time and best linear fit
STM experiments were also performed to assess the surface morphology of the magnesium deposit in the sub-monolayer range.
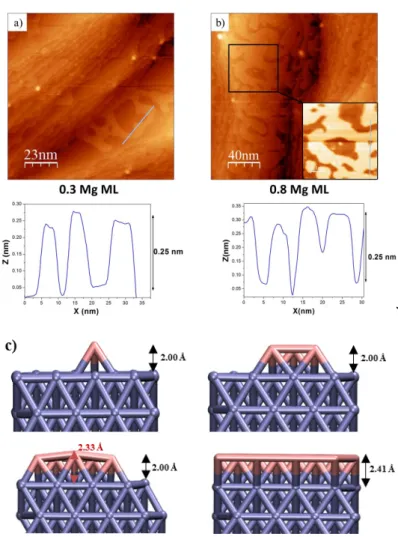
Figure 12a presents a filled state STM image recorded after around 0.3 ML of Mg deposition onto the substrate. Below the Mg deposit, bare silver surface can be seen with several atomic steps and terraces. At this coverage, Mg organizes itself as 2D homogeneous stripes wetting the silver substrate. From the blue line drawn into the image and related to the corresponding height profile, the bi-dimensional nature of the Mg stripes is highlighted with a measured average height close to 2.5 Å. Increasing the deposited quantity up to 0.8 Mg ML, this 2D growth mode appears conserved in the filled state STM image and the corresponding height profile drawn in Figure 12b. The provided height profile perfectly fits with DFT structural observations shown in Figure 12c. Consistent with the deposition rate, a larger density of Mg stripes can be seen, resulting in a substrate coverage close to 80%. The observed deposit morphology evidences a high mobility for the Mg species. More precisely, the stripes are linked to each other with no discontinuity, indicating that the Mg atoms diffuse from their initial adsorption sites until they incorporate the pattern of Mg stripes previously formed in surface. This experimental observation nicely emphasizes a liquid-like behavior for magnesium at the silver surface, as predicted from DFT calculations.
Note that additional LEED experiments (not presented) were performed to investigate crystallinity of the metallic layer. From the initially sharp and luminous (1x1) LEED pattern of bare silver surface, further magnesium deposition results in a gradual screening of the substrate-related diffraction spots. At one deposited Mg ML, since the (1x1) pattern of Ag(111) is still observable at high LEED energy (110 eV) with an increased background and
17
diffuse diffraction spots, one can rule out the surface alloy formation that would have induced long range disorder at the silver surface, as it has already been reported after thermal annealing of Mg onto Ag(100) 24
or after RT deposition of Mg onto Si(100) 18,19
.
`
FIG. 12. a) 100 x 100 nm2 filled state STM image recorded after 0.3 ML of Mg deposition and
corresponding height profile, b) 200 x 200 nm2 filled state STM image at 0.8 Mg ML and corresponding
height profile, c) Atomic representation obtained by DFT of one adsorbed Mg (top left), of a triangle shape (top right), of a 8 Mg atoms island (bottom left) and a full adsorbed monolayer on the Ag(111)
(bottom right). Mg height from the surface is given in Å.
Conclusions
An atomic scale investigation of Mg on Ag(111) was conducted by coupling theoretical calculations and advanced in situ experiments. A high mobility of Mg species, a weak but favorable interaction between Mg species appear to be good ingredients to form puddles at the surface until the full coverage of Ag(111) results in a perfect wetting of Ag(111) substrate by Mg monolayer. We highlight a liquid-like behavior of the as-deposited Mg, where no 3D dots are formed but smooth and flat islands appear. At larger coverage, Mg layers grow as a layer-by-layer mode as can be observed in the initial steps of the Franck van der Merwe growth mode. We also determine that at room temperature no alloy will be formed during deposition.
18
Under these considerations, we can assume that a perfect interface can be achieved even at room temperature through a controlled process as the ALDO process (Atomic Layer Deposition and Oxidation). We highlight in this paper that a nanoscale control of atomic layer deposition as conducted through ALDO process will offer new perspectives toward nanostructured materials directly integrated and endowed by high quality interface.
Acknowledgments
This work has been performed using CALMIP computer resources (GRANT 1418). The CNRS-Défi Inphyniti has funded part of this study. Experimental study has been made possible thanks to the financial support of the following organizations: Région Provence-Alpes-Côte d’Azur (PACA), Institut Carnot STAR, and ville de Marseille.
References
1
R.L. Opila, J. Eng Jr, Progress in Surf. Science 69, 125 (2002).
2
E.A. Irene, Wiley Interscience, A John Wiley & Sons, Inc. Pulication.
3
H. Oughaddou, S. Vizzini, B. Aufray, B. Ealet, J.-M. Gay, J.-P. Bibérian, F.A. d’Avitaya, Appl. Surf. Sci. 252, 4167-4170 (2006).
4
L. Pan, K-K Lew, J. O. Redwing, E.C. Dickey, Nano Lett. 5, 1081–1085 (2005).
5 J. Murota, M. Sakuraba, B. Tillack, Jpn J. of Appl. Phys. 45, 6767 (2006). 6
Sadasivan Shankar, Harsono Simka and Michael Haverty J. Phys.: Condens. Matter 20, 064232 (2008).
7
C. Lanthony, M. Guiltat, J.-M. Ducéré, A. Verdier, A. Hémeryck, M. Djafari-Rouhani, C. Rossi, Y.J. Chabal, A. Estève, ACS Applied Materials & Interfaces 6 15086 (2014).
8 A. Hémeryck, A. Estève, N. Richard, M. Djafari Rouhani, Y.J. Chabal, Phys. Rev. B 79,
035317 (2009).
9
A. Hemeryck, A. Mayne, N. Richard, A. Estève, Y.J. Chabal, M. Djafari Rouhani, G. Dujardin, G. Comtet, J. Chem. Phys. 126, 114707 (2007).
10
A. Hémeryck, A. Estève, N. Richard, M. Djafari Rouhani, G. Landa, Surf. Sci. 603, 2132 (2009).
11
A.K. Upadhyay, A. Hémeryck, A. Estève, G. Landa, M. Djafari Rouhani, Appl. Phys. Lett. 94, 041912 (2009).
12 S.D. Elliott, Semiconductor Science and Technology 27, 074008 (2012). 13
S.D. Elliott, Computational Materials Science 33, 20-25 (2005).
14
K. Wermer, A. Beyer, J.O. Oelerich, S.D. Baranovskii, W. Stolz and K. Volz, J. Cryst Growth 405, 102 (2014).
15
S. Vizzini, H. Oughaddou, C. Léandri, L. Lazarov, K. Nguyen, J. of Cryst Growth 305, 26-29 (2007).
16
S. Vizzini, H. Oughaddou, J.Y. Hoarau, J.P. Bibérian, B. Aufray, App. Phys. Lett. 95, 3111 (2009).
17
H. Enriquez, A. Mayne, A. Kara, S. Vizzini, S. Roth, B. Lalmi, A.P. Seitsonen, B. Aufray, T. Greber, R. Belkhou, G. Dujardin, H. Oughaddou, Appl. Phys. Lett. 101, 021605 (2012).
18
B. Sarpi, N. Rochdi, R. Daineche, M. Bertoglio, C. Girardeaux, A. Baronnet, J. Perrin-Toinin, M. Bocquet, M. Djafari-Rouhani, A. Hemeryck, S. Vizzini, Surf. Sci. 642, L1-L5 (2015).
19
19
B. Sarpi, R. Daineche, C. Girardeaux, M. Bertoglio, F. Derivaux, J.P. Biberian, A. Hemeryck, S. Vizzini, Appl. Phys. Lett. 106, 021604 (2015).
20
C. Felser, G.H. Fecher and B. Balke, Angew Chem Int Ed Engl. 46, 668 (2007).
21
T. Bland, K. Lee and S. Steinmülle Phys. World 21, 24 (2008).
22
B. Sarpi, R. Daineche, C. Girardeaux, A. Hemeryck, S. Vizzini, Appl. Surf. Sci. 361 (2016) 259
23
M. Mantilla, N. Jedrecy, R. Lazzari, J. Jupille, Surface Science 602, 3089 (2008).
24 C. Tegenkamp, M. Michailov, J. Wollschläger, H. Pfnür, Appl. Surf. Sci. 151, 40 (1999). 25
R. Moroni, F. Bisio, L. Mattera, Appl. Surf. Sci. 212-213, 224 (2003).
26
J. Goniakowski, L. Giordano, C. Noguera, Phys. Rev. B 81, 205404 (2010).
27
G. Kresse, J. Furthmuller, Computational Materials Science 6, 15-50 (1996). 28
G. Kresse, J. Furthmuller, J Phys. Rev. B 54, 11169-11186 (1996).
29
G. Kresse, J. Hafner, Phys. Rev. B 49, 14251-14269 (1994).
30
G. Kresse, J. Hafner, Phys. Rev. B 47, 558-561 (1993).
31
J.P. Perdew, K. Burke, M. Ernzerhof, Phys. Rev. Lett. 77, 3865-3868 (1996). 32
P.E. Blöchl, Phys. Rev. B 50 17953 (1994).
33
G. Kresse, J. Joubert, Phys. Rev. B 59, 1758 (1999).
34
H.J. Monkhorst, J.D. Pack, Phys. Rev. B 13, 5188-5192 (1976).
35 G. Henkelman, G. Johannesson, H. Jonsson, Methods for Finding Saddle Points and
Minimum Energy Paths, in Theoretical Methods in Condensed Phase Chemistry, S. Schwartz, Editor. 2002, Springer Netherlands. p. 269-302.
36
D. Sheppard, R. Terrell, G.J. Henkelman, Chem. Phys. 128, 134106 (2008).
37
G. Henkelman, B.P. Uberuaga, H.J. Jonsson, Chem. Phys. 113, 9901-9904 (2000).
38