HAL Id: tel-00786269
https://tel.archives-ouvertes.fr/tel-00786269
Submitted on 8 Feb 2013HAL is a multi-disciplinary open access
archive for the deposit and dissemination of sci-entific research documents, whether they are pub-lished or not. The documents may come from teaching and research institutions in France or
L’archive ouverte pluridisciplinaire HAL, est destinée au dépôt et à la diffusion de documents scientifiques de niveau recherche, publiés ou non, émanant des établissements d’enseignement et de recherche français ou étrangers, des laboratoires
Study of Heavy Flavours from Muons Measured with
the ALICE Detector in Proton-Proton and Heavy-Ion
Collisions at the CERN-LHC
X. Zhang
To cite this version:
X. Zhang. Study of Heavy Flavours from Muons Measured with the ALICE Detector in Proton-Proton and Heavy-Ion Collisions at the CERN-LHC. High Energy Physics - Experiment [hep-ex]. Université Blaise Pascal - Clermont-Ferrand II, 2012. English. �tel-00786269�
Numéro d’ordre : DU 2240 PCCF T 1201 EDSF : 714
CENTRAL CHINA NORMAL UNIVERSITY UNIVERSITÉ BLAISE PASCAL
P H D T H E S I S
présentée pour obtenir le grade deDOCTOR OF UNIVERSITY
Spécialité : Physique Corpusculaire
Par
Xiaoming Zhang
Study of Heavy Flavours from
Muons Measured with the ALICE
Detector in Proton–Proton and
Heavy-Ion Collisions at the
CERN-LHC
defended on May 23, 2012Jury :
Rapporteurs: B. Erazmus - CNRS, CERN, Genève G. Martinez Garcia - CNRS, SUBATECH, Nantes
Examinateurs: X. Cai - CCNU, Wuhan
H. Chen - USTC, Hefei
Y. Ma - SINAP, Shanghai
Directeurs de thèse: N. Bastid - LPC, Clermont-Ferrand P. Crochet - LPC, Clermont-Ferrand
分类号
密级
U D C
编号
博 士 学 位 论 文
题目:LHC/ALICE 实验向前区
重夸克物理的研究
学 位 申 请 人 姓 名:
张 晓 明
申 请 学 位 学 生 类 别:
全日制博士
申 请 学 位 学 科 专 业:
粒子物理与原子核物理
指 导 教 师 姓 名:
周代翠 教授
菲利普•胡克 资深研究员
妮可•巴斯蒂 教授
博士学位论文
LHC/ALICE 实验向前区重夸克物理的研究
论文作者:张晓明
指导教师:周代翠 教授
菲利普•胡克 资深研究员
妮可•巴斯蒂 教授
学科专业:粒子物理与原子核物理
研究方向:高能重离子碰撞实验
华中师范大学物理科学与技术学院
2012 年 5 月
Dissertation
Study of Heavy Flavours from Muons
Measured with the ALICE Detector in
Proton-Proton and Heavy-Ion
Collisions at the CERN-LHC
By
Xiaoming Zhang
Supervisors: Pr. Daicui Zhou
Dr. Philippe Crochet
Pr. Nicole Bastid
Specialty: Particle Physics and Nuclear Physics
Research Area: Heavy-Ion Collision Experiment
College of Physical Science and Technology
Central China Normal University
华中师范大学学位论文原创性声明和使用授权说明
原创性声明
本人郑重声明:所呈交的学位论文,是本人在导师指导下,独立进行研究工作
所取得的研究成果。除文中已经标明引用的内容外,本论文不包含任何其他个人或
集体已经发表或撰写过的研究成果。对本文的研究做出贡献的个人和集体,均已在
文中以明确方式标明。本声明的法律结果由本人承担。
作者签名: 日期: 年 月 日
学位论文版权使用授权书
学位论文作者完全了解华中师范大学有关保留、使用学位论文的规定,即:研
究生在校攻读学位期间论文工作的知识产权单位属华中师范大学。学校有权保留并
向国家有关部门或机构送交论文的复印件和电子版,允许学位论文被查阅和借阅;
学校可以公布学位论文的全部或部分内容,可以允许采用影印、缩印或其它复制手
段保存、汇编学位论文。
(保密的学位论文在解密后遵守此规定)
保密论文注释:本学位论文属于保密,在 年解密后适用本授权书。
非保密论文注释:本学位论文不属于保密范围,适用本授权书。
作者签名: 导师签名:
日期: 年 月 日 日期: 年 月 日
本人已经认真阅读“CALIS 高校学位论文全文数据库发布章程”,同意将本人的
学位论文提交“CALIS 高校学位论文全文数据库”中全文发布,并可按“章程”中的
规定享受相关权益。同意论文提交后滞后:□半年;□一年;□二年发布。
作者签名: 导师签名:
日期: 年 月 日 日期: 年 月 日
i
摘要
宇宙中的可见物质是由那些基本粒子组成的?这些基本粒子间的相互作用又
有那些特性?一直是人类不断探寻自然界奥秘的过程中试图解决的最基本也是最
关键的问题。
标准模型告诉我们,宇宙中所有的可见物质都是由夸克和轻子构成的,不同
种类的玻色子(如光子,胶子等)用以传播它们之间不同种类的相互作用。夸克
和轻子被统称为基本粒子。传播相互作用的玻色子被称为规范粒子。通过 Higgs 机
制,Yang-Mils 场中的规范粒子通过吃掉由真空对称性破缺而产生的 Goldstone 粒
子而获得质量。与此同时,规范粒子和基本粒子间的 Yukawa 耦合使得基本粒子也
获得了其在物理真空中的质量(由于对不同基本粒子质量的测量和定义方法不
同,其在物理真空中质量的名称也不同,对于夸克,在不太严格的条件下,其在
物理真空中的质量可以笼统的称为流质量)。基于标准模型,普通的强子(如构
成原子核的质子和中子)都是由夸克组成的,胶子用以传播夸克间的强相互作
用。夸克和胶子又被统称为部份子。体现强相互作用的荷被称为色荷。类比于描
述电磁相互作用的量子电动力学,用以描述强相互作用的理论被称为量子色动力
学(另外,弱相互作用中的荷被称为味荷,早期也存在量子味动力学用以描述弱
相互作用,但后来被并入电弱统一理论中)。
众所周知,在量子电动力学中,由于涨落而产生的极化,物理真空可被视为
电介质。而在量子色动力学(QCD)中,由于胶子所存在的自相互作用,物理真
空中同时存在着色荷的极化和反极化,在通常条件下,其总体效应使得物理真空
等价于色导体。与电导体内部不存在净电荷向相对应,在可被视为色导体的物理
真空中也不存在自由的色荷。部份子(夸克和胶子)被“囚禁”在强子之中。这一
特性被称为色禁闭或夸克
“囚禁”。同时,色禁闭也解释了为何到目前为止,在通
常条件下从未明确观测到自由的部份子。从另一角度,可以做如下推想:当空间
中的色荷距离越来越近,无论是色极化或色反极化都将越来越弱,而在物理真空
中出现自由的部份子。也就是说,不同于电磁相互作用和弱相互作用,强相互作
用是随着部份子间的距离减小而减弱的,而当部份子间的距离增大时强相互作用
会增强。强相互作用的这一特性已在理论上被 QCD 耦合常数对虚度的依赖性的研
究所证实,而且随后的大量实验观测也完全符合并肯定了这一理论结论。不仅如
此,格点量子色动力学(lQCD)进一步预言了在极端高温和/或高重子数密度的条
件下,将发生由普通强子物质相到退禁闭的夸克-胶子-等离子体(QGP)相的
强相互作用相变。而且,基于 lQCD 的计算,在低重子数密度的条件下,退禁闭相
ii
变还会伴随着手征对称性的恢复,及在生成的 QGP 内,微扰真空会向物理真空回
归,而夸克在强子内的组份质量也会回归到其在物理真空内的流质量。目前,退
禁闭的 QGP 物质被认为存在于大爆炸后约 1
s的早期宇宙,而且现在还存在于中
子星内部。基于上述结论,对 QGP 特性的研究,不仅对掌握强相互作用的性质以
及宇宙中可见物质的质量产生机制起到非常关键的作用,而且还有助于了解早期
宇宙及其演化。因此,对退禁闭相变过程和 QGP 物质特性的研究已成为当前高能
物理领域最重要的前沿课题。
高能重离子碰撞是在实验室条件下实现退禁闭相变的唯一途径。在碰撞过程
中,首先,两个入射原子核被加速到接近于光速,然后进行碰撞并把它们的绝大
部分能量沉积在碰撞区域,使得碰撞区域内具有超高的能量密度而达到发生退禁
闭相变的条件,从而在碰撞区域内产生自由的夸克和胶子,及 QGP 物质。随着
QGP 系统的膨胀,其内部温度也迅速降低,而使整个体系回到强子相(强子气)
然后形成末态所能观测到的各种粒子。在过去的 30 年中,一系列重离子加速器如
SPS,AGS 和 RHIC 先后被建造,并获得了丰富的实验证据表明 QGP 物质相的存
在。其中具有代表性的有:
1.
SPS 能区,
a. 奇异粒子产额的增强以及低质量共振态分布的修正,被解释为手征
对称性在退禁闭物质相中的恢复而使得奇异夸克在 QGP 物质中产生阈
值的降低;
b.
J /粒子产额的压低,被认为是粲夸克偶素(
cc )在 QGP 物质里的
色 Debye 屏蔽势的作用下熔解而导致的;
2.
RHIC 能区,
a. 光子产额的增高,体现了退禁闭的 QGP 物质的热辐射;
b. 椭圆流对组份夸克数的标度性,揭示了部份子在 QGP 内的热化自由
度;
c. 高横动量强子谱的压低以及背对背喷注关联的减弱,反映了高横动
量部份子在穿越 QGP 物质时,与 QGP 介质发生强相互作用而引起的能
量损失。
以上结果充分表明了 QGP 物质的存在,对于当前的研究而言,所面临的问题
便是对其特性进行系统而深入的研究。
基于此目的,位于欧洲核子研究中心(CERN)目前世界上最大的大型强子对
撞机(LHC)于 2009 年底正式运行,并在 2010 年底首次获取了两体质心能量为
sNN 2.76TeV 的铅-铅碰撞数据。在 LHC 能区,由于其高出在 RHIC 能区(两
iii
体质心能为
sNN 200
GeV 的金-金碰撞)约 15-30 倍的两体碰撞质心能和更重
的铅核体系,所形成的 QGP 介质较之 RHIC 能区有更长的存在时间和更大的形成
体积,为全面而深入的探索 QGP 物质的特性提供了独特的条件和有利的保障。
ALICE,作为 LHC 上四大实验之一,专门致力与高能重离子碰撞物理的研究,及
QGP 物质特性的探索。
在众多反映 QGP 特性的末态探针中,重夸克(粲夸克和美夸克)已其独特的特
性而异常重要。绝大部分的重夸克产生与高能重离子碰撞初期的硬散射过程,由
于其质量效应,它具有较之其它轻部份子更短的形成时间和更硬的碎裂函数。这
一特性导致:一方面,重夸克早与 QGP 物质而形成,并穿越随后形成的 QGP 物
质体系,纪录了 QGP 系统各演化阶段的信息;另一方面,其运动学分布又能很好
的被其末态强子所反映。基于重夸克的优越特性和在超高能的 LHC 能区丰富的重
夸克产额,使得重夸克成为揭示 QGP 物质特性的独特探针。
首先,重夸克在穿越 QGP 体系时与其内部部份子相互作用而导致的能量损失
体现了强相互作用的特性。根据标准模型的对称性,理论上预言,胶子的辐射能
量损失大于夸克。而较之轻夸克,重夸的胶子辐射会在与其夸克质量相关的锥角
内压低,从而导致重夸克辐射能量损失比轻夸克小,这一效应被称为死角效应。
核修正因子
RAA是反映部份子能量损失的实验观测量。基于重夸克辐射能量损失的
死角效应,重味强子的
RAA因大于轻强子。但这一现象并未在 RHIC 能区上被观测
到。因此,在 LHC 能区对重夸克末态产物
RAA的测量有利于深入了解部份子在
QGP 介质内的相互作用特性。更进一步,在 LHC 能区由于丰富的重夸克产额,提
供了新的实验观测量,重轻比,即开粲或开美强子的
RAA与轻强子的
RAA之比。在
LHC 能区,轻强子主要源于胶子的碎裂,而粲夸克的质量(
mc 1.5
MeV )较之
其能量可以忽略而表现出轻夸克的特性,于此同时质量较大的美夸克(
mb4.5
MeV )仍保持其重夸克的性质。根据以上特性,开粲强子与轻强子之间的重轻比
体现了部份子能量损失对色荷的依赖性,而开美强子与轻强子间的重轻比进一步
反映了部份子能量损失对其质量的依赖关系。根据新近的理论研究,对开美强子
和开粲强子间
RAA之比的测量不仅能直接的反映夸克能量损失对其质量的依赖还可
用以区分描述 QGP 物质的不同理论,是标定 QGP 属性的关键观测量。
另一方面,相变过程的特性,往往体现于其末态产物的集体行为。因此,重
夸克末态产物的集体流也是实验中非常重要的观测量。在低横动量区间,重夸克
末态产物的集体流揭示了重夸克在 QGP 介质内的热化自由度;在高横动量区间,
这一观测量体现的是重夸克能量损失对穿越路径长度的依赖性。更重要的是,表征
QGP 介质的关键量,粘滞系数与熵的比值(
/s), 可通过结合重夸克的
RAA和集
体流的实验测量结果而得到。
此外,重夸克的重要性不仅仅体现在重离子碰撞中,在核子-核(pA)和核
子-核子(pp)碰撞中,对重夸克末态产物的测量也蕴涵着丰富的物理。在 pA 碰
撞中,它是了解各种冷核效应(核遮蔽,内禀横动量增宽以及胶子饱和等)的有
利工具;特别是在实验的向前快度区间,它能使对冷核效应的测量达到及小的
Bjorken 分数区间(
x ~ 104)。在 pp 碰撞中,对重夸克末态产物的测量不仅为 pA
碰 撞 和 重 离 子 碰 撞 提 供 了 归 一 化 基 准 , 同 时 , 也 是 检 测 微 扰 量 子 色 动 力 学
(pQCD)的有利工具。在 pQCD 的计算中,重夸克的质量可有效抑制微扰级数的
红外发散,从而提高了 pQCD 对重夸克产生截面预言的准确性,这使通过比较重
夸克末态产物产生截面的实验测量结果和理论预言成为验证 pQCD 理论的重要手
段。
本工作基于 LHC/ALICE 实验的向前区
子谱仪,通过半
子衰变道分别研究
铅-铅碰撞和质子-质子碰撞中重夸克的产生。在第一章中,将对 QGP 相变和高
能重离子物理做全面的介绍,并讨论已有的典型实验结果以及 LHC 能区优越的实
验条件和 ALICE 实验上已获得的重要结果。对重夸克在核子-核子,核子-核以
及重离子碰撞中的产生机制和对应物理将在第二章中做系统介绍,同时讨论
ALICE 实验上已获得的通过半电子衰变道和强子衰变道对重夸克产物测量的结
果。在正式讨论基于本论文的工作之前,作为工作基础,在第三章和第四章里,
将对 ALICE 探测器特别是向前区
子谱仪和 ALICE 实验数据获取和分析的在线和
离线环境进行介绍。同时将着重讨论在本工作中我们针对重夸克半
子道测量所开
发的数据分析和校正的软件框架。第五章总结了我们在模拟条件下通过单,双
子
道测量重味强子产生截面的可行性研究结果,在研究中,我们成功的重建出了模
拟所输入的重味强子谱。然后,第六章道第九章将对我们数据分析的过程和结果
做着重讨论。第六章,将以质心系能量
s
900
GeV 的质子-质子碰撞数据为
例,对实验中 ALICE 向前区
子谱仪的性能,实验数据中的背景和对数据的筛选
做全面讨论。在质心系能量
s
7
TeV 的质子-质子碰撞中对向前区重夸衰变
子的产生截面的测量方案及其结果是第七章的主要论述内容。在误差范围内,我
们的测量结果很好的符合了次领头阶的 pQCD 计算的预言,这一结果是首次在此
新能区下对 pQCD 理论预言的重夸克产生截面的检验。此外,在这一章的最后,
我们还讨论了新的背景减除方案和如何对开粲和开美强子衰变
子组份进行分离的
思路。在第八章中,我们首先讨论了铅-铅碰撞数据的基本特性,重点介绍了数
据中心度选择的各种方法;随后,运用第七章中的方法,我们给出了在质心系能
v
量
s
2.76
TeV 的质子-质子碰撞中向前区重夸克衰变
子的产生截面的测量结
果,此结果也在误差范围内很好的符合了次领头阶 pQCD 的预言,它将作为我们
在此两体碰撞质心能下计算铅-铅碰撞中重夸克衰变
子的和修正因子的归一化基
准;在两体质心能为
sNN 2.76
TeV 的铅-铅碰撞中对重夸克衰变
子核修正因
子的计算方案和结果的讨论是这一章重点内容,最后,我们的结果首次反映出重
夸克在向前区的压低与中心快度区间相似,这一结论的重要性在于它并不符合之
前理论的预言(在向前区由于其部份子密度较之中心区要低,高横动量区间的重
夸克压低效应较之中心区要弱),这为理论研究提供了新的方向,也为深入揭示
部份子在 QGP 介质内的能量损失机制给出了新的线索。第九章是关于遍举
子椭
圆流的测量,在全面介绍和比较了各种集体流的分析方法之后,我们逐一运用这
些方法于数据分析之中,并对它们做出了检验;在误差范围内,不同的分析方法
和参考粒子给出了相同结果,而且符合分析的预期;这一工作为我们进一步测量
重夸克衰变
子的集体流和通过结合核修正因子和集体流的测量结果深入揭示
QGP 特性打下了坚实的基础。论文的最后是对我们以上所有相关工作的总结和展
望。
关键字:大型强子对撞机(LHC),大型重离子碰撞实验(ALICE),质子-质
子碰撞,超相对论重离子碰撞,单
子,重夸克产生,核修正因子,椭圆流,微扰
量子色动力学
Résumé
Les collisions d’ions lourds ultra-relativistes ont pour objectif principal l’étude des propriétés de la matière nucléaire soumise à des conditions extrêmes et de température de densité d’énergie. Les calculs de la ChromoDynamique Quantique (QCD) prédisent dans ces conditions une nouvelle phase de la matière dans laque-lle on assisterait au déconfinement des constituants des hadrons en un plasma de quarks et gluons (QGP). Les saveurs lourdes (charme et beauté) sont produites lors de processus durs aux premieres instants de la collision puis traversent le mi-lieu produit durant la collision. Par conséquent, la mesure des quarkonia et des saveurs lourdes ouvertes devrait être particulièrement intéressante pour l’étude des propriétés du système créé aux premiers instants de la collision. On s’attend à ce que les saveurs lourdes ouvertes présentent des sensibilités à la densité d’énergie via les mécanismes de perte d’énergie des quarks lourds dans le milieu et que les quarkonia soient sensibles à la température initiale du système via leur dissociation par écrantage de couleur. La mesure du flot des saveurs lourdes devrait apporter des informations concernant le degré de thermalisation des quarks lourds dans le milieu nucléaire. De plus, l’observable viscosité/entropie pourrait être obtenue en combi-nant les mesures du facteur de modification nucléaire et de flot. En conséquence, l’étude de la production des quqrkonia et saveurs lourdes ouvertes est un domaine de recherche intensément étudié au niveau experimental et théorique.
Les mesures effectuées au SPS et RHIC ont permis de mettre en évidence plusieurs caractéristiques du milieu produit mais ont aussi laissé plusieurs ques-tions sans réponse. Avec une énergie par paire de nucléon de 15 fois supérieure à celle du RHIC, le LHC entré en fonctionnement fin 2009, a ouvert une nouvelle ère pour l’étude des propriétés du QGP. Un des plus importants aspects de ce domaine en énergie est l’abondante production de quarks lourds utilisés pour la première fois comme sonde de haute statistique du milieu. Le LHC délivra les premières collisions pp à √s = 0.9 TeV en octobre 2009 et a atteint l’énergie de √s = 7 TeV en mars 2010. Un run pp à√s = 2.76 TeV a eu lieu en mars 2011 pendant une durée limitée. Les runs Pb–Pb à √sNN= 2.76 TeV ont eu lieu fin 2010 et 2011.
ALICE (A Large Ion Collider Experiment) est l’expérience dédiée à l’étude des collisions d’ions lourds au LHC. ALICE enregiste aussi des collisions pp afin de tester les calculs perturbatifs de QCD dans la région des faibles valeurs de x-Bjorken et de fournir la référence indispensable pour l’étude des collisions noyau– noyau et p–noyau. ALICE enregistrera aussi, début 2013, des collisions p–Pb/Pb-p afin d’étudier les effets nucléaires froids. Les quarkonia et saveurs lourdes ouvertes sont mesurés dans ALICE suivant leur mode de désintégration muonique, (di)-electronique et hadronique. Cette thèse concerne l’étude des saveurs lourdes ouvertes dans les collisions pp et Pb–Pb avec les muons simples mesurés aux rapidités avant avec le spectromètre à muons d’ALICE.
Le document est structuré comme suit. Le premier chapitre est une introduction à la physique des collisions d’ions lourds et du diagramme de phase de la matière nucléaire. Le deuxième chapitre présente les objectifs de l’étude des saveurs lour-des ouvertes dans les collisions proton–proton, proton–noyau et noyau–noyau. Un
intérêt particulier est porté au domaine en énergie du LHC. Le troisième chapitre est une description du détecteur ALICE et du spectromètre à muons. Le quatrième chapitre présente les systèmes "online" et "offline". Le cinquième chapitre est un résumé des performances du spectromètre à muons pour la mesure des saveurs lour-des ouvertes dans les collisions pp au moyen lour-des muons simples et dimuons. Les chapitres6 à 9 concernent l’analyse de données. Le sixième chapitre décrit l’analyse des premières collisions pp à√s = 0.9 TeV collectées avec ALICE. L’objectif princi-pal était la compréhension de la réponse du détecteur. Ces données ont permis aussi fixer la stratégie d’analyse des saveurs lourdes ouvertes : sélection des événements, optimisation des coupures, différentes sources de bruit de fond à soustraire. Le sep-tième chapitre présente la mesure de la section de production des saveurs lourdes ouvertes dans les collisions pp à √s = 7 TeV. La méthode d’analyse est décrite. Cela concerne la sélection des collisions et traces reconstruites dans le spectromètre à muons, la soustraction du bruit de fond (composé principalement de muons issus de la désintégration de pions et kaons primaires), les corrections, la normalisation et la détermination des incertitudes systématiques. Les résultats expérimentaux sont discutés et comparés aux calculs perturbatifs QCD (calculs "Fixed Order Next-to-Leading Log"). Cela concerne les sections efficaces de production des muons issus de la désintégration des saveurs lourdes ouvertes aux rapidités avant (2.5 < y < 4) en fonction de la rapidité et de l’impulsion transverse (pt). Le huitième chapitre aborde
la mesure des muons issus de la désintégration des saveurs lourdes ouvertes dans les collisions Pb–Pb à √sNN = 2.76 TeV collectées en 2010. Les effets de milieu
nu-cléaire sont étudiés à partir du facteur de modification nunu-cléaire RAA. La référence
pp est déterminée à partir de l’analyse des collisions pp à√s = 2.76 TeV. Le facteur de facteur modification nucléaire est étudié en fonction de pt et de la centralité de
la collision. Pour comparaison, les résultats obtenus à partir de la mesure du fac-teur de modification nucléaire central sur périphérique (RCP) sont aussi présentés.
Le neuvième chapitre commence par une revue des différentes méthodes utilisées pour la mesure de la composante de flot elliptique. Les méthodes telles que les cumulants et Lee-Yang Zeroes, permettant de supprimer les effets non-flot, sont dé-taillées. Des premiers résultats prometteurs concernant la mesure de la composante de flot elliptique des muons sont discutés. Ils sont obtenus avec différentes méthodes et présentés en fonction de pt et de la centralité de la collision. Le manuscript se
termine par une conclusion et des perspectives.
mots clés : LHC, expérience ALICE, collisions pp, collisions d’ions lourds ultra-relativistes, muons, production de saveurs lourdes, facteur de modification nucléaire, flot elliptique, calculs pQCD.
Abstract
Ultra-relativistic heavy-ion collisions aim at investigating the properties of strongly-interacting matter at extreme conditions of temperature and energy den-sity. According to quantum chromodynamics (QCD) calculations, under such con-ditions, the formation of a deconfined medium, the Quark-Gluon Plasma (QGP), is expected. Amongst the most important probes of the properties of the QGP, heavy quarks are of particular interest since they are expected to be produced in hard scattering processes during the early stage of the collision and subsequently interact with the hot and dense medium. Therefore, the measurement of quarkonium states and open heavy flavours should provide essential information on the properties of the system formed at the early stage of heavy-ion collisions. Indeed, open heavy flavours are expected to be sensitive to the energy density through the mechanism of in-medium energy loss of heavy quarks, while quarkonium production should be sensitive to the initial temperature of the system through their dissociation due to color screening. The measurement of the collective flow of heavy flavours provides additional insights on the possible thermalization of heavy quarks in the medium. Furthermore, one of the important medium characteristic, viscosity over entropy (η/s), can be extracted by combining the information from measured nuclear mod-ification factor (related to in-medium energy loss) and the magnitude of the heavy quark flow. In this regard, both quarkonium and open heavy flavour production are a field of intense experimental and theoretical researches.
Despite the work devoted to these studies at SPS and RHIC, several questions are left open. With a nucleus-nucleus center of mass energy nearly 15 times larger than the one reached RHIC, the LHC which started operating in November 2009, provides a new era for studies of interacting matter at high temperature and energy density. One of the most important aspects of this new energy range is the abundant production rate of heavy quarks which are used, for the first time, as high statistics probes of the medium. The LHC delivered the first proton-proton collisions at √
s = 0.9 TeV in October 2009 and reached its current maximum energy of 7 TeV in March 2010. A short proton–proton run at√s = 2.76 TeV, at the same energy than the Pb–Pb run, was performed in March 2011. The first heavy-ion run (Pb–Pb collisions at √sNN = 2.76 TeV) took place in November 2010 and the second one
end of2011.
ALICE (A Large Ion Collider Experiment) is the experiment dedicated to the study of heavy-ion collisions at the LHC. ALICE also takes part in the LHC proton– proton program which is of great interest for testing perturbative QCD calculations at unprecedented low Bjorken-x values and for providing the necessary baseline for nucleus–nucleus and proton–nucleus collisions. ALICE will also collect, in the beginning of2013, p–Pb/Pb–p collisions in order to investigate cold nuclear matter effects. ALICE measures quarkonia and open heavy flavours with (di)-electrons, (di)-muons and through the hadronic channels. This thesis work is devoted to the study of open heavy flavours in proton–proton and Pb–Pb collisions via single muons with the ALICE forward muon spectrometer.
The document is organized as follows. The first chapter consists in a general
introduction on heavy-ion collisions and QCD phase transitions. Chapter 2 sum-marizes the motivations for the study of open heavy flavours in nucleon–nucleon, nucleon–nucleus and nucleus–nucleus collisions. A particular emphasis is placed on the novelties at the LHC. Chapter 3 gives an overview of the ALICE experiment with a detailed description of the forward muon spectrometer. Chapter 4 gives a short summary of the ALICE online and offline systems. Then the analysis framework (for data and simulations) and in particular the software developed for the study of open heavy flavours is detailed. Chapter 5 summarizes the performance of the ALICE muon spectrometer for the study of the production of open heavy flavours in pp collisions via single muons and dimuons. Chapters 6 to 9 are dedicated to data analysis. Chapter 6 deals with the analysis of first pp collisions at 900 GeV. The main aim was the understanding of the response of the apparatus. These data allowed also to determine the analysis strategy for heavy flavour measurement in the single muon channel: selection of events, optimization of cuts, understanding of the background components in data. Chapter 7 presents the measurement of the production of heavy flavour decay muons in pp collisions at √s = 7 TeV. The analysis strategy is described: event and track selection, background subtraction (mainly the contribution of muons from primary pion and kaon decays), corrections, normalization and investigation of the systematic uncertainties. The experimental results are discussed and compared to perturbative QCD calculations (Fixed Order Next-to-Leading Log calculations). That concerns the transverse momentum and rapidity differential production cross sections of muons from heavy flavours decays at forward rapidity (2.5 < y < 4). Chapter 8 addresses the measurement of heavy flavour decay muon production in Pb–Pb collisions at √sNN = 2.76 TeV collected
in 2010. The analysis strategy is presented. In-medium effects are investigated by means of the nuclear modification factor (RAA) of muons from heavy flavour
decays. The proton–proton reference is obtained from the measurement of the dif-ferential production cross section of heavy flavour decay muons at the same center of mass energy. The nuclear modification factor is studied as a function transverse momentum (pt) and collision centrality. For comparison, results obtained with the
central-to-peripheral nuclear modification factorRCPare also discussed. Chapter 9
gives an overview of the different methods investigated in ALICE for the study of the elliptic flow. In particular, the recent methods which allow to remove non-flow effects like the Q-Cumulants and Lee-Yang Zeroes are detailed. Promising results concerning the inclusive muon elliptic flow as a function ofptand centrality obtained
with different flow analysis methods are compared. Finally, summary and outlooks are given.
Keywords: LHC, ALICE experiment, pp collisions, ultra-relativistic heavy-ion collisheavy-ions, single muons, heavy flavour productheavy-ion, nuclear modificatheavy-ion factor, elliptic flow, pQCD calculations
Contents
I Introduction 1
1 QCD Phase Transition and Heavy Ion Collisions 3
1.1 History of Standard Model. . . 3
1.1.1 Quark Model . . . 3 1.1.2 Higgs Mechanism . . . 4 1.1.3 Standard Model . . . 5 1.2 Quantum ChromoDynamics . . . 6 1.2.1 QCD Lagrangian . . . 6 1.2.2 Asymptotic Freedom . . . 7
1.2.3 Chiral Symmetry Restoration . . . 8
1.2.4 Ends and New Starts. . . 10
1.3 Quark Gluon Plasma . . . 10
1.3.1 Lattice QCD Predictions. . . 11
1.3.2 QCD Phase Diagram . . . 12
1.4 Heavy Ion Collisions . . . 14
1.4.1 Trace Back to the Big Bang . . . 14
1.4.2 Collision System Evolution . . . 15
1.4.3 Final State Observables . . . 19
1.4.4 Heavy Ion Facilities . . . 21
1.5 Evidence of the Quark Gluon Plasma. . . 22
1.5.1 SPS: First evidences . . . 22
1.5.2 RHIC: Strong Coupled QGP? . . . 24
1.5.3 LHC: Opportunities and Challenges . . . 28
2 Heavy Flavours: a Promising QGP Tomography 33 2.1 Open Heavy Flavour Hadronic Production . . . 33
2.1.1 Factorization Theorem . . . 33
2.1.2 Bjorken-x in PDFs via Heavy Flavours . . . 35
2.1.3 Partonic Cross Section . . . 38
2.1.4 Hard Fragmentation . . . 40
2.1.5 Comparison with Data . . . 42
2.2 Heavy Flavour Production in A–A Collisions. . . 46
2.2.1 Binary Scaling of Heavy Flavour Production in A–A Collisions 47 2.2.2 Cold Nuclear Effects . . . 50
2.2.3 Hot Nuclear Effects. . . 54
2.3 Heavy Flavours Physics at the LHC . . . 62
2.3.1 Novel Aspects of Heavy Flavours at the LHC . . . 62
II ALICE Experiment 73
3 Experimental Apparatus 75
3.1 ALICE Setup . . . 75
3.2 Central Barrel Detectors . . . 79
3.2.1 Detector Layout . . . 79
3.2.2 Primary Vertex Determination . . . 81
3.2.3 Charged Track Reconstruction . . . 82
3.2.4 Particle Identification . . . 84
3.3 Global Detectors . . . 86
3.4 Forward Muon Spectrometer . . . 90
3.4.1 Design Consideration. . . 90
3.4.2 Front Absorber and Beam Shielding . . . 91
3.4.3 Dipole Magnet . . . 93
3.4.4 Muon Tracker . . . 94
3.4.5 Trigger System . . . 98
4 ALICE Online and Offline 103 4.1 Online Control System . . . 103
4.1.1 Trigger System (TRG) . . . 103
4.1.2 Data AcQuisition (DAQ) System . . . 105
4.1.3 High-Level Trigger (HLT) . . . 107
4.1.4 Detector and Experiment Control System . . . 109
4.2 ALICE Offline Project . . . 110
4.2.1 ALICE Computing Grid . . . 110
4.2.2 AliRoot Framework . . . 112
4.3 Analysis Framework of MUON . . . 115
4.3.1 Overall View . . . 116
4.3.2 Muon Code for HF Analysis . . . 118
III Measurements of Open Heavy Flavours with the Muon Spectrometer 121 5 Performance Study of Open HF Measurements 123 5.1 Analysis Inputs . . . 123
5.1.1 Simulation Strategy . . . 123
5.1.2 Efficiency Correction . . . 125
5.2 Sources of (di)muons from HF . . . 127
5.3 Separation of Charm and Beauty Components . . . 130
5.3.1 Combined Fit . . . 130
5.3.2 Systematic Uncertainties . . . 131
5.4 Calculation of dσD/B/dpt(pt> pmint ) . . . 134
5.4.3 Results . . . 136
5.5 Discussions . . . 137
5.5.1 Statistics Estimates . . . 138
5.5.2 Background Subtraction . . . 140
6 Analysis of pp data at √s = 900 GeV 145
6.1 Data Sample and Online Trigger . . . 145
6.2 Offline Event Selection . . . 148
6.2.1 Physics Selection . . . 148
6.2.2 Primary Vertex Selection . . . 150
6.2.3 Effect of the Event Selection on Muon Tracks . . . 151
6.3 Muon Track Selection . . . 153
6.3.1 Matching with MUON trigger tracks . . . 153
6.3.2 Acceptance Cuts . . . 157
6.4 Conclusion: Physics Analysis Cuts . . . 158
7 Heavy Flavour Production in pp Collisions at √s = 7 TeV 161
7.1 Data Quality Assurance . . . 161
7.1.1 Quality Assurance for Muon Analysis . . . 161
7.1.2 Results of Data Quality Assurance . . . 163
7.1.3 Pile-up Correction . . . 166 7.2 Data Sample . . . 170 7.2.1 Summary of Statistics . . . 170 7.2.2 Event Normalization . . . 172 7.3 Background Subtraction . . . 176 7.3.1 Strategy . . . 177 7.3.2 Background Estimate . . . 178 7.3.3 Background Normalization. . . 180 7.3.4 Uncorrected Results . . . 183 7.3.5 Systematic Uncertainty . . . 185 7.4 Efficiency Correction . . . 188 7.4.1 Strategy . . . 189
7.4.2 Test of the Efficiency Correction in Simulations . . . 190
7.4.3 Systematic Uncertainty in Data . . . 192
7.5 Comparison with FONLL Predictions. . . 195
7.5.1 Error Propagation for FONLL Predictions . . . 195
7.5.2 Results of the Comparison . . . 198
7.6 Beam Induced Backgroud Rejection. . . 201
7.6.1 Additional Background component in the Highpt Region . . 201
7.6.2 Kinematics Combination. . . 203
7.6.3 Study ofp×DCA Observable . . . 210
7.7 Results. . . 218
7.7.1 Summary of the Analysis Strategy . . . 218
7.7.2 Final Results . . . 219
7.8.1 Data Based Background Estimate . . . 224
7.8.2 Charm and Bottom Component Separation . . . 227
8 Heavy Flavour Suppression in Pb–Pb Collisions at √sNN = 2.76 TeV229
8.1 Event Trigger Selection. . . 230
8.1.1 Trigger Classes . . . 230 8.1.2 De-bunching . . . 231 8.1.3 Selection Results . . . 232 8.2 Centrality Determination . . . 233 8.2.1 VZERO Amplitude . . . 234 8.2.2 EZEM vs. EZDC . . . 236 8.2.3 Centrality QA . . . 237
8.2.4 Centrality Scaling Factors . . . 238
8.3 Track Selection . . . 239
8.3.1 Typical Distributions. . . 239
8.3.2 Fake Tracks . . . 240
8.3.3 p×DCA in Pb–Pb Collisions. . . 242
8.3.4 Statistics Summary . . . 246
8.4 Reference from pp Collisions. . . 248
8.4.1 Energy Interpolation . . . 249
8.4.2 Reference from pp Data at2.76 TeV . . . 252
8.5 Background Estimate. . . 255
8.5.1 Strategy . . . 255
8.5.2 Inputs from Data . . . 257
8.5.3 Convert the Spectra of K/π to the Muon Level . . . 258
8.5.4 Estimate of the Rapidity Extrapolation Factor . . . 265
8.5.5 Yield of Decay Muons in pp Collisions . . . 269
8.6 Efficiency and Uncertainty . . . 270
8.6.1 Efficiency Correction . . . 271
8.6.2 Systematic Uncertainty on the Final Results. . . 273
8.7 Results. . . 276
8.7.1 RCP of Inclusive Muons . . . 276
8.7.2 RAA of Muons from Heavy Flavour Decays . . . 278
8.7.3 Discussions . . . 281
9 Elliptic Flow of Muons in Pb–Pb Collisions at √sNN = 2.76 TeV 285
9.1 Flow Analysis Methods. . . 285
9.1.1 Event Plane Method . . . 286
9.1.2 Fit-Q and Scalar Product . . . 291
9.1.3 Cumulant Methods . . . 295
9.1.4 Lee-Yang-Zeroes Methods . . . 304
9.2 Data Analysis Environment . . . 310
9.2.1 Reference Particle Selection . . . 310
9.3.1 Corrections for the Event Plane Method . . . 315
9.3.2 Configurations of Other Methods . . . 323
9.4 Results and Discussions . . . 326
9.4.1 Preliminary Results . . . 326
9.4.2 Discussion . . . 329
Conclusion and Outlooks 331
IV Appendix 337
A Publication of "Heavy Flavour decay muon production at forward rapidity in proton–proton collisions at √s = 7 TeV" 339
B Publication of "Production of muons from heavy flavour decays at forward rapidity in pp and Pb–Pb collisions at √sNN= 2.76 TeV" 353
Bibliography 367
Publication List 393
List of Figures
1.1 Elementary particles in the Standard Model (left) and the fundamen-tal interactions between them (right) [17]. . . 5
1.2 QCD running coupling as a function of Q with ΛQCD≈ 200 MeV [31]. 8
1.3 Constituent quark masses with various current masses of different flavours [32].. . . 9
1.4 Left: energy density, ε/T4, versus temperature, T , with 2 light and
1 heavier (strange) quarks [39]. Right: chiral condensation, < ΨΨ > (Eq. (1.11)), and quark free energy function,L(fq), (Eq. (1.13)) with
their associated susceptibilities, χΨΨ and χL, as a function of
tem-perature,T /Tc [34]. All the results are obtained withµB = 0. . . 12
1.5 Schematic view of the QCD Phase Diagram . . . 13
1.6 Picture presenting the evolutiion of the Universe. . . 14
1.7 Schematic view of an Heavy Ion Collision [34] . . . 15
1.8 Geometry of the collision in a two-dimension (left panel) and three-dimension plane (right panel). . . 16
1.9 Characterization of a collision by using the charged particle multi-plicity [50]. . . 16
1.10 CGC Evolution . . . 17
1.11 Hard partons as a tomography of QCD medium. . . 20
1.12 Ratio between measured J/Ψ yield and expected yield as a function of energy density ε, by assuming the suppression source only comes from ordinary nuclear absorption [92]. . . 23
1.13 Hyperon production in Pb–Pb collisions normalized to the ratio from p–Be collisions as a function of centrality (expressed by< Nwound>),
measured in the NA57 experiment at the SPS [95]. . . 24
1.14 Jet Quenching. . . 25
1.15 Left: RAA(pt) of π0 in central (0− 10%) and peripheral (80 − 92%)
Au–Au collisions at √sNN= 200 GeV measured by the PHENIX
ex-periment [96], the shaded hands represent the systematic uncertain-ties on normalization. Right: two particle azimuthal distributions in pp, d–Au and Au–Au collisions measured by the STAR experiment [97]. 26
1.16 p/π+ and p/π− ratios in d–Au [99,100] and Au–Au [101] collisions
measured by the STAR experiment at RHIC. The dotted-dashed line is the ratio(p+p)/(π++π−) measured in e−–e+collisions [102]. The
model calculations in central Au–Au collisions [103, 104] are shown in dotted and dashed lines. . . 27
1.17 Elliptic flow of different hadrons scaled by the number of quark con-stituents of hadrons. The lower panel shows the ratios between data and a Polynomial fit [106]. . . 28
1.18 Comparison of the integrated charged hadron elliptic flow as a func-tion of centrality measured in the PHENIX experiment [109] and STAR experiment [110] with VISHNU calculations using Partici-pant Plane (PP) averaged [108]. . . 29
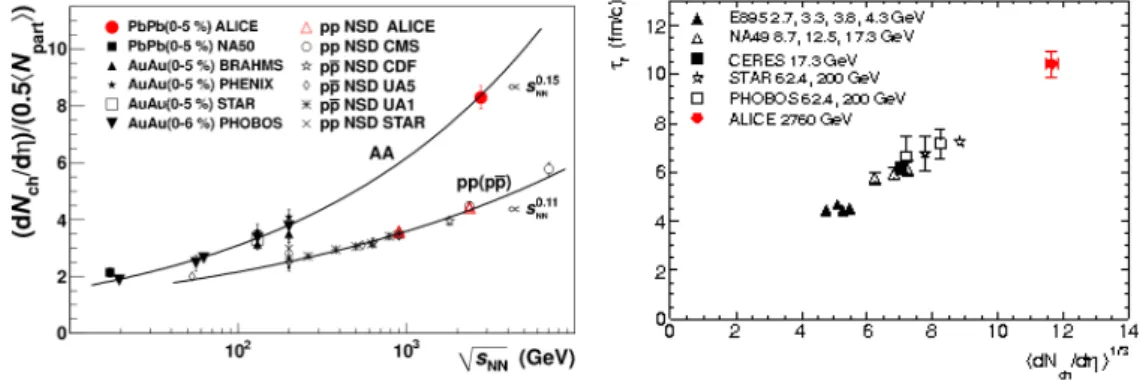
1.19 Left: charged particle pseudo-rapidity density per participant in cen-tral nucleus-nucleus and non-single diffractive pp (pp) collisions as a function of √sNN [112]. Right: decoupling time from ALICE (red
filled dot) compared to the one obtained for central Au–Au and Pb– Pb collisions at lower energies at the AGS, SPS and RHIC [113]. . . 30
1.20 v2(pt) from multi-particle methods in Pb–Pb collisions at √sNN =
2.76 TeV measured in ALICE [114], and compared with the results from the STAR experiment in different centrality classes. . . 31
1.21 Charged particleRAA as a function of pt up to100 GeV/c in Pb–Pb
collisions at √sNN = 2.76 TeV measured in the CMS experiment.
The results are compared with the RAA of π0 predicted by WHDG
calculations [115]. . . 31
2.1 Examples of Feynman diagrams: D+D− production in pp collisions
via gg→ cc (left panel) and D+→ K0µν
µ (right panel). . . 34
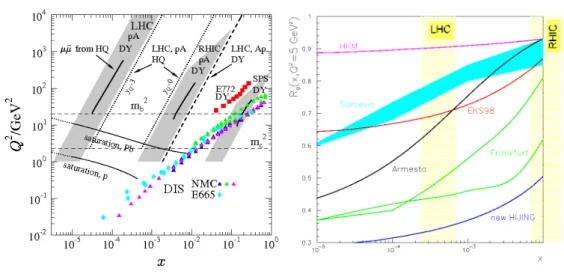
2.2 Left: parton distribution functions in proton from CTEQ 4L with Q2 = 5 GeV2 [41]. Right: Bjorken-x as a function of M2 for
par-ticle production in nucleon-nucleon collisions at the SPS, RICH and LHC. The lines correspond to constant rapidity at corresponding en-ergies [129]. . . 36
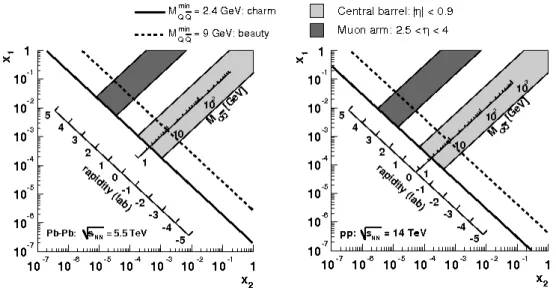
2.3 Accessible Bjorken-x range for heavy flavours in Pb–Pb collisions at √s
NN= 5.5 TeV (left) and in pp collisions at√s = 14 TeV (right) in
the rapidity range that can be measured with ALICE at the LHC [130]. 36
2.4 Enhancement factor R(pt, ∆y) for charm quarks (dashed lines) and
D (D0, D+) mesons (solide lines), withmc= 1.2 GeV/c2,Q2 = 4m2T
(left panel) andmc= 1.3 GeV/c2,Q2 = m2T (right panel) [132]. . . . 37
2.5 Upper plots: Distributions of different fragmentation functions for heavy quarks; middle plots: pt distributions of open heavy flavour
hadrons according to the corresponding fragmentation functions shown in the upper plots and comparisons with the pt distribution
of mother quark which is obtained from HvQMNR predictions [151] for beauty quarks; lower plots: ratios of different hadronpt
distribu-tions to the result obtained with the Peterson fragmentation function. Each case is shown with < z >= 0.9 (left), 0.8 (middle) and 0.666 (right) [152]. Note that in the figures< z > is expressed as < x > in the plots. . . 41
2.6 pt-differential cross section of open b-hadron production [161]
2.7 Differential cross section measurements for D-mesons in|y| < 1 as a function of pt with CDF II detector at the Tevatron (circles) [163].
The solid curves are the FONLL predictions [164], with the uncer-tainties indicated by the shaded bands. The dashed curve shown for D∗+ cross section is the theoretical prediction from Ref. [165] and the dotted lines indicate the corresponding uncertainty. . . 44
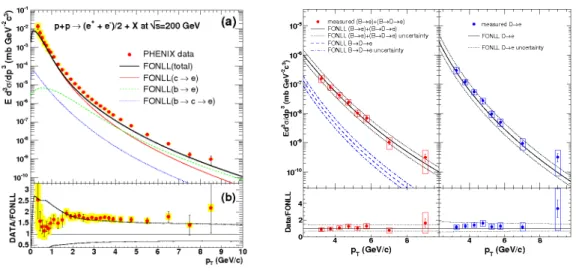
2.8 Left: (a) invariant differential cross sections of electrons from heavy flavour decays measured by PHENIX in pp collisions at √s = 200 GeV [166]. The curves are FONLL calculations [167]; (b) ra-tio of data and FONLL calculara-tions, upper (lower) curve shows the theoretical upper (lower) limit of the FONLL calculations. Right: invariant cross section of (e++ e−)/2 from beauty (upper-left) and
charm meson (upper-right) decays measured by the STAR collabo-ration in pp collisions at √s = 200 GeV, together with the ratio of the corresponding measurements to FONLL predictions for beauty (lower-left) and charm electrons (lower-right) [168]. . . 45
2.9 Collision geometry in the transverse plane. . . 46
2.10 Charm production cross section per nucleon-nucleon collision at mid-rapidity as a function ofNbin (orNcoll) measured at RHIC in Au–Au
collisions at √sNN= 200 GeV [177]. . . 49
2.11 Yield of hard process in Pb–Pb collisions relative to the cross section in nucleon-nucleon collisions, as a function of the impact parameter cutb < bc [41]. . . 49
2.12 Illustration of a smoothly matched RA
i function.. . . 50
2.13 Comparison of the average valence quark, sea quark, and gluon modi-fications atQ2 = 1.69 GeV2 (∼ m2
c) for a Pb nucleus, from LO global
DGLAP analyses: EKS98, nDS [187], HKN07, EPS08 and EPS09LO. 52
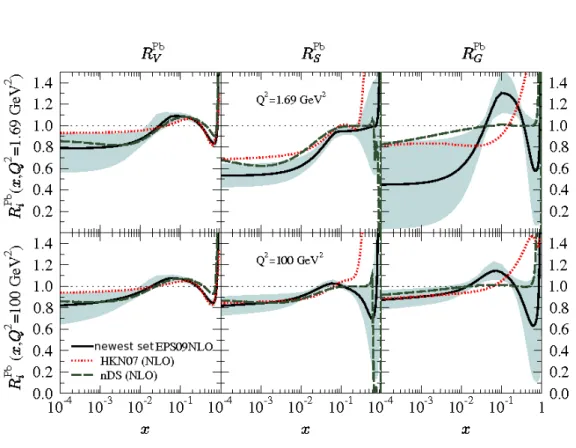
2.14 Same as Fig. 2.13, but for the comparison of NLO global DGLAP analyses: HKN07, nDS and EPS09 NLO at Q2 = 1.69 GeV2 (upper
panel) and100 GeV2 (lower panel). . . . . 53
2.15 Left: Average values of x and Q2 of the DIS data from NMC
(tri-angles) and E665 (diamonds), and ofx2 and M2 of Drell-Yan (DY)
dilepton data (squares). The heavy quark mass scales are shown by the horizontal dashed lines. Right: Ratios of gluon distribution func-tions from different models at Q2 = 5 GeV2. These two figures are
extracted from [188]. . . 54
2.16 Medium modified fractional energy loss versus Debye massµ in zeroth order opacity with Ter-Mikayelian Effect for up, charm and bottom quarks [195].. . . 55
2.17 Nuclear modification factor RAA of non-photonic electron measured
in d–Au and Au–Au collisions at √sNN = 200 GeV with the STAR
2.18 Nuclear modification factor and elliptic flow of non-photonic elec-trons measured in Au–Au collisions at √sNN = 200 GeV with the
PHENIX detector. The data are compared to predictions from dif-ferent Langevin based models (see text). Extracted from [202]. . . . 56
2.19 RAA of non-photonic electron measured in Au–Au collisions at
√s
NN= 200 GeV with the PHENIX experiment. The data are
com-pared with the predictions of the collisional dissociation model. Ex-tracted from [202]. . . 58
2.20 Prompt electron distribution measured in the10% most central Au– Au collisions at √sNN= 130 AGeV with the PHENIX detector [212]. 60
2.21 Theory comparison of non-photonic electron, v2, versus pt in Au–
Au collisions at √sNN = 200 GeV [202] measured with the PHENIX
detector [202], see the text for more details. . . 60
2.22 Production cross sections as a function of the center-of-mass energy for Pb–Pb collisions [221]. . . 62
2.23 The pt-differential production cross section (dσ/dpt) for charm
hadron (top left) and bueaty hadron (top left) in pp collisions at √
s = 14 TeV obtained from MNR predictions [151]. The correspod-ing botton plots show the components of the uncertainty from quark mass (mQ), parton density parametrisation (PDF), fragmentation
pa-rameter and the perturbative uncertainty from scale variations on the results [152].. . . 63
2.24 Heavy-to-light ratios for D mesons (upper plots) and B mesons (lower plots) with a realistic heavy quark mass (plots on the right) and for a case study in which the quark mass dependence of parton energy loss is neglected (plots on the left). Extracted from Ref. [222]. . . 64
2.25 Predictions of Rc
AA(pt)/RbAA versus pt at LHC energies from fully
weakly coupled pQCD calculations and strongly coupled AdS/CFT energy loss models [115]. . . 65
2.26 Ncoll (Npart) dependence of the charmed meson yield at mid-rapidity,
η = 0, and at forward rapidity, η = 2, in d–Au (Au–Au) collisions [190]. 66
2.27 Schematic representation of D0 → K−π+ decay with track impact
parameter d0 and pointing angleθpointing [41]. . . 66
2.28 Invariant-mass spectrum of D0 (left) and D+ (centre) candidates,
and invariant-mass difference, ∆m = m(Kππ)− m(Kπ), for D∗+ candidates (right) in pp collisions at √s = 2.76 TeV measured with ALICE [224]. . . 67
2.29 Upper: pt-differential cross section for prompt D0, D+, and D∗+
mesons in pp collisions at √s = 2.76 TeV [224] compared with the scaling of the ALICE measurement at √s = 7 TeV [225]. Bottom: ratio of the √s = 2.76 TeV cross section and the √s = 7 TeV
mea-2.30 Left: averageD0,D+andD∗+ mesonsR
AA in the0−7.5% centrality
class [227] and charged hadron and pionRAAin the0−10% centrality
class [228,229]. Right: v2 of D0,D+ and D∗+ mesons in centrality
30− 50% [230] compared to charged hadron v2 [231]. Results are
measured in Pb–Pb collisions at √sNN= 2.76 TeV with ALICE. . . . 68
2.31 Inclusive electron yield per minimum bias pp collision as function of pt at √s = 7 TeV in comparison with background electron cocktails
for the TOF/TRD-TOF analysis (left) and for the TPC-EMCal analysis (right). Lower panels show the ratio of the inclusive electron yield to the background electron cocktail. Results are mea-sured in pp collisions at √s = 7 TeV with ALICE [232]. . . 69
2.32 (a) pt-differential invariant cross sections of electrons from beauty
and from charm hadron decays. The solid (dashed) lines indicate the FONLL predictions [233] (uncertainties). Ratios of the data and the FONLL calculations are shown in (b) and (c) for electrons from beauty and charm hadron decays, respectively. (d) Measured ratio of electrons from beauty and charm hadron decays with error boxes depicting the total uncertainty. Results are measured in pp collisions at √s = 7 TeV with ALICE [234].. . . 70
2.33 pt-differentialRAA(left) andv2(right) of electrons from heavy flavour
decays in Pb–Pb collisions at √sNN = 2.76 TeV measured with
AL-ICE [235]. The results are compared with corresponding ones from PHENIX measurements [202]. . . 71
3.1 ALICE schematic layout.. . . 76
3.2 Primary vertex resolution in Pb–Pb collisions at √sNN = 2.76 TeV
as a function of half of the tracklets multiplicity of the event [248]. Data taken in 2010, see text for details. . . 81
3.3 Left: track prolongation efficiency in ITS for TPC tracks, for the request of ITS-refit only (black) and ITS-refit with at least a point in SPD (red); data from Pb–Pb collisions at √sNN = 2.76 TeV in
2010, MC results based on HIJING simulations. Right: transverse impact parameter resolution estimate as a function of pt for pions,
kaons, protons; data from pp collisions at√s = 7 TeV in 2010, MC corresponds to PYTHIA simulations with Perugia-0 configuration. . 83
3.4 Top: dE/dx of charged particles vs. their momentum, measured by the ITS alone (left) and TPC (right), the lines are a parameteriza-tion of the Bethe-Bloch curve. Bottom left: β vs. signed momen-tum in the TOF. Bottom right: HMPID Cherenkov angle vs. track momentum, continuous lines represent theoretical Cherenkov angle values vs. track momentum. The results correspond to pp collisions at √s = 7 TeV. . . 84
3.5 Left: charge deposit for electrons and pions at a momentum of 2 GeV/c, in pp collisions at √s = 7 TeV. Data (symbols) are com-pared with test beam measurements performed in 2004. Right: TPC dE/dx signal (in units of resolution) relative to the electron Bethe-Bloch lines (shown in the top right panel of Fig. 3.4) for 2 GeV/c tracks and 6 TRD tracklets, with and without electron tagging in the TRD, in pp collisions at √s = 7 TeV (2011 data). . . 85
3.6 Layout of the ALICE muon spectrometer. . . 88
3.7 Layout of front absorber.. . . 92
3.8 Schema of the beam shielding.. . . 93
3.9 Layout of dipole magnet of the muon spectrometer. . . 94
3.10 Layout of the tracking station2 (left) and 4, 5 (right). . . 95
3.11 General view of the GMS. The red lines present the optical lines. . . 96
3.12 Principle of muon track reconstruction. . . 97
3.13 Left: scheme of the muon trigger stations MT1 and MT2 with two planes of RPCs on both of them. Right: scheme of a Resistive Plate Chamber (RPC). . . 99
3.14 Sketch of the track transverse momentum determination by the AL-ICE muon spectrometer trigger system. . . 100
4.1 The overall architecture of the ALICE DAQ and the interface to the HLT system [237]. . . 106
4.2 The six architectural layers of HLT [237]. . . 108
4.3 Schematic view of the ALICE offline computing tasks in the frame-work of the tiered MONARC model. Taken from Ref. [273]. . . 110
4.4 Schematic view of AliRoot framework. . . 113
4.5 Data Processing Framework of AliRoot . . . 115
4.6 Schematic view of MUON analysis framework [282].. . . 116
4.7 Schematic view of the analysis tasks for the study of heavy flavours with muon data. . . 118
5.1 Single muon reconstruction efficiency as a function of pt and η. . . . 125
5.2 The single muon pt distributions (left) and unlike-sign dimuon Minv
distributions (right) from PDC06 after efficiency correction. . . 126
5.3 Reconstructed invariant mass distributions of correlated unlike-sign dimuons from beauty (left) and charm (right) decays in pp collisions at √s = 14 TeV. The different sources are displayed. . . 128
5.4 Reconstructed invariant mass distributions of correlated unlike-sign dimuons fromBBdiff channel (left) andDDdiffchannel (right) decay in
pp collisions at√s = 14 TeV. The sources corresponding to different pQCD NLO processes of heavy flavour production are shown. . . 129
5.6 Transverse momentum distributions (upper panels) used for the esti-mation of systematics uncertainties and ratios of these distributions to the nominal case (lower panels). Shown from left to right are, D-hadrons, hadrons, decay muons from D-hadrons and from B-hadrons. All distributions are presented in the acceptance of the ALICE muon spectrometer. . . 132
5.7 Example of combined fits obtained with biasedfc/bµ± shapes for single muon pt distribution (left) and with biasedfµ
−µ+
c/b shapes for
unlike-sign dimuon invariant mass distribution (right). The vertical error bars (smaller than the points for single muon channel) are the statis-tical ones. . . 132
5.8 Relative systematic uncertainty on the estimation of single muons from charm (left) and beauty (right) decay vs. pt. The different
curves correspond to different values of pQCD parameters. . . 133
5.9 Relative systematic uncertainty on the estimation of unlike-sign dimuons from charm (left) and beauty (right) decay vs. Minv. The
different curves correspond to different fc/bµ−µ+ biased shapes. . . 133
5.10 Illustration of FMC
µ←D/B(φµ, pmint ) calculation. . . 135
5.11 Dependence ofFMC
µ←B(left panel) andFµ←DMC (right panel) Monte-Carlo
scaling factors on pmin
t for selected muon pt bins and, for different
shapes of the B-hadron and D-hadronpt distributions. . . 136
5.12 B-hadron (left) and D-hadron (right) inclusive production differen-tial cross sections in pp collisions at √s = 14 TeV. The results are shown in the forward region: −4 < ηB(D) <−2.5. The histogram is the input distribution. The points correspond to the reconstructed results from single muon and dimuon channels, respectively. The ver-tical error bars (smaller than the symbols in most of cases) are the statistical ones. The height and width of the boxes represent the sys-tematic error from the fits and the uncertainty on the determination ofpmin
t , respectively. . . 137
5.13 Signal yield (left), signal over background ratio (middle) and sig-nificance (right) of the single muon contribution from beauty decay (upper panels) and charm decay (lower panels) for the three scenarios of data taking. . . 139
5.14 The same as Fig. 5.13, but for dimuons. . . 140
5.15 Left: ptdistribution of reconstructed tracks in the ALICE muon
spec-trometer in minimum bias pp collisions at √s = 14 TeV (PDC08 production); the yields corresponding to the different sources are also plotted. The data are corrected for reconstruction efficiency, for pt > 1 GeV/c. Right: the production mechanisms for different
muon track sources. . . 141
5.16 The some as Fig. 5.15 with the additinal requirements of track-trigger matching (left) and further cut on DCA< 9.3 cm (right). . . 142
5.17 pt distribution of reconstructed tracks in the ALICE muon
spectrom-eter in PDC08 with DCA< 9.3 cm are matched with the trigger tracks and muons from primary pion and kaon decays are subtracted. The contribution of muons from open heavy flavour decay contaminated with secondary muons from pion and kaon decays which is obtained by using the vertex method (blue histogram) is compared to the ex-pected distribution (red histogram). . . 143
6.1 Ratios of events in background triggers to that in CINT1B trigger as a function of the run number (data taking time). . . 146
6.2 Ratio of events triggered in CMUS1B with respect to that in CINT1B as a function of the run number (data taking time).. . . 146
6.3 The V0 leading time distributions in V0A (left) and V0C (right). The red band shows the time window for beam gas event, and the green band is the time window for beam-beam interaction events. . . 149
6.4 Event statistics in physics selection.. . . 149
6.5 Left: vzdistributions with and without applying the physics selection.
Right: distribution of number of contributors used for the primary vertex reconstruction. Results are obtained from the analysis of pp collisions at √s = 900 GeV collected in the end of 2009 with ALICE. 150
6.6 pt (top left), η (top right), trigger matching (bottom left) and DCA
(bottom right) distributions of reconstructed muon tracks with dif-ferent event selection conditions as labeled inside each plot. Results are from LHC09d data in pp collisions at √s = 900 GeV.. . . 152
6.7 DCA distribution of muon tracks without matching with trigger (left) and with matching with trigger (right) after the physics selection is applied to LHC09d data (pp collisions at√s = 900 GeV). The results are normalized to unit and compared with the ones from realistic simulations with PYTHIA and PhoJet, under the same conditions. . 154
6.8 DCA distributions of different muon track sources in simulations of pp collisions at √s = 900 GeV with PYTHIA (up) and PhoJet (down). The results are presented without matching with trigger (left) and with matching with trigger (right). The realistic detector effects of LHC09d data in pp collisions at √s = 900 GeV are included in the simulations. . . 154
6.9 Momentum p (left), pt (middle) andη (right) distributions of muon
tracks after the physics selection is applied to LHC09d data (pp col-lisions at√s = 900 GeV). The results are shown without the trigger matching (in blue) and with the trigger matching (in red), respectively.155
6.10 DCA versusη for tracks without trigger matching (left) and with trig-ger matching (right) after the physics selection is applied to LHC09d data (pp collisions at √s = 900 GeV). A sharp pt of 0.5 GeV/c is
6.11 Relative momentum resolution σp/p as a function of p of the tracks
reconstructed in the MUON spectrometer. Results are from the LHC09d data (pp collisions at√s = 900 GeV). . . 156
6.12 Composition of the front absorber of the ALICE muon spectrometer. 157
6.13 Left: σp/p as a function of Rabs, the corresponding π− θabs region
is mentioned. Right: same as Fig. 6.11, but tracks are separated in differentπ−θabs regions: 1
o
−2o (red),2o−3o (blue),3o−10o (green) and10o− 90o (purple).. . . 158
7.1 The ratios of the number of tracker tracks over trigger tracks (top), matched tracks over trigger tracks (middle) and matched tracks over tracker tracks (bottom) as a function of run number in LHC10c pe-riod. The black lines show the results in the minimum bias events (CINT1B) and the red lines are the results in the muon trigger events (CMUS1B). . . 164
7.2 Multiplicity of trigger tracks (top), tracker tracks (middle) and matched tracks (bottom) in minimum bias events from LHC10d. Re-sults are shown as a function of the run number. . . 165
7.3 Same as Fig. 7.2, but for muon trigger events in LHC10d. . . 166
7.4 Transverse momentum distributions of reconstructed muon tracks from the events with no identified pile-up vertex (blue) and from the tagged pile-up events (black). To compare the shapes of these two distributions, we scaled them together with the pt distribution
in the full event sample (red) according to the integrated yield given by the red line. These results are from the muon triggered events in run 124364 of LHC10d1 where the pile-up effect is large. . . 167
7.5 Same as the middle plot in Fig. 7.2, the tracker track multiplicity in minimum bias events from LHC10d. The results before the pile-up correction, black line, are compared with the one after the pile-up correction with Eq. (7.8), red line. . . 169
7.6 Transverse momentum (left) and η (right) distributions of muon tracks in minimum bias events (red) and in muon trigger events (blue) in pp collisions at √s = 7 TeV from LHC10c1. The ratios between the corresponding distributions in the minimum bias events and that in the muon trigger event are shown in the bottom panel. . . 171
7.7 The same as Fig. 7.6, but the distributions are from LHC10d2b.. . . 172
7.8 Normalized muon pt distribution in minimum bias events (labeled
as "MB data") and in muon trigger events (labeled as "MU data") with the pile-up correction in LHC10c1 and LHC10d2b, respectively. The results are shown as a function of pt (left) and η (left). The
normalization of muon trigger events is done with the multiplicity scaling method. . . 176
7.9 Transverse momentum distributions of muon track sources without any selection cut (left) and with the standard selection cuts (right) in pp collisions at√s = 7 TeV. Results from the LHC10f6a simulations with PYTHIA Perugia-0 tuning and realistic detector configurations correspond to LHC10d2b data sample. . . 177
7.10 Comparison between thept-shape of primary muons in totalη region,
−4 < η < −2.5 (red lines) and the sum from fit results in 5 pseudo-rapidity bins (blue lines). The results are obtained, under the same selection cuts applied to data, from realistic simulations of LHC10d4 (pythia, upper, left), LHC10d4a (PhoJet, upper, right), LHC10f6 (PhoJet, down, left) and LHC10f6a (PYTHIA, down, right). . . 179
7.11 Upper panels: normalized inclusive pt distributions in −4 < η <
−3.7 in the muon triggered data from LHC10c1 (left) and LHC10d2b (right) with respect to the number muon triggered events. The results are compared to thept distributions of inclusive muons and primary
muons in the corresponding realistic simulations. The simulations are scaled withSMC (Eq. 7.27), obtained in the sameη region before
normalization with the corresponding number of events applied in the data. Lower panels: ratio between the primary muons and inclusive muons in data and in Monte-Carlo for LHC10c1 (left) and LHC10d2b (right). . . 180
7.12 The same as Fig. 7.11, in −3.7 < η < −3.4. . . . 181
7.13 The same as Fig. 7.11, in −3.4 < η < −3.1. . . . 181
7.14 The same as Fig. 7.11, in −3.1 < η < −2.8. . . . 182
7.15 The same as Fig. 7.11, in −2.8 < η < −2.5. . . . 182
7.16 Uncorrected pt-differential production cross section of muons from
open heavy flavour decays in different η regions. Results from the minimum bias triggered data and muon triggered data in LHC10c1 and LHC10c2 are compared together. The systematics uncertainties are not yet shown. . . 184
7.17 Uncorrected η-differential production cross section of muons from open heavy flavour decays in pt > 2 GeV/c, obtained according to
Eq. (7.24). Results from the minimum bias triggered data and muon triggered data in LHC10c1 and LHC10c2 are compared. The system-atic uncertainties are not yet shown. . . 185
7.18 Estimate of σmodels (left column) and σnorm (right column) with
LHC10d2b in differentη regions, see text for more details. . . 186
7.19 The ratios of primary muons (left) and secondary muons (right) to the total muons in0 < pt< 1 GeV/c (the region we used to calculate
theRMC) in different simulations.. . . 187
7.20 The two-dimension efficiency correction matrices as a function of pt
7.21 The efficiency correction for the η (left) and pt (right) distributions
of muons from open charm hadrons in the ideal simulation with PYTHIA ATLAS tuning. The reconstructed distributions are labeled as "reco", the distributions after the efficiency correction are labeled as "corr" and the input distributions are labeled as "kine". The ratio between the corrected distributions and the input distributions are presented in the bottom panels. The correction matrix is built with the charm quark kinematics distributions from HvQMNR predictions as the simulation inputs and under the ideal detector configurations. 190
7.22 Same conditions as in Fig. 7.21, except muons from open beauty hadrons are used as input. . . 191
7.23 Same conditions as in Fig. 7.21, except taht total muon signals from both open charm and beauty hadrons are used as input. . . 192
7.24 The efficiency correction matrices made by muons from charm (left) and muons from beauty (right) with the inputs of HvQMNR pre-dictions. The realistic detector configurations corresponding to run 119159 in LHC10c1 are used for these simulations. . . 192
7.25 Results of efficiency correction in run 119159 from LHC10c1 for min-imum bias data (up) and muon triggered data (down), respectively. The efficiency matrix is built with muons from charm with the cor-responding realistic detector configurations, as shown in left plot of Fig. 7.24. . . 193
7.26 Results of efficiency correction in run 119159 from LHC10c1 for min-imum bias data (up) and muon triggered data (down), respectively. The efficiency matrix is built with muons from beauty with the cor-responding realistic detector configurations, as shown in right plot of Fig. 7.24. . . 193
7.27 Comparison of the corrected results in run 119159 from LHC10c1 with the correction matrices build by muons from charm (left plot of Fig. 7.24) and that with muons from bottom (right plot of Fig. 7.24), for the minimum bais triggered data (left) and muon triggered data (right), respectively. . . 194
7.28 The production cross sections of heavy quark pairs (left) and muons from heavy quark decays (right) from FONLL predictions in −4 < η <−2.5, in pp collisions at √s = 7 TeV. . . 195
7.29 The rescaled ratios of production cross sections with respect to the central values forcc (left) and bb (right) from FONLL predictions in −4 < η < −2.5, in pp collisions at√s = 7 TeV. . . 196
7.30 The correctedpt-differential production cross sections of muons from
open heavy flavour decays in LHC10c1, LHC10c2 and LHC10e, in different η regions. The results are compared with the FONLL pre-dictions. In each run period, only the muon triggered data are used. 198
![Figure 1.4: Left: energy density, ε/T 4 , versus temperature, T , with 2 light and 1 heavier (strange) quarks [39]](https://thumb-eu.123doks.com/thumbv2/123doknet/14657232.738851/59.892.136.730.61.386/figure-energy-density-versus-temperature-heavier-strange-quarks.webp)
![Figure 1.13: Hyperon production in Pb–Pb collisions normalized to the ratio from p–Be collisions as a function of centrality (expressed by < N wound >), measured in the NA57 experiment at the SPS [95].](https://thumb-eu.123doks.com/thumbv2/123doknet/14657232.738851/71.892.140.730.62.517/hyperon-production-collisions-normalized-collisions-centrality-expressed-experiment.webp)
![Figure 1.15: Left: R AA (p t ) of π 0 in central (0 − 10%) and peripheral (80 − 92%) Au–Au collisions at √ s NN = 200 GeV measured by the PHENIX experiment [96], the shaded hands represent the systematic uncertainties on normalization](https://thumb-eu.123doks.com/thumbv2/123doknet/14657232.738851/73.892.147.733.57.421/peripheral-collisions-measured-experiment-represent-systematic-uncertainties-normalization.webp)
![Figure 1.16: p/π + and p/π − ratios in d–Au [99, 100] and Au–Au [101] collisions measured by the STAR experiment at RHIC](https://thumb-eu.123doks.com/thumbv2/123doknet/14657232.738851/74.892.164.708.190.512/figure-ratios-au-collisions-measured-star-experiment-rhic.webp)
![Figure 1.18: Comparison of the integrated charged hadron elliptic flow as a function of centrality measured in the PHENIX experiment [109] and STAR experiment [110]](https://thumb-eu.123doks.com/thumbv2/123doknet/14657232.738851/76.892.163.754.66.504/comparison-integrated-elliptic-function-centrality-measured-experiment-experiment.webp)