HAL Id: tel-01061936
https://tel.archives-ouvertes.fr/tel-01061936
Submitted on 8 Sep 2014
HAL is a multi-disciplinary open access archive for the deposit and dissemination of sci-entific research documents, whether they are pub-lished or not. The documents may come from teaching and research institutions in France or
L’archive ouverte pluridisciplinaire HAL, est destinée au dépôt et à la diffusion de documents scientifiques de niveau recherche, publiés ou non, émanant des établissements d’enseignement et de recherche français ou étrangers, des laboratoires
Safety-critical systems
Jingyi Bin
To cite this version:
Jingyi Bin. Controlling execution time variability using COTS for Safety-critical systems. Hardware Architecture [cs.AR]. Université Paris Sud - Paris XI, 2014. English. �NNT : 2014PA112151�. �tel-01061936�
ECOLE DOCTORALE : Sciences et Technologie de l‘Information, des T´el´ecommunications et des Syst`emes
Institut d’Electronique Fondamentale (IEF) Thales Research & Technology - France (TRT) DISCIPLINE : Physique - Syst`emes Embarqu´es
TH`
ESE DE DOCTORAT
soutenance le 10/07/2014 par
Jingyi BIN
Controlling Execution Time Variability Using
COTS for Safety Critical Systems
Directeur de th`ese : Alain MERIGOT Professeur (IEF, Universit´e Paris-sud) Co-encadrant : Sylvain GIRBAL Ing´enieur (TRT)
Composition du jury :
Pr´esident : Daniel ETIEMBLE Professeur (Universit´e Paris-sud) Rapporteurs : Laurent PAUTET Professeur (LTCI, T´el´ecom ParisTech)
Michel AUGUIN Directeur de Recherche (Universit´e de Nice) Examinateurs : Alain MERIGOT Professeur (IEF, Universit´e Paris-sud)
Claire PAGETTI Charg´ee de recherche (ONERA) Sylvain GIRBAL Ing´enieur (TRT)
my parents were not with me in France during my PhD study, their words of encouragement and push for tenacity kept me moving on. They are always my most trusted supporters. My dear husband was
the one who has accompanied me everyday during these three years to share my happiness, anxiousness and depression. I feel so thankful to him for understanding me and helping me when I was
I would like to express the deepest appreciation to my PhD adviser– Professor Alain M´erigot who has given me constructive advices and guidances during my PhD study. In addition, he has shown a great patience and warm encouragements when my thesis did not move on smoothly. Without his constant help, I would not have finished my thesis.
I would like to give the most sincere appreciation to my co-adviser Dr. Sylvain Girbal and co-workers Dr. Daniel Gracia P´erez and Dr. Arnaud Grassat in Thales Research & Technology (TRT). All of them has helped me greatly in the technique domain of research and shown me serious, proactive altitude of researchers. Additionally, Sylvain taught me other professional capabilities, like making a simple and efficient slides ppt and a convincing presentation, which are also helpful in the future work.
I also would like to show my gratitude to the head of Embedded Systems Lab in TRT - Philippe BONNOT who has shown so much concern for my PhD progress and helped me a lot to adapt to the company’s affaires.
Besides, I would like to thank all the colleagues in Embedded Systems Lab in TRT. Without their help and concern, I would not have happily integrated into the group during these three years.
Last, I would like to thank all the commitee members of my defense: Prof. Daniel ETIEMBLE who accepted our invitation as the commi-tee president, Prof. Michel AUGUIN and Prof. Laurent PAUTET who gave thoughtful and detailed comments as my thesis reviewers, Dr. Claire PAGETTI who provided encouraging and constructive feedback as the examiner. I appreciate all of them for their questions and remarks during my thesis defense.
While relying during the last decade on single-core Commercial Off-The-Shelf (COTS) architectures despite their inherent runtime vari-ability, the safety critical industry is now considering a shift to multi-core COTS in order to match the increasing performance requirement. However, the shift to multi-core COTS worsens the runtime variability issue due to the contention on shared hardware resources. Standard techniques to handle this variability such as resource over-provisioning cannot be applied to multi-cores as additional safety margins will offset most if not all the multi-core performance gains. A possible solution would be to capture the behavior of potential contention mechanisms on shared hardware resources relatively to each applica-tion co-running on the system. However, the features on contenapplica-tion mechanisms are usually very poorly documented.
In this thesis, we introduce measurement techniques based on a set of dedicated stressing benchmarks and architecture hardware monitors to characterize (1) the architecture, by identifying the shared hard-ware resources and revealing their associated contention mechanisms. (2) the applications, by learning how they behave relatively to shared resources. Based on such information, we propose a technique to es-timate the WCET of an application in a pre-determined co-running context by simulating the worst case contention on shared resources produced by the application’s co-runners.
Contents . . . iv
List of Figures . . . viii
List of Tables . . . xii
Listings . . . xiii
Introduction . . . 1
A
Context
3
A.1 Context . . . 4A.1.1 Safety-critical Domain . . . 4
A.1.2 Worst Case Execution Time (WCET) . . . 4
A.1.3 Evolution of Architectures . . . 5
A.1.4 Challenge of Using Multi-cores for Safety-critical Applications 7 A.1.5 Objectives . . . 9
A.2 State of the Art . . . 10
A.2.1 WCET Analysis in Single-cores . . . 10
A.2.1.1 Static Analysis . . . 11
A.2.1.2 Measurement-based Analysis . . . 13
A.2.1.3 Commercial WCET Tools . . . 13
A.2.2 In-house Approach for the WCET Estimate . . . 16
A.2.3 COTS Approach for the WCET Estimate . . . 18
A.2.4 Performance Evaluation . . . 23
A.2.5 Conclusion . . . 24
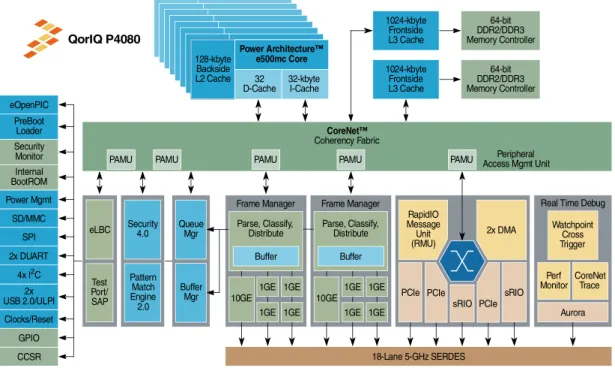
A.3 Target Platform - QorIQ P4080 . . . 27
A.3.1 Structure of the P4080 . . . 27
A.3.2 Hardware Monitors in the e500mc Core . . . 28
A.3.2.1 Performance Monitoring Example Using PMRs . . . . 30
A.3.3 Hardware Monitors in the Platform P4080 . . . 32
A.3.3.1 P4080 Memory Map Overview . . . 34
A.3.3.1.1 Local Address Map Example . . . 35
A.3.4 P4080 Configurations . . . 37
A.3.4.1 Cache Partitioning in the P4080 . . . 37
A.3.4.2 Compromise of Different Configurations . . . 38
A.3.5 Conclusion of Target Platform . . . 39
A.4 Software Environment - CodeWarrior . . . 41
A.4.1 Creating Projects in CodeWarrior . . . 41
A.4.2 Building Projects in CodeWarrior . . . 42
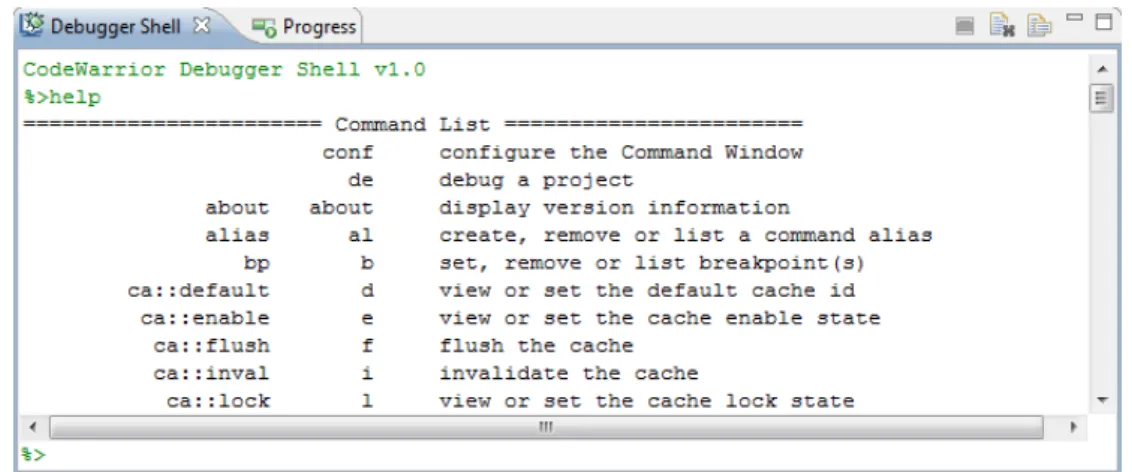
A.4.3 Debugging Projects in CodeWarrior . . . 45
A.5 Contribution . . . 46
B
Quantifying Runtime Variability
48
B.1 Overview . . . 49B.2 Applications under Study . . . 50
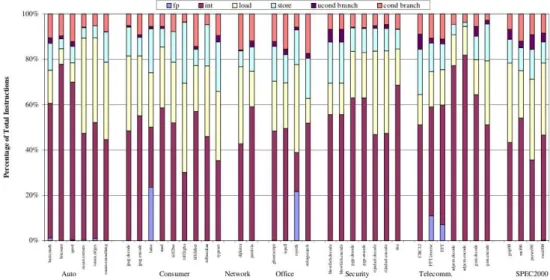
B.2.1 Applications from Mibench Suite . . . 50
B.2.2 Industrial Applications . . . 51
B.3 Resource Stressing Benchmarks . . . 53
B.4 Quantifying Runtime Variability . . . 55
B.4.1 Experimental Scenario . . . 55
B.4.2 Representing Runtime Variability Using Violin Plots . . . 55
B.4.3 Quantification Using Stressing Benchmarks . . . 56
C
Architecture and Application Characterization
59
C.1 Characterization Methodology . . . 60 C.2 Measurement Techniques . . . 62 C.2.1 Hardware Monitors . . . 62 C.2.2 Stressing Benchmarks . . . 63 C.3 Experimental Setup . . . 65 C.3.1 Architecture Characterization . . . 65C.3.1.1 Identifying Shared Hardware Resources . . . 65
C.3.1.2 Identifying Undisclosed Features and the Shared Re-source Availability . . . 66
C.3.1.3 Identifying the Optimal Configuration . . . 66
C.3.2 Application Characterization . . . 67
C.3.2.1 Identifying Sensitive Shared Resources . . . 68
C.3.2.2 Capturing the Shared Resource Usage . . . 68
C.3.2.3 Determining Possible Co-running Applications using Resource Usages . . . 68
C.3.3 Design Space . . . 68
C.4.1 Measurement Framework . . . 70
C.4.2 Synchronization of Multi-cores Using the Interprocessor Inter-rupt (IPI) . . . 71
C.4.2.1 Use of the Interprocessor Interrupt . . . 71
C.4.2.2 Framework of Synchronizing Hardware Monitor Col-lections Using IPI . . . 73
C.4.3 Software Development Using CodeWarrior . . . 74
C.4.3.1 Automating the Debugging Session for a Single Exper-iment within CodeWarrior . . . 74
C.4.3.2 Automating Experiments outside CodeWarrior . . . . 75
C.4.3.2.1 Generation Process . . . 76
C.4.3.2.2 Configuration Process . . . 77
C.4.3.2.3 Execution Process . . . 77
C.5 Architecutre Characterization Results . . . 80
C.5.1 Identifying Shared Hardware Resources . . . 80
C.5.2 Identifying Undisclosed Features . . . 81
C.5.3 Identifying the Optimal Configuration . . . 84
C.5.4 Selecting the Adequate Mapping . . . 87
C.5.5 Quantify the Shared Resource Availability . . . 88
C.6 Application Characterization Results . . . 95
C.6.1 Optimal Number of Iterations to Capture Variability . . . 95
C.6.2 Identifying the Sensitivity to Shared Resources . . . 96
C.6.3 Capturing the Shared Resource Usage . . . 98
C.6.4 Determining Possible Co-running Applications using Resource Usages . . . 99
C.7 Conclusion . . . 100
D
Alternative technique to Estimate the WCET
102
D.1 WCET Estimation Methodology . . . 103D.2 Experimental Setup . . . 105 D.2.1 Experimental Scenario . . . 105 D.2.2 Measurement Techniques . . . 105 D.2.2.1 Hardware Monitors . . . 105 D.2.2.2 Stressing Benchmarks . . . 106 D.3 Global Signature . . . 107
D.3.1 Defining Global Signatures . . . 107
D.3.2 Using Global Signatures . . . 108
D.3.3 Limitation of Global Signatures . . . 111
D.4 Local Signature . . . 113
D.4.1.1 Collecting Local Signatures Using Fixed-Interval Timer
(FIT) . . . 113
D.4.1.1.1 Implementing the FIT Interrupt . . . 113
D.4.1.1.2 Collecting Local Signatures . . . 114
D.4.2 Using Local Signatures . . . 121
D.5 Conclusion . . . 125
E
Conclusion
127
E.1 Conclusion . . . 128E.2 Future work . . . 131
F
Appendix
133
Source Code of Stressing benchmark . . . 134TCL Script of Automating Debugging Session . . . 136
Python Script of Automating Experiments . . . 138
A.1.1 Estimation of the Worst-Case Execution Time, and the over-estimation
problem . . . 5
A.1.2 Evolution of architecture and corresponding average time and WCET 6 A.1.3 Evolution of code size in space, avionic and automotive embedded systems . . . 7
A.2.1 Basic notions related to timing analysis. The lower curve repre-sents a subset of measured executions. Its minimum and maximum are the minimal observed execution times and maximal observed execution times. The darker curve, an envelope of the former, rep-resents the times of all executions. Its minimum and maximum are the best case and worst case execution times, abbreviated BCET and WCET. . . 11
A.2.2 Workflow of aiT WCET analyzer. . . 14
A.3.1 Freescale P4080 block diagram . . . 28
A.3.2 The flowchart of using PMRs . . . 33
A.3.3 Local address map example . . . 36
A.4.1 Various pages that the CodeWarrior Project wizard displays. (a) Project name and location page, (b) Processor page, (c) Build set-tings page, (d) Launch configuration page, (e) Hardware page and (f) Trace configuration page. . . 44
A.4.2 The Debugger Shell view. . . 45
B.2.1 Distributions of main classes of instructions for each Mibench bench-mark. . . 51
B.4.1 Example of violin plot to represent runtime distribution of two dif-ferent applications . . . 56
B.4.2 Runtime variability over 600 iterations of reference applications running (a) standalone, (b) concurrently with 2 benchmarks stress-ing the shared memory path, and (c) concurrently with 7 bench-marks stressing this resource. . . 58
C.1.1 Overview of the analysis process . . . 60
C.2.1 The cache access pattern with different STRIDE (one cache line=64bytes) 64
C.3.1 Selected configurations of P4080 (a) single controller non-partitioned, (b) single controller partitioned, (c) dual controller non-partitioned and (d) dual controller partitioned. . . 67
C.4.1 Examples of using doorbell. Top: single core to single core; Bottom: single core to multi-cores . . . 72
C.4.2 The framework of synchronizing hardware monitor collections. . . 74
C.4.3 The flowchart of automating debugging session of a single experi-ment within CodeWarrior. . . 75
C.4.4 The flowchart of automating experiments outside CodeWarrior. . . 79
C.5.1 The runtime variability of the core #1 while 8 co-running L1 data cache stressing benchmarks, 8 co-running L2 cache stressing bench-marks and 8 co-running L3 cache stressing benchbench-marks. . . 81
C.5.2 Runtime variability while mapping three instances of a stressing benchmark on different cores. . . 82
C.5.3 Three types of mapping under the 4-core cluster effect. . . 83
C.5.4 Runtime variability of one of the stressing benchmarks while vary-ing the number of co-runnvary-ing instances. . . 86
C.5.5 Comparing the runtime variability of different balancing techniques. 87
C.5.6 Performance slowdown versus CoreNet load to identify CoreNet maximum bandwidth and saturation behavior. (a) Total CoreNet load while running 2 co-runners in the 1st cluster, (b) Total CoreNet load while running 3 co-runners in the 1st cluster, (c) Total CoreNet load while running 4 co-runners in the 1st cluster . . . 90
C.5.7 Performance slowdown versus CoreNet load while 4 co-runners bal-anced in two clusters to identify CoreNet topology. (a) Performance slowdown versus total CoreNet load, (b) Performance slowdown versus CoreNet load of Cluster1. . . 91
C.5.8 Performance slowdown versus CoreNet load while 6 co-runners bal-anced in two clusters to identify CoreNet topology. (a) Performance slowdown versus total CoreNet load, (b) Performance slowdown versus CoreNet load of Cluster1. . . 91
C.5.9 Performance slowdown versus CoreNet load while 8 co-runners bal-anced in two clusters to identify CoreNet topology. (a) Performance slowdown versus total CoreNet load, (b) Performance slowdown versus CoreNet load of Cluster1. . . 92
C.5.10 Runtime variability versus DDR controller accesses to identify each DDR controller maximum bandwidth . . . 94
C.6.1 Runtime variability collected with different number of iterations for application Adpcm. . . 96
C.6.2 The sensitivity of applications to (a) the CoreNet, (b) the DDR. . 97
C.6.3 Performance slowdown with difference number of co-running AD-PCM. . . 99
D.1.1 The upper bound estimation methodology. . . 103
D.3.1 Evaluating the global signatures against the performance slowdown induced by co-running with 3 instances of ADPCM, CRC32, FFT, SHA, patricia, susan, airborne radar, pedestrian detection versus their equivalent stressing benchmarks. Blue violin plots represent the runtime variability while co-running with stressing benchmarks. The red marks denote the maximum runtime while co-running with the original applications. . . 110
D.3.2 The example showing limitations of global signatures. . . 112
D.4.1 The mechanism of collecting local signatures using the FIT interrupt.115
D.4.2 Variation of the number of CoreNet transaction per cpu cycle dur-ing ADPCM full run usdur-ing time slot (a) T, (b) T/2, (c) T/4 and (d) T/8. The black line denotes the mean value of the CoreNet transaction per cpu cycle. . . 116
D.4.3 Variation of the number of CoreNet transaction per cycle during the full run of (a) ADPCM, (b) CRC32, (c) FFT, (d) SHA, (e) Patricia, (f) Susan, (g) Airborne radar, (h) Pedestrian detection. The black line denotes the mean value of the collected metric. . . . 118
D.4.4 Variation of the number of DDR read per cycle during the full run of (a) ADPCM, (b) CRC32, (c) FFT, (d) SHA, (e) Patricia, (f) Susan, (g) Airborne radar, (h) Pedestrian detection. The black line denotes the mean value of the collected metric. . . 119
D.4.5 Variation of the number of DDR write per cylce during the full run of (a) ADPCM, (b) CRC32, (c) FFT, (d) SHA, (e) Patricia, (f) Susan, (g) Airborne radar, (h) Pedestrian detection. The black line denotes the mean value of the collected metric. . . 120
D.4.6 Evaluating the local signatures against the performance slowdown induced by co-running with 3 instances of ADPCM, CRC32, FFT, SHA, patricia, susan, airborne radar, pedestrian detection versus their equivalent stressing benchmarks. Blue violin plots represent the runtime variability while co-running with stressing benchmarks. The red marks denote the maximum runtime while co-running with the original applications. . . 123
A.3.1 Freescale P4080 specifications . . . 29
A.3.2 e500mc Performance Monitor Registers . . . 30
A.3.3 Instructions for reading and writing the PMRs . . . 30
A.3.4 Event types . . . 30
A.3.5 Some performance monitor event selection of the e500mc . . . 31
A.3.6 Local Access Window Setting Example . . . 36
A.3.7 Four configurations of P4080 . . . 40
A.4.1 Description of ecd.exe tool command build . . . 44
C.2.1 The main events used in the characterization . . . 62
C.3.1 Order of magnitude of the design space . . . 69
C.5.1 Worst execution times (in ms) for the monitored core while varing the number of running benchmarks. . . 86
C.6.1 CoreNet and DDR loads of standalone application . . . 98
D.3.1 Global signature of target applications . . . 107
D.3.2 Evaluating global signature accuracy in terms of over-margin value and upper-bounding ability. . . 111
D.4.1 Stressing benchmarks identified with local signatures . . . 121
D.4.2 Evaluating local signature accuracy in terms of over-margin value and over-bounding ability. . . 124
A.3.1 Example code of using PMRs . . . 31
A.3.2 CPC1 partitioning example . . . 38
C.2.1 General framework of memory-path stressing benchmarks . . . 63
C.4.1 Measurement framework using hardware monitors . . . 70
C.4.2 Example of framework of scenario generation process . . . 76
1 Example source code of stressing benchmark . . . 134
2 Example TCL script of automating debugging session . . . 136
In recent years, most of the research in computer architectures has concentrated on delivering average-case performance, but high performance is not the only criterion for some type of applications. For example, hard real-time systems have to satisfy stringent timing constraints, which needs a reliable guarantee based on the Worst Case Execution Time (WCET) to make sure that required deadlines can be respected. Missing deadlines may cause huge damages and loss of lives in safety-critical systems, like the avionic, healthcare and so forth. As a consequence, the performance predictability is more required than high performance in the safety-critical domain.
However, considering the increasing processing performance requirement in safety-critical industries, the next generation architectures have to guarantee the predictability while providing the sufficient average performance. Based on this point, multi-core Commercial Off-The-Shelf (COTS) architectures are considered as an appropriate candidate to provide a long-term answer to the increasing per-formance demand with an acceptable power consumption and weight. In addition, compared to in-house solutions which aim at proposing new predictable architec-tures, COTS solutions have lower Non-Recurring-Engineering (NRE) costs and shorter Time-To-Market (TTM).
Despite above advantages of multi-core COTS architectures, they have a critical issue to the safety-critical domain - reduced predictability due to the contention of co-running applications on shared hardware resources within multiple cores, like the interconnect bus and the memory. There are thus many related on-going researches concentrating on estimating the performance variabil-ity by analysing the interference on concurrent shared resources. Since multi-core COTS are inherently very complex with some undisclosed contention mechanisms and the behavior of applications on shared resources is also a gray- or black-box to users, the variability estimation is very difficult in such circumstance.
In the thesis, we proposed two approaches to overcome the difficulty for the overall objective - estimate the execution time variability of co-running safety-critical applications on a multi-core COTS architecture. We first presented a methodology characterizing the underlying architecture and applications to learn
undisclosed hardware features, especially the contention mechanisms on shared resources, and to master how an application behaves relatively to shared re-sources. Based on the characterized information, we then proposed an alterna-tive technique to estimate the WCET of an application when it ran with a set of pre-determined applications by simulating the worst case contention on shared resources produced by co-runners. Compared to the state of the art using the measurement-based approach, our approach can provide a tighter estimation of the execution time upper bound.
To clearly present the proposed approaches, the remaining thesis is organised as below:
• Part A - Context: Present the research context, the state of the art, our target architecture platform with the corresponding software environment and our contributions.
• PartB- Quantifying Runtime Variability: Demonstrate the variability that an application may experience while co-running with others due to the con-tention on shared hardware resources in multi-cores. To better understand the organized experiments, we also present our used applications and stress-ing benchmarks.
• Part C - Architecture and Application Characterization: Present first the characterization methodology, and second the measurement techniques, and third experimental setup with all the experiment designs and implementa-tions, and fourthly the experimental results which are splitted into the architecture section and the application section.
• Part D - Alternative Technique of WCET: Present first the methodology, and second the measurement techniques, and third the two detailed esti-mation methods with experimental results.
• PartE- Conclusion: Conclude the achievements throughout the thesis and propose some constructive future work based on the estimation results.
Context
A.1.1
Safety-critical Domain
Safety-critical domains [6] such as the avionic, automotive, space, healthcare or robotic industry are characterized by stringent hard real-time constraints which are usually defined as a set of deadlines to respect. To ensure the correct func-tionality of a safety-critical application, we should make sure that such application can finish its execution before a required dealine. Missing a single deadline may have some catastrophic consequence (i.e. the air crash and the explosion in a nuclear station) on the user or the environment and should be avoided at all cost. Therefore, the time predictability is a major concern instead of deliv-ering high average performance. In order to ensure that an critical application can finish execution before its required deadline, we usually determine its Worst Case Execution Time(WCET) which has to be guaranteed shorter than this deadline.
A.1.2
Worst Case Execution Time (WCET)
A real-time system consists of a number of tasks and each task typically shows a certain variation of execution times depending on the input data or different behavior of the environment. The WCET of a task is defined as its longest execution time. In most cases, it is quite impossible to exhaustively explore all possible execution times and thereby determine the exact WCET.
Today, there are some practical methods to compute the WCET. In single-core architectures, this WCET computation usually relies on analysis tools based on static program analysis tools [38, 27], detailed hardware model, as well as measurement techniques through execution or simulation [15]. However, these analysis techniques and tools are not currently able to provide an exact
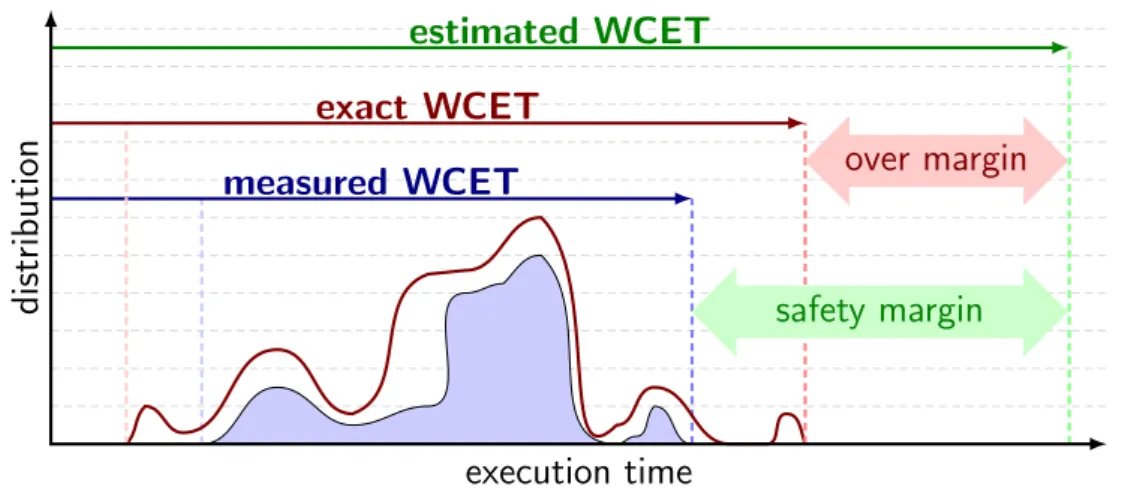
computa-tion of the WCET, especially for multi-cores, only delivering an estimated upper bound, introducing some safety margins as depicted in Figure A.1.1.
execution time
d
is
tr
ib
u
ti
on
measured WCET
exact WCET
estimated WCET
safety margin
over margin
Figure A.1.1: Estimation of the Worst-Case Execution Time, and the over-estimation
problem
In Figure A.1.1, the red curve is the real execution time distribution, and the blue one represents measured execution time distribution observed during experiments. As we explained above that it is quite impossible to exhaustively explore all possible execution times through experiments, the real distribution is thereby an envelope of the measured one. That’s why the measured WCET is shorter than the real one in FigureA.1.1. In order to make a sure over-bound the real WCET, we add a safety margin to the measured WCET to get estimated WCET which is used to compare with a pre-determined deadline.
A.1.3
Evolution of Architectures
The evolution of architectures is mainly targeting the consumer electronic market that represents 97% of the overall market. As this consumer electronic market is mostly driven by best-effort performances, the design complexity has increased by integrating more and more high-performance techniques into architectures. Figure A.1.2 shows the evolution of architectures and how the average time and the WCET vary according to such evolution.
A cache is a smaller, faster memory physically existing between the CPU and the memory to temporarily store the copy of data so that future request for that data can be served faster. Most modern CPUs have multiple independent levels of cache with small fast caches backed up by larger, slower caches to deal with a fundamental tradeoff between cache latency and hit rate.
Figure A.1.2: Evolution of architecture and corresponding average time and WCET
A pipeline is a concept inspired from assembly line where a set of processing elements are connected in series so that they can be arranged in parallel. Pipelin-ing doesn’t decrease the processPipelin-ing time of a sPipelin-ingle instruction, but it can apply the parallelism among a series of instructions to increase the throughput of CPUs. Based on pipelining, a superscalar pipeline further increases the CPU throughput by executing more than one instruction during a clock cycle by simultaneously dispatching multiple instructions to redundant functional units on the processor. In addition, an out-of-order execution can make use of instruction cycles which would be wasted because of some types of operations with costly delay. For ex-ample, a processor can avoid being idle while data read from memory for the next instruction.
From the early 2000s, considering higher-clock-speeds-produced exponential increasing thermal and power dissipation along with design complexity increases in single-cores, processor design trends shifted to multi-cores. The motivation of multi-cores design is the parallelism of processors that can address the issue
of power while maintaining performance where higher data throughput may be achieved with lower voltage and frequency.
Thanks to above techniques, the average time decreased step by step in the blue right column of FigureA.1.2. Compared to the average time, the WCET time decreased much slower due to the runtime variability source brought by above design techniques, like cache misses, structural or data hazards during pipeline executions and the contention on shared hardware resources in multi-cores and so forth.
A.1.4
Challenge of Using Multi-cores for
Safety-critical Applications
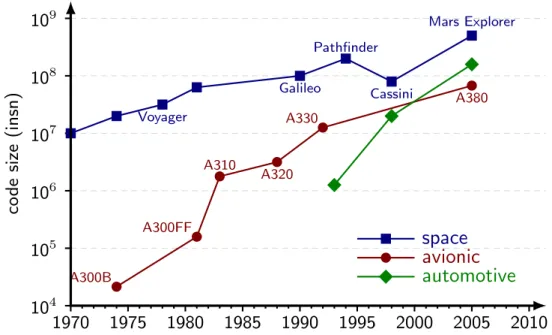
Figure A.1.3 shows the roadmap of code size in safety-critical industries where the code size of avionics increased from 104 magnitude in 1970s upto 107 in 2000s.
This exponential increase of code size implicates the exponential needs in perfor-mance and functionalities [1, 6, 5] in the industries. To match the performance requirement, multi-cores have been considered as a potential platform candidate taking account of their increasing average performance.
1970 1975 1980 1985 1990 1995 2000 2005 2010 104 105 106 107 108 109 A300B A300FF A310 A320 A330 A380 Voyager Galileo Pathfinder Cassini Mars Explorer co d e si ze (i n sn )
space
avionic
automotive
x
Figure A.1.3: Evolution of code size in space, avionic and automotive embedded
systems
However, as multi-cores are mostly driven by the consumer electronic market which aims at best-effort performances, the use of multi-cores will make
safety-critical industries to face more and more runtime variability issues while offer-ing the increasoffer-ing performance.
Shared Resource Problem In nowaday multi-cores, each core has its private resources, like L1 D/I caches, but all the cores usually share the last level cache and the same main memory through a common interconnect bus.
If users run several applications independently in different cores in a multi-core, such applications have to share the same hardware resources, like the in-terconnect bus and the memory, even though they do not communicate the data with each other. For example, two applications want to access to the interconnect at the same time, the interconnect has to decide which one should go first. The interconnect arbitration may add a delay to both application’s execution time. This delay thus results in the runtime variability.
Despite all the improvements in the WCET estimation domain [19, 10] over the last decades, the over-estimation remained mostly constant as the predictabil-ity of the architecture decreased [38], thus making the use of WCET analysis tools difficult for real industrial programs running on multi-core architectures [18, 21]. Possible interference on shared hardware resources among co-running tasks sig-nificantly increases the complexity of timing analysis, forcing it to have a full knowledge of co-running tasks at software level, and detailed resource contention models at hardware level. Unfortunately, the underlying multi-core architecture and co-running applications both usually behave as a gray- or black-box to users.
Undisclosed Hardware Feature Problem Embedded architectures come with detailed ISA and block diagram, but many aspects of the micro-architecture remain undisclosed such as the exact SoC network topology, contention, ar-bitration and prefetcher mechanisms. If such information is not necessary to guarantee correct functional behavior, it could have a significant impact on the timing behavior, that is as much important for safety-critical real-time sys-tems. For instance, the Freescale QorIQ platform P4080 presented in chapter
A.3 has no information about the exact behavior and the topology of its shared interconnect. Since the lack of the understanding about contention mechnisms of these important resources which can be potential performance bottlenecks in the context of co-running applications, we are hardly able to predict the perfor-mance variability derived from the contention on these shared resources. As a consequence, black-box multi-cores prevent users to accurately understand and predict co-running application behavior/performance on it.
In addition to architectures, co-running applications are also black-box. We do not know how a standalone application behaves on shared hardware resources, not to mention the interference of co-running applications on shared resources.
A.1.5
Objectives
Considering the challenge of using multi-cores to estimate the runtime variability of co-running safety-critical applications, we proposed two approaches in this thesis to:
• Characterize the underlying architecture to discover its undisclosed features, especially the shared resource related mechanisms and characterize target applications to observe their behavior on shared resources.
• Estimate the execution time upper bound of co-running applications based on the information of characterizations.
State of the Art
In this chapter, we present first the WCET analysis on single-cores to introduce static and measurement based techniques computing upper bounds on execu-tion times. Second, we present several representative proposals about designing new architectures with less runtime variability. Third, we detail some work on the WCET estimation using multi-core Commercial Off-The-Shelf (COTS) ar-chitectures. Last, we present different methods of performance evaluation which provides the behavior information of applications, allowing users to apply during the WCET estimation.
A.2.1
WCET Analysis in Single-cores
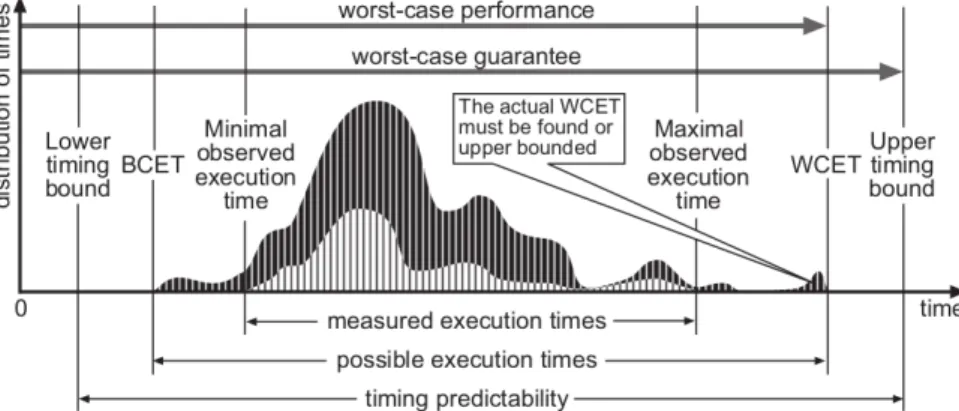
Hard real-time systems need to satisfy stringent timing constraints [1, 6, 5]. In general, upper bounds on the execution time are needed to show the satisfaction of these contraints. Figure A.2.1proposed in [38] by Wilhelm et al. facilitate the understanding of timing analysis by depicting some real-time properties.
A real-time system consists of a number of tasks and each task typically shows a certain variation of execution times depending on the input data or different behavior of the environment. The upper curve refers to the distribution of all the possible execution times of a task where the BCET (Best Case Execution Time) and the WCET (Worst Case Execution Time) are respectively the shortest ex-ecution time and the longest exex-ecution time. Most of the time, the BCET and WCET can not be accurately determined by exhausting all the possible execu-tions. Therefore, the industries usually measure the end-to-end execution times of a task only for a partial set of all the possible executions to estimate the exe-cution time bound. This measured exeexe-cution time distribution is depicted by the lower curve in Figure A.2.1 where we have the minimal observed execution time which usually overestimates the BCET and the maximal observed execution time
which usually underestimates the WCET. The upper and lower timing bounds are computed by the methods exploring all the possible executions. The upper bound provides the worst case guarantee to envelope the worst case performance. There are thus two criteria for timing analysis methods:
• Safety: Making sure that the WCET is greater than any possible execution time.
• Tightness: Keeping the real worst case execution time close to the upper bound. A large overestimation implies a great resource over-provision.
Figure A.2.1: Basic notions related to timing analysis. The lower curve represents a
subset of measured executions. Its minimum and maximum are the minimal observed execution times and maximal observed execution times. The darker curve, an envelope of the former, represents the times of all executions. Its minimum and maximum are the best case and worst case execution times, abbreviated BCET and WCET.
To compute the WCET on single-core processors [38,18], two main classes of methods have been adopted: the static analysis and the measurement-based analysis (dynamic timing analysis).
A.2.1.1
Static Analysis
Static analysis methods [38] perform some analysis on the application code to extract possible control flow paths which are then combined with an abstract model of the system to compute the upper bound of all the execution times. This analysis do not rely on executing code on real hardware or on a simulator. Therefore, static methods are able to produce bounds allowing safe schedulability analysis of hard real-time systems. There are three key components in static methods:
• Control-flow Analysis
The purpose of control-flow analysis is to determine all the possible exe-cution paths of a task under analysis. The input of this analysis can be the task’s control flow graph (CFG), call graph and some additional infor-mation such as maximum iterations of loops and so forth. We can finally obtain the actually feasible paths, including the conditional dependencies by eliminating infeasible and mutually exclusive paths. All the flow infor-mation performs as behavioral contraints of the task. There are different matured techniques to automate the flow analysis, like the pattern match-ing method, Bound-T method for loops analysis. The result of control-flow analysis is an annotated syntax tree for the structure- based approaches in the bound calculation, and a set of flow facts about the transitions of the control-flow graph. These flow facts are translated into a system of con-straints for the methods using Implicit Path Enumeration (IPET) in the bound calculation.
• Processor-behavior Analysis
The execution time of a task depends on the selected hardware behavior, like the pipeline structure, historical states of the cache and the arbitration mode of the bus, which can be derived from the abstract processor model, the memory hierarchy and the interconnect bus. The abstract processor model depends on the class of used processor. For some simple processors without the pipeline and caches, the timing construction is simple to ab-stract. Even for processors with a simple scalar pipeline, maybe a cache, the abstract also can be achieved by analyzing different hardware features separately, since there are no timing anomalies. However, for complex pro-cessors, some high performance enhancing techniques prevent to create the timing construction. For example, out-of-order executions produce timing anomalies making a cache hit resulting in a longer execution time than a cache miss, which can be hardly modeled. Most approaches use Data Flow Analysis, a static program-analysis technique, to get static knowl-edge about the contents of caches, the occupancy of functional units and processor queues, and of states of branch-prediction units.
• Bound Calculation
The purpose of this phase is to compute an upper bound of all execution times of the whole task based on the flow and timing information derived in the previous phases. There are three main classes of methods proposed in literature: structure-based, path-based, and techniques using Implicit Path Enumeration (IPET). In the structure-based method, the annotated syntax tree derived in the flow analysis is traversed from bottom to up to
first determine the execution time bound of each basic block and second combine all the computed bounds to deduct the upper bound of the whole task. The path-based calculation is to find the longest execution path based on the CFG with timing nodes derived in previous phases to determine the upper bound. In IPET, the flow of a program is modeled as an assignment of values to execution count variables. The values reflect the total number of executions of each node for an execution of the task. Each entity with a count variable also has a time variable giving the contribution of that part of the program to the total execution time. The upper bound is computed by maximizing the sum of products of count variables and time variables. Although the static analysis can offer a sound and safe bound, there are some limitations during the processor-behavior analysis. First, the contention on shared resources can not be accurately modeled. In addition, the knowledge of the hardware is usually limited for users. As a consequence, the measurement-based analysis is proposed to overcome it.
A.2.1.2
Measurement-based Analysis
Measurement-based methods [38] replace the processor-behavior analysis in the static methods by performing measurements on the target hardware (or a detailed simulator) to estimate the WCET. This analysis usually measures the execution times of code segments, typically of CFG basic blocks. As in the static analysis, the measurement-based analysis also use the control flow analysis to find all possible paths and then use the bound calculation to combine the measured times of the code segments into an overall time bound.
However, the measured execution times of basic blocks would be unsafe if only a subset of input data or initial states were considered. Unsafe execution times may produce an unsafe upper bound which can not be accepted by safety-critical industries but can be used to provide a picture of the actual variability of the execution time of the application.
A.2.1.3
Commercial WCET Tools
aiT aiT WCET Analyzer is the first software tool of the well-known statical industiral tool AbsInt [9] designed in the IST project DAEDALUS according to the requirements of Airbus France for validating the timing behavior of critical avionic software, including the flight control software of the A380, the worlds largest passenger aircraft. The purpose of aiT tool is to obtain upper bounds for the execution times of code snippets (tasks) in executable by statically analyzing a tasks intrinsic cache and pipeline behavior based on formal cache and pipeline models.
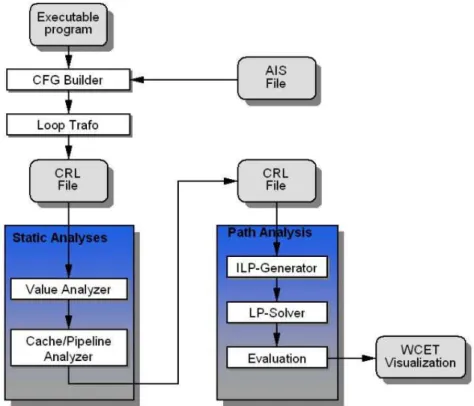
The workflow of aiT is shown in FigureA.2.2 proposed in [38]. The analysis is composed of three main steps: 1) Reconstruct CFG from the given executable program and then translate the CFG into CRL (Control Flow Representation Language, a human-readable intermediate format designed to simplify analysis and optimization at executable/assembly level) served as input of the next step. 2) Value analysis determines potential values in the processor registers for any possible program point. The analysis results are used to identify possible ad-dresses of memory accesses for cache analysis, to determine infeasible paths re-sulting from conditions being true or false at any point of the analysed program, and to analyse loop bounds. The following cache analysis statically analyze the cache behavior of a program using a formal model examining sure hits and poten-tial misses. The pipeline analysis models the prpcessor’s pipeline behavior based on the current state of the pipeline, the resources in use, the contents in prefetch queues and the results obtained during cache analysis. It aims at finding the WCET estimate of each basic block of the program. 3) Bound calculation based on the path analysis determines the worst-case execution path of the program relying on the timing information of each basic block.
Figure A.2.2: Workflow of aiT WCET analyzer.
aiT includes automatic analysis to determine the targets of indirect calls and branches and to determine the upper bounds of iterations of loops. However, this
analysis does not work in all cases. If it fails, the users have to supply annota-tions. In addition, aiT relies on the standard calling convention that may not be respected by some code. In this case, the users have to provide additional annotations describing control flow properties of the program.
RapiTime RapiTime [19, 38] is a measurement-based tool aiming at medium to large real-time embedded systems on advanced processors. It targets the auto-motive electronics, avionics and telecommunications industries. RapiTime derives timing information of each basic block of the program from the measurements, and then combines all the measurement results according to the structure of the program to estimate the longest path of the program. RapiTime not only com-putes the upper bound of the program as a single value but also gets the whole probability distribution of the execution time of the longest path in the program. The input of RapiTime can be either source code files or binary code files, and the users have to provide test data for measurements.
Compared to the static tools, RapiTime does not rely on the processor model, so it can model any processing unit based on its measurement results. However, the limitation is also put on the measurement. It has to extract the execution traces of basic blocks in the running system using code instrumentations or other measurement mechanisms. Regarding source code level, RapiTime cannot analyse programs with recursions and with non-statically analyzable function pointers.
SymTA/P (SYMbolic Timing Analysis for Processes) SymTA/P [16,38] is a hybrid approach combining the static and measurement-based analysis to ob-tain lower and upper execution time bounds of C programs running on microcon-trollers. The key concept of SymTA/P is to combine platform independent path analysis on source code level and platform dependent measurement methodology on object code level using an actual target architecture. SymTA/P uses sym-bolic analysis on the abstract syndax tree to identify single feasible paths (SFP). SFP is a sequence of basic blocks where the execution sequence is invariant to input data. The result of the analysis is a CFG with nodes containing SFPs or basic blocks that are part of a multiple feasible paths. In the second step, the execution time of each node is estimated on an off-the-shelf processor simulator or an evaluation board by instrumenting C code with measurement points that mark the beginning and the end of each node. However, such measurement can not ensure a safe initial state in all cases, so an additional time delay is added to cover a potential underestimation during such measurement by many techniques. The longest and the shortest paths in the CFG are found by IPET introduced in Section A.2.1.1.
However, data-dependent execution times of single instructions are not ex-plicitly considered. The input data has to cover the worst case regarding data-dependent instruction execution time, which means that the input data has to generate complete branch coverage. In addition, there is no sub-function analysis during cache-analysis. Each function is analysed seperately (assuming an empty cache at function start), and there is no interference assumed when a function is called.
A.2.2
In-house Approach for the WCET
Esti-mate
As we stated in ChapterA.1, multi-core architectures provide high average perfor-mance and are increasingly considered as execution platforms for embedded sys-tems in the safety-critical domain. However, the performance variability, namely the reduced predictability is a critical issue that should be avoided in the safety-critical context. To increase the performance predictability, two different ap-proaches have been advocated. The first is the in-house approach and the second is the COTS approach. We present, in this section, some related work about the former and in the next section about the latter.
With the advent of multi-core architectures the WCET analysis methods for single-cores are no longer able to estimate WCETs due to the shared hardware resources and mechanisms (network-on-chip, memory coherency, . . . ) which add too much performance uncertainty. In order to provide tight WCETs the research community has mainly focused on in-house approach which aims at proposing new and more predictable multi-core architectures implementing proper isolation mechanisms to separate the use of shared resources and provide a adequate level of determinism, as in multiple european and american projects Predator [26], Merasa [33] / parmerasa [34] and Prets [7].
The Merasa project aims to achieve a breakthrough in hardware design, hard real-time support in system software and the WCET analysis tools for embed-ded multicore processors. The project focuses on developing multicore processor designs for hard real-time embedded systems and techniques to gurantee the an-alyzability and timing predictability of every feature provided by the processor.
Intertask interferences in mainstream multicores provoke the main difficulty in analyzing timing behaviour, which renders multicores unusable in safety-related real-time embedded systems. In this context, MERASA architecture is designed in [33] to make analysis of each task independent from coscheduled tasks and allow safe and tight worst-case execution time (WCET) estimation. The general MERASA multicore architecture is based on SMT cores and is capable of running both hard real-time (HRT) and non hard real-time (NHRT) threads. However,
HRT threads receive the highest priority in the fetch stage, the real-time issue stage, and the intracore real-time arbiter. Moreover, each HRT task has access to its local dynamic instruction scratchpad (D-ISP) and data scratchpad (DSP), private instruction, and data cache partitions. Thanks to these tailors, HRT threads are isolated from NHRT threads. In addition, analyzable real-time mem-ory controller (AMC) is proposed to minimize the impact of memmem-ory intertask interferences on the WCET. With respect to WCET techniques and tools, the MERASA project uses a static WCET tool and a measurement-based WCET tool to evaluate impact of intertask inference on WCET estimation.
The philosophy of the Prets project [7] is to propose very predictable archi-tectures whose temporal behavior is as easily controlled as their logical function. The timing control research thus spans all abstraction layers in computing, in-cluding programming languages, the ISA level, the memory hierarchy, the inter-connect architecture, the DRAM design and so forth.
B.Lickly et al. [20] focus on integrating timing instructions to a thread-interleaved pipeline and a predictable memory system. With respect to pipeline, based on SPARC v8 ISA, PRET architecture implements a six-stage thread-interleaved pipeline that supports six independent hardware threads. Each thread has its own register file, local on-chip memory (scratchpad memories (SPMs)) and as-signed off-chip memory. The thread controller schedules the threads according to a round-robin policy. This pipeline eliminates dependencies among instructions in the same thread. However, structural hazards do exist, which will stall the pipeline. To avoid to stall the whole pipeline, a replay mechanism is used by repeatedly replaying the stalling thread until it can continue. Moreover, in order to provide precise timing control to software, a deadline instruction is offered to allow the programmer to set a lower bound deadline on the execution time of a segment of code through accessing cycle-accurate timers. With respect to mem-ory system, PRET replaces caches with SPMs which are managed by software through direct memory access (DMA) transfers, thus avoiding unpredictability of hardware replacement policies. In order to isolate off-chip memory access among each thread, a memory wheel is provided to determine which thread is allowed to access memory through a fixed round robin schedule, which finally ensure a pre-dictable timing. Although all above timing control techniques are able to ensure the real-time constraints of the design with ease, the timing constraints have to be calculated by hand whenever the code is optimized or modified. The lack of the automated tool for calculating and verifying timing constraints prevent the realistic programming for this PRET.
In [3], the Prets authors discuss techniques of temporal isolation on mul-tiprocessing architectures at the microarchitecture level, the memory architec-ture, the network-on-chip (NoC), and the instruction-set architecture (ISA). At the microarchitecture level, temporal interference can be removed by assigning a
top priority to hard real-time threads or using virtual multiprocessor or thread-interleaved pipeline. At the memory level, partitioned caches can be applied to avoid the interference in the cache by pre-allocating a fixed cache region to each core or application. In addition, scratchpad memories (SPMs) are an alternative to caches. SPMs provide constant latency access times and the contents are un-der software control. For the next lower level of the memory, dynamic random access memory (DRAM) controller allocates private banks to different clients. At the NoC level, there are two approaches: one is time-division multiple-access (TDMA), and the other is priority-based mechanism. At the ISA level, some new instructions with temporal semantics considered as ISA extensions are proposed to enable control over timing.
Reineke et al. [29] propose a novel dynamic random access memory (PRET DRAM) controller is proposed in which the DRAM device is considered as mul-tiple resources shared between one or more clients individually. The physical address space is partitioned following the internal structure of the DRAM device, ie., its ranks and banks. The DRAM controller is split into a backend and a fron-tend. The frontend connects to the processor, and the backend issues commands to the independent resources in DRAM module with a periodic and pipelined fashion. Therefore, a bank parallelism is realized and interference amongst the resources is removed.
The Proartis project [4] proposes an interesting approach for the WCET problem on multi-cores by proposing architecture designs with randomness. Thanks to the randomness properties of such designs probabilistic approaches can be ap-plied to compute accurate WCETs.
The advantage of these in-house approaches is that they can address temporal and spatial isolation directly, which makes few or no modification in terms of the software, like the operating system. However, hardware modifications especially complex modifications lead to high custom silicon cost and a long time-to-market (TTM). From my best knowledge, there is no MERASA or PRET architecture commercialised in the market. Furthermore, for these in-house architectures, the high predictability is achieved at the cost of their average performance, which makes them not able to sustain the increasing performance requirement shown in Figure A.1.3.
A.2.3
COTS Approach for the WCET Estimate
COTS architectures refer to the commercial components that we can directly get in the market. Therefore, compared to in-house solutions, COTS architec-tures reduce both the non-recurring engineering costs (NRE) and the TTM [2]. Considering these advantages and multi-core COTS’s high average performance
safety-critical industries have been seeking the methods to achieving the worst case timing analysis based on core COTS. The critical issue of using multi-core COTS is reduced predictability resulting from the interference among co-running appications on shared resources. The performance in the context of co-running applications is mostly slown down either by concurrent accesses to a shared bus/memory or by changed states of shared caches.
Pellizzoni et al. [24] propose a methodology computing upper bounds to task delay due to memory contention. The methodology adopts task model based on superblocks. Each task is composed of a sequence of superblocks characterised by a cache profile Ci={µmini , µmaxi , execiL, execUi }. µmini , µmaxi are the minimum and
maximum number of access requests to the main memory, and execLi , execUi are
lower and upper bounds on computation time for superblock si. To bound the
amount of concurrently requested access time for a given superblock, all possible interleavings of its bus accesses with concurrent access sequences have to be taken into account. As this may be computationally infeasible, an arrival curve αi(t) is
introduced in the article based on the cache profiles of all the tasks executed on the processing unit i (PEi). αi(t) bounds the maximal amount of access time required
by concurrent tasks running on PEito perform operations in the main memory in
a time interval t. Arrival curves are then combined with a representation of cache behavior of the task under analysis to generate a delay bound. The principle of delay analysis is to construct the worst-case scenario which is the scenario that maximizes the latency of a request based on the memory arbitration scheme. For round-robin arbitration, the worst-case scenario is that all other processing units are allowed to perform one access before the PEi is allowed to do so. In First
Come First Served (FCFS) arbitration, an interference bound has to additionally take into account the maximum number of access requests that can be released at the same time by concurrent processing units if this number is greater than one. Pellizzoni et al. finally give a delay bound equation that was evaluated through an extensive simulations to derive the delay bounds.
In addition to [24], superblocks are also applied in [30, 23] to analyse the delay bounds due to the contention on shared bandwidth resources. However, this approach requires the bounds on the amount of computation time and the access times and delays to be compositional, which means that the approach should rely on timing compositional hardware architectures [39]. Unfortunately, many existing hardware architectures exhibit domino effects and timing anomalies and are thus out of the scope of such an approach.
Compared to the bandwidth resources, like the interconnect bus, which bring the runtime delay via their arbitration mechanisms when different applications request them at the same time, there is another type of shared resources, like caches. When one application changes the state of a resource, another application using that resource will suffer from a slowdown. Unfortunately, the behavior of
current shared caches is hard to predict statically. Cache accesses from different cores are typically served on a first-come first-served basis. Their interleaving thus depends on the relative execution speeds of the applications running on these cores, which depend on their cache performance, which in turn depends on the cache state. This cyclic dependency between the interleaving of the accesses and the cache state makes precise and efficient analysis hard or even impossible in general.
Chi Xu et al. in [40] propose CAMP, a fast and accurate shared cache aware performance model for multi-core processors. CAMP estimates the performace degradation due to cache contention of processes running on chip multiprocessors (CMPs). The model uses non-linear equilibrium equations in a least-recently-used (LRU) and pseudo-LRU last level cache, taking into account process reuse distance histograms, cache access frequencies and miss rate aware performance degradation. CAMP models both cache miss rate and performance degradation as functions of process effective cache size, which is in turn a function of the memory access behavior of other processes sharing the cache. CAMP can be used to accurately predict the effective cache sizes of processes running simultaneously on CMPs, allowing the performance prediction.
Fedorova et al. [8] describe a new operating system scheduling algorithm that improves performance isolation on chip multiprocessors (CMP). This algorithm is a cache-fair algorithm ensuring that the application runs as quickly as it would under fair cache allocation, regardless of how the cache is actually allocated.
Zhao et al. [41] presented an approach to dynamic scheduling that is based on their CacheScouts monitoring architecture. This architecture provides hardware performance counters for shared caches that can detect how much cache space individual tasks use, and how much sharing and contention there is between individual tasks.
An approach to static scheduling in a hard real-time context is presented by Guan et al. [13]. They extend the classical real-time scheduling problem by asso-ciating with each task a required cache partition size. They propose an associated scheduling algorithm, Cache-Aware Non-preemptive Fixed Priority Scheduling, FPCA and a linear programming formulation that determines whether a given task set is schedulable under FPCA . For higher efficiency, they also introduce a more efficient heuristic schedulability test that may reject schedulable task sets.
All these above proposals are static analysis of shared resources to try to provide a sound and safe bound in a co-running context. In addition to them, there are measurement-based approaches that aim at quantifying the slowdown a task experiences when different tasks are executed in parallel. In a single-core setting, a measurement-based estimate is obtained by adding a safety-margin to the longest observed execution time. However, it is not possible to directly extend such measurement-based timing analysis from the single-core to the multi-core
setting because of increased variability of the runtime.
Radojkovi´c et al. [28] propose benchmarks that stress a variety of possibly shared resources, including functional units, the memory hierarchy, especially the caches at different levels and the bandwidth to the main memory. These bench-marks are called resource stressing benchbench-marks which aim at maximizing the load on a resource or a set of resources. The interference a resource stressing benchmark causes on a certain resource is meant to be an upper bound to the interference any real co-runner could cause. Therefore the slowdown a program experiences due to interferences on a certain resource when co-running with a re-source stressing benchmark bounds the slowdown that could occur with respect to this resource in any real workload. Resource stressing benchmarks are thus considered as a good metric to obtain a workload-independent estimate of the per-formance slowdown. The authors applied resource stressing benchmarks in multi-threaded processors to 1) estimate the upper limit of a performance slowdown due to different shared-resource contention for simultaneously-running tasks. 2) quan-tify time-critical applications sensitivity to different shared-resource contention. 3) determine if a given multithreaded processor is a good candidate to meet the required timing contraints.
Experiments are carried out on three architectures with different shared re-sources in order to show the varying timing predictability, depending on the degree of resource sharing. One architecture Atom Z530 offers hyperthreading, and the resources from the front-end of the pipeline to the memory bandwidth are shared. For the second architecture Pentium D, the only shared resource is the bandwidth to the main memory between two cores whereas for the third architec-ture Core2Quad, the L2 cache is shared as well. In order to show the variance of the possible slowdown, measurements are taken for three different scenarios. In the first scenario, only resource stressing benchmarks are executed concurrently to estimate the worst possible slowdown independently of the application. In the other cases, the application is either executed with another co-running appli-cation or with different co-running resource-stressing benchmarks. The experi-mental results of the first scenario reveal that the techniques like hyperthreading are impractical for hard real-time applications due to a possible significant slow-down caused by the contention on all the shared resources. The measurements for the different scenarios reveal that the slowdown due to co-running resource stressing benchmarks drastically exceeds the slowdown measured in workloads only consisting of real applications. This implies that the workload- independent slowdown determined with co-running resource stressing benchmarks yields a very overestimated upper bound to the slowdown in any real workload. Therefore, the analysis result might be not very useful in practice.
Another measurement-based approach proposed by Nowotsch and Paulitsch [22] quantifies the impact of integration of multiple independent applications
onto multi-core platforms using resource stressing benchmarks. Measurements are carried out on the Freescale P4080 multi-core processor, and access two key parameters: influences introduced by multiple cores concurrently accessing net-work and memory and additional overhead introduced by coherency mechanisms. Several scenarios are considered:
1. configure L3 caches to SRAM in order to compare accesses to SRAM and DDR memory when coherency flag in turned off
2. compare accesses to SRAM and DDR memory in case of static coherency enabled (i.e. only checks whether memory blocks in the local caches are coherent)
3. compare accesses to SRAM and DDR memory in case of dynamic coherency enabled (i.e. not only checks, but also explicit memory operations enforcing coherency)
The outcomes show that the time for concurrent accesses to DDR memory scales very badly with the number of concurrent cores, in contrast to SRAM. Concerning the different cache coherency settings, the results show that even without coherent accesses, static coherency induces an overhead in execution time that should be considered in timing analysis. The impact of dynamic co-herency strongly depends on the type of memory operation (read or write). In case of read with concurrent read, dynamic coherency does not cause any slow-down compared to static coherency. For write operations, the execution is slown down significantly in case of dynamic coherency, regardless of the concurrent op-eration. This can be explained by the fact that after a write operation, coherency actions are required to keep the memory hierarchy consistent. Throughout all the evaluation results, the article points out that multi-core COTS may be used for safety-critical applications, but the WCET may be a factor of the number of cores being used.
The static approach is always highly complex due to the large number of potential hardware features to be considered during modeling. For complex ar-chitectures, several simplifications and unrealistic assumptions have to be set in order to derive a safe modeling, which hinders its widespread use in industries. The measurement-based approach is a good complement to the static approach by searching the worst case interference of co-running tasks to estimate the up-per bound. However, compared to the static approach, there is a lack of formal proofs to support the measurement-based approach. In addition, measured ex-ecution times might not be reproduced in the next measurement because of the variability. Therefore, the measurement usually has to be repeated to cover the worst-case scenario.
A.2.4
Performance Evaluation
The purpose of the performance evaluation is to monitor how an application behaves on an architecture. This monitoring information allows us to identify possible bottlenecks of performance which guide us to maximize the performance through various optimizations. In addition, it is also useful for characterizing workloads, allowing us to quantify hardware resource utilization at application level and providing some clues to better understand the runtime variability. There are broadly two distinguished profiling techniques: sampling and instrumentation.
Sampling Techniques
In the sampling approach, the measurement tool stops the target application in fixed intervals or at specific events and samples the program counter as the application progresses to measure performance aspects statistically by triggering relevant interrupts. At this point, additional information about hardware and program state can also be recorded. By unwinding the stack-frames, the tool is then able to roughly pinpoint the corresponding source position from the debug information.
The SimPoint tool [31, 25] is an automatic technique relying on sampling techniques to find and exploit program phase behavior to guide program analy-sis, optimization and simulation. During the phase analyanaly-sis, different metrics of the program are captured within each fixed interval or variable-sized interval to classify the intervals within the programs execution that have similar behavior/-metrics as the same phase.
Instrumentation Techniques
In the instrumentation approach, the target program is augmented with measure-ment points, called probes which are mostly installed at all entries and exists of a given function, to gather the necessary information. For example, the inserted hooks allow the profiler to maintain a shadow stack at runtime. The stack stores the time at which a function is entered, which is subtracted from the time when the function returns. The accumulated differences precisely capture how much time was spent in each function.
There are several well-known program profiling tool based on the instrumenta-tion. Valgrind [35] provides a generic infrastructure for supervising the execution of programs by providing a way to instrument programs in very precise ways, making it relatively easy to support activities such as dynamic error detection and profiling. The most used tool in Valgrind is memcheck which inserts extra instrumentation code around almost all instructions, which keeps track of the memory state, lile its validity and addressability. In addition, Joint Test Action Group (JTAG) which is propably the most widely used debug interface applies
the processor instrumentation to examine and modify the internal and external states of a system’s registers, memory and I/O space.
Both sampling and instrumentation are in principle capable of gathering the same information, though each of them has proper advantages and drawbacks. We can easily control measurement dilation under sampling by adjusting the sampling frequency. However, as sampling is performed outside of the scope of the observed application, important events occurring in between sampling points may potentially be missed. In contrast, the instrumentation approach where an event will always be observed provides deterministic and reproducible results, but automatic placement of event-probes is difficult to control and has tendencies to fail for current C++ codes due to immense overhead.
In the thesis, we propose methodologies characterizing architecture and ap-plications, and computing the runtime upper bound based on the performance evaluation using hardware monitors. Hardware monitors are essentially a group of special purpose registers implemented in most recent architectures include some special on-chip hardware to count hardware related activities. The col-lected hardware monitors information provides performance information [32] on the applications, the operating system, and the underlying hardware behavior.
The special purpose registers available from the micro-architecture instruction-set are confined to count on-die related events. In some architectures, it would imply not being able to gather some events related to the last cache level, as well as the interconnect, and the DDR controller. As contention on these resources can actually be the bottleneck of the architecture, we cannot afford not collecting this information.
However for recent embedded architectures, the integrators are proposing some monitoring facilities at platform level. These monitoring features are most of the time dedicated to debugging through proprietary hardware probes but al-low to count events at all the platform levels, including the number of DRAM refresh, page switch, and so on. This ability is a proof of the existence of some additional (most of the time undocumented) platform-level hardware counters that could be exploited through some reverse-engineering.
A.2.5
Conclusion
There are two complementary timing analysis methods for single-cores: the static and the measurement-based method. Although the static analysis is able to pro-vide a sound and safe execution time bound, the processor-behavior analysis can not be achieved for some complex processors with out-of-order executions which