HAL Id: hal-01113431
https://hal.archives-ouvertes.fr/hal-01113431
Submitted on 5 Feb 2015
HAL is a multi-disciplinary open access
archive for the deposit and dissemination of
sci-entific research documents, whether they are
pub-lished or not. The documents may come from
teaching and research institutions in France or
abroad, or from public or private research centers.
L’archive ouverte pluridisciplinaire HAL, est
destinée au dépôt et à la diffusion de documents
scientifiques de niveau recherche, publiés ou non,
émanant des établissements d’enseignement et de
recherche français ou étrangers, des laboratoires
publics ou privés.
Distributed under a Creative Commons Attribution - NonCommercial - NoDerivatives| 4.0
International License
Mathieu Génois, Christian Vestergaard, Julie Fournet, André Panisson,
Isabelle Bonmarin, Alain Barrat
To cite this version:
Mathieu Génois, Christian Vestergaard, Julie Fournet, André Panisson, Isabelle Bonmarin, et al.. Data
on face-to-face contacts in an office building suggests a low-cost vaccination strategy based on
commu-nity linkers. Network Science, Cambridge Journals, 2015, 3 (3), pp.326-347. �10.1017/nws.2015.10�.
�hal-01113431�
Data on face-to-face contacts in an office
building suggest a low-cost vaccination strategy
based on community linkers
Mathieu G´enois, Christian L. Vestergaard, Julie Fournet
Aix Marseille Universit´e, Universit´e de Toulon, CNRS, CPT, UMR 7332, 13288 Marseille, France;
Andr´e Panisson
Data Science Laboratory, ISI Foundation, Torino, Italy; Isabelle Bonmarin
D´epartement des maladies infectieuses, Institut de veille sanitaire, Saint-Maurice, France; Alain Barrat
Aix Marseille Universit´e, Universit´e de Toulon, CNRS, CPT, UMR 7332, 13288 Marseille, France
Data Science Laboratory, ISI Foundation, Torino, Italy
(e-mail: genois@cpt.univ-mrs.fr)
Abstract
Empirical data on contacts between individuals in social contexts play an important role in providing information for models describing human behavior and how epidemics spread in populations. Here, we analyze data on face-to-face contacts collected in an office building. The statistical properties of contacts are similar to other social situations, but important differences are observed in the contact network structure. In particular, the contact network is strongly shaped by the organization of the offices in departments, which has consequences in the design of accurate agent-based models of epi-demic spread. We consider the contact network as a potential substrate for infectious disease spread and show that its sparsity tends to prevent outbreaks of rapidly spreading epidemics. Moreover, we define three typical behaviors according to the fraction f of links each individual shares outside its own department: residents, wanderers and linkers. Linkers ( f ∼ 50%) act as bridges in the network and have large betweenness centralities. Thus, a vaccination strategy targeting linkers efficiently prevents large outbreaks. As such a behavior may be spotted a priori in the offices’ organization or from surveys, without the full knowledge of the time-resolved contact network, this result may help the design of efficient, low-cost vaccination or social-distancing strategies.
Keywords: Complex networks, Temporal networks, Sociophysics, Epidemiology.
1 Introduction
Data-driven models of disease propagation are essential tools for the prediction and pre-vention of epidemic outbreaks. Thanks to important increases in data availability and com-puter power, highly detailed agent-based models have in particular become widely used to describe epidemic spread at very different scales, from small communities to a whole
country or continent (Davey et al., 2008; Ajelli et al., 2010; Ajelli et al., 2014; Merler & Ajelli, 2010). One of the interests of such approaches comes from the level of detail they entail in the description of a disease propagation, from the amount of information they provide on the risk supported by each population category and on the probabilities of occurrence of transmission events in different circumstances. Moreover, the range of modeling possibilities is very large, and many different assumptions can be tested on how individuals come in contact, how a disease is transmitted and how such transmission can be contained. The drawback of this freedom in the model design lies in a certain arbitrariness in modeling choices. In order to alleviate this arbitrariness, models need to be fed with information and data concerning population statistics and individual behavior. In this respect, a crucial point regards the way in which people interact in their day-to-day life, and how these interactions affect disease propagation (Mossong et al., 2008; Read
et al., 2012). The collection of detailed data sets of human interactions is highly needed, as well as the extraction of the most relevant stylized characteristics and statistical features of these interactions (Stehl´e et al., 2011b; Blower & Go, 2011; Machens et al., 2013; Barrat
et al., 2013; Barrat et al., 2014). Understanding which features of human contact patterns are most salient can also help design low-cost methods based on limited information for targeted intervention strategies (Lee et al., 2012; Smieszek & Salath´e, 2013; Chowell & Viboud, 2013; Gemmetto et al., 2014).
In order to develop our knowledge and understanding of human interactions, novel techniques based on sensors using Wi-Fi, Bluetooth or RFID have emerged in the last decade and have provided important new insights (Zhang et al., 2012; Vu et al., 2010; Eagle et al., 2009; Stopczynski et al., 2014; Cattuto et al., 2010; Barrat et al., 2014; Salath´e
et al., 2010). In the present article, we consider data on face-to-face contacts collected using wearable sensors (Cattuto et al., 2010; Barrat et al., 2014). The corresponding in-frastructure, developed by the SocioPatterns collaboration (www.sociopatterns.org), allows obtaining time-resolved data on close face-to-face proximity events between individuals, yielding information not only on the overall network formed by these contacts, but also on the dynamics of these interactions. Previous works have shown that many properties of these dynamics –contact times, inter-contact times, number of contacts per link, etc – have broad statistical distributions and display robust features across several contexts: schools (Salath´e et al., 2010; Stehl´e et al., 2011a; Fournet & Barrat, 2014), hospitals (Isella
et al., 2011a; Vanhems et al., 2013), museums (Isella et al., 2011b) or conferences (Isella
et al., 2011b; Barrat et al., 2013; Stehl´e et al., 2011b). On the other hand, the contact networks also exhibit different high-level structures in each specific context, which can influence the way epidemics spread (Isella et al., 2011b; Machens et al., 2013; Gauvin
et al., 2013; Gauvin et al., 2014). Here we consider the contact patterns between adults at work, which have been less studied in an epidemiological perspective, even if the influence of office spatial layouts on social interactions has been considered from a sociological and architectural perspective (Penn et al., 1999; Sailer & McCulloh, 2012; Brown et al., 2014b; Brown et al., 2014a). A priori, the workplace is one of the locations where adults spend most of their time and, as such, may represent an important spot for transmission of diseases between adults (Ajelli et al., 2010). We therefore present an analysis of the human contact network in such a place, namely a building of the Institut de veille sanitaire (InVS, French Institute for Public Health Surveillance). We first discuss how the organization of
the offices in departments determine the structure of the contact network and the dynamics of the contacts, and how these features affect epidemic spreading. We then focus on a new way to determine important nodes in such a contact network, based on the fraction of links each individual has with other individuals in the same department and in other departments, and present numerical simulations of an agent-based model of disease spread in order to discuss the efficiency of vaccination strategies based on this criterion.
2 Data collection
In order to collect data on the contacts between individuals, we used the sensing platform developed by the SocioPatterns1collaboration, based on wearable sensors that exchange ultra-low power radio packets in order to detect close proximity of individuals wearing them (Cattuto et al., 2010; Barrat et al., 2014). Each individual that accepted to participate in the study was asked to wear a sensor on his/her chest. As described elsewhere (Cattuto
et al., 2010; Barrat et al., 2014), the body acts as a shield at the radio frequencies used by the sensors, so that the sensors of two individuals can only exchange radio packets when the persons are facing each other at close range (. 1.5 m). Signal detection is set so that any contact that lasts at least 20 seconds is recorded with a probability higher than 99 % (Cattuto et al., 2010). This defines the time resolution of the setup.
The study took place in one of the two office buildings of the InVS, located in Saint Maurice near Paris, France, and lasted two weeks. The building hosts three scientific departments – the Direction Scientifique et de la Qualit´e (DISQ, Scientific Direction), the D´epartement des Maladies Chroniques et des Traumatismes (DMCT, Department of Chronic Diseases and Traumatisms) and the D´epartement Sant´e et Environnement (DSE, Department of Health and Environment) – along with Human Resources (SRH) and Lo-gistics (SFLE). DSE and DMCT are the largest departments, with more than 30 persons each, DISQ and SRH consist of around 15 persons, and finally logistics consists of only 5 persons (Table 1). DISQ, DMCT and SFLE share the ground floor, while DSE and SRH are located on the first floor.
Two thirds of the total staff agreed to participate to the data collection. The coverage ranges from 63 % (DSE, the largest scientific department) to 87 % (human resources) (see Table 1). A signed informed consent was obtained for each participating individual and the French national bodies responsible for ethics and privacy, the Commission Nationale de l’Informatique et des Libert´es (CNIL, http://www.cnil.fr) was notified of the study. Data were treated anonymously, and the only information associated with the unique identifier of each sensor was the department of the individual wearing it.
3 Contact dynamics
3.1 Aggregated and temporal contact networks
We build the global contact network, shown in Fig. 1, by aggregating the contact data over the two weeks of the experiment. Each node represents an individual, and a link is drawn
Table 1. Departments of the InVS.
Number of tags Number of persons Coverage Floor
DISQ 15 19 79% 0 DMCT 30 46 65% 0 DSE 38 60 63% 1 SRH 13 15 87% 1 SFLE 4 5 80% 0 Total 100 145 69%
DSE
DISQ
DMCT
SRH
SFLE
Fig. 1. Empirical network of contacts between individuals, aggregated over the two weeks of study. Each node represents an individual and the color-code corresponds to the different departments. Each link between two nodes indicates that the corresponding individuals have been in contact at least once during the data collection. Nodes are laid out using the Force Atlas algorithm (see Gephi software, http://www.gephi.org), which allows communities to be apparent in the visualization of the network.
between two nodes if the corresponding individuals have been in contact at least once during the study. Each link carries a weight calculated as the total duration of the contacts between the two individuals. The resulting distributions of node degrees (the degree of an individual gives the total number of distinct other individuals with whom (s)he has been in contact during the study) and link weights are shown in Fig. 2a&b. Moreover, we take advantage of the fact that the data is time-resolved to treat the contact network as a temporal
0 1 2 3 4 0.0 0.2 0.4 0.6 0.8 1.0 InVS SFHH Thiers12 101 102 103 104 105 10-8 10-7 10-6 10-5 10-4 10-3 10-2 10-1 InVS SFHH Thiers12 101 102 103 104 10-8 10-7 10-6 10-5 10-4 10-3 10-2 10-1 InVS SFHH Thiers12 101 102 103 104 10-6 10-5 10-4 10-3 10-2 10-1 InVS SFHH Thiers12 a) b) c) d) P D F P D F P D F P D F k/ hki w τc τi
Fig. 2. Main features of the contact data. For each distribution we compare the features of the present study (InVS) with two previous studies: a scientific conference (SFHH, cf. (Stehl´e et al., 2011b)) and a high school (Thiers12, cf. (Fournet & Barrat, 2014)). a) Distributions of normalized degrees. Original mean degrees are: 15.1 (InVS), 47.5 (SFHH), 26.4 (Thiers12). b) Link weight distributions. c) Contact time distributions. d) Inter-contact time distributions.
network (Holme & Saram¨aki, 2012) and compute the distributions of contact durations and of the times between successive contacts of an individual (Fig. 2c&d).
In addition to the statistics of the present data set, Figure 2 also displays the properties of networks of face-to-face contacts collected in two other settings, namely a conference (Stehl´e et al., 2011b) and a high-school (Fournet & Barrat, 2014). Although the contexts are very different, the distributions are extremely similar. In particular we find broad distri-butions with an approximate power-law shape for weights, contact and inter-contact times, which are typical of the heterogeneous behavior often found in human activities (Barab`asi, 2005).
3.2 Sparsity of the contacts and consequences for the potential spread of infectious diseases
One of the main specific features of the present data set is the sparseness of the contacts: although the study lasted two weeks, the average degree in the aggregated network is only around 15, meaning that each individual met only∼ 15% of the office population partic-ipating to the study over the course of these two weeks. The contact network is thus very far from a fully connected structure, with immediate consequences on possible dynamical processes taking place on such a network, such as the propagation of an infectious disease.
0 20 40 60 80 100 10-3 10-2 10-1 100 0.0004 0.0010 0.0020 0.0050 0.0100 0.0150 0.0200 0 20 40 60 80 100 10-4 10-3 10-2 10-1 100 0.0004 0.0010 0.0020 0.0050 0.0100 0.0150 0.0200
a)
b)
P
D
F
P
D
F
N
N
Fig. 3. Distributions of the final size N of simulated epidemics. Simulations are performed for different values of the infection rateβ (given in the legend), the recovery rate µ being determined by the fixedβ/µ ratio. At given β /µ, larger values of β correspond to both faster spread and faster recovery. For each value ofβ , distributions are computed from 1000 simulations with initial conditions given by one single randomly chosen infected individual. a)β/µ = 100. b) β /µ = 1000.
To explore this issue, we perform numerical simulations of the spread of a Susceptible-Infected-Recovered (SIR) epidemic model in the population under study. In this model, Susceptible nodes (S) are infected with rateβ when they are in contact with an infected node (I): for each small time step dt, an S node in contact with n I nodes becomes infected with probability nβ dt. Infected nodes (I) recover from the infection with rate µ and enter the Recovered (R) compartment. Recovered nodes cannot be infected again. Our goal here is not to explore the whole phase diagram of the spreading process but rather to illustrate the influence of the contact patterns and of the interplay between the time-scales of the contacts and of the spreading process. We therefore consider two different values of the ratio β/µ and vary the speed of the epidemics by changing β . We vary β in order to explore a wide range of time-scales:β∈ [0.0004; 0.02], which correspond to a typical time of infectionβ−1∈ [50, 2500] seconds; For β /µ = 100, we thus have µ−1∈ [1.4; 70] hours,
and for β/µ = 1000, µ−1∈ [14; 700] hours. The duration of the spread depends on the
value ofβ and ranges from 105to 107seconds.
Each simulation starts with a single, randomly chosen, infected node (“seed”). We use the time-resolved data set to recreate in-silico the contacts between individuals (including the periods of inactivity, i.e. nights and week-end, during which individuals are considered isolated) and thereby the possibility of the infection to spread. We run each simulation until no infected individual remains (nodes are thus either still S or have been infected and have then recovered (R)). We define the duration T of an epidemic as the time needed to reach this state, and the final size N of an epidemic as the number of nodes that have been affected by the spread, i.e. the number of R nodes at the end of the epidemic. As T might be longer than the duration of the data set, we repeat the two-weeks sequence of contacts in the simulation if needed (Stehl´e et al., 2011b). For each realization we randomly choose both the seed and the moment when the spreading process starts. We compute the statistics of the final epidemic size over 1000 realizations for each value of the parameters.
Figure 3 displays the resulting distributions (i.e., the probability that the spread affects N individuals). Forβ/µ = 100, no large outbreaks are obtained (Fig. 3a). Even for the longest values of the infectious period (lowest values of µ), the sparsity of contacts makes the propagation of infection difficult. Indeed, at the fastest time scale, i.e. the time resolution of 20 seconds, nodes have an average instantaneous degree of 0.013, and overall only 0.66 links exist on average in the whole network: very few transmission opportunities exist at each time. Epidemics spread only if the ratioβ/µ is increased enough to compensate for this very low contact rate (e.g., if, at fixedβ , the recovery rate is strongly decreased). An example is given in Fig. 3b where we useβ/µ = 1000. Even in this case, many realizations lead to epidemics of small size, but epidemics affecting a large fraction of the population are also obtained.
Interestingly, Fig. 3b also illustrates the role of the interplay between the timescale of the disease spread and of the contact network (Isella et al., 2011b; Barrat et al., 2013). At fixedβ/µ indeed, a mode of the distribution corresponding to large epidemics is present for small values ofβ and µ. Larger values of β and µ corresponding to faster processes, with high spreading probability at each contact but also fast recovery and thus shorter infectious periods, lead to smaller probabilities of large epidemics: asβ is increased, the mode of the distribution corresponding to large epidemics tends to be suppressed. This phenomenon is related to the temporal constraints and correlations inherent in temporal networks that can slow down and hamper the propagation of rapidly spreading processes (Karsai et al., 2011; Isella et al., 2011b; Pfitzner et al., 2013; Scholtes et al., 2014): for instance, if A meets B who is infectious, and then C, the infection can spread from B to C through A. If instead A meets first C then B, A cannot be an intermediary for the spread to C. Slowly spreading processes –with slow recovery– on the other hand are ”less constrained” as the infectious period is longer and contacts with more individuals or repeated contacts with the same individual can occur during this period, effectively creating more possible paths of transmission between individuals (Stehl´e et al., 2011b; Holme & Saram¨aki, 2012; Barrat
et al., 2013). To make the role of the contact chronology and of temporal constraints more explicit, we compare in the Supplementary Material the outcome of spreading processes simulated either on the temporally resolved contact data or on aggregated versions of the
data, in which the information about the order in which different contacts occur is lost. Spreading processes with fixedβ/µ values unfolding on a purely static contact structure would lead to exactly the same distribution of final epidemic sizes for different values of β . In our case, we still take into account the fact that nodes are isolated during nights and weekends. As a result, larger values ofβ lead to slightly larger epidemics, because faster spreading processes unfold over less inactivity periods (and inactivity periods, during which nodes can recover but cannot transmit, tend to hinder the spread). Overall, we thus have an opposite trend on temporal and static networks, at fixedβ/µ: on static networks, increasingβ tends to increase the final epidemic size and, in particular, the mode at large final sizes is kept, while if the whole temporal resolution is considered, such an increase tends to suppress the large epidemics.
3.3 Organization in departments
The offices are organized in five departments, on two floors. DISQ, DMCT and SFLE (logistics) are on the ground floor, along with a cafeteria and conference rooms. The remaining departments – SRH (human resources) and the DSE department – are on the first floor. As found in literature linked to social sciences and architecture, the spatial organization is expected to have an impact on the interactions between office workers (Penn et al., 1999; Sailer & McCulloh, 2012; Brown et al., 2014b; Brown et al., 2014a). A detailed investigation of this issue is beyond the scope of our work, in particular as, due to anonymity of the participants, we do not have access to the office location of each participant. As shown in Fig. 1 the collected data show nonetheless a clear impact of the structure in departments, while the separation in two different floors is less apparent, at least at this resolution. As we will see in the next sections and as discussed for instance in (Salath´e & Jones, 2010; H´ebert-Dufresne et al., 2013), the fact that departments seem to correspond to communities in the network structure shown in Fig. 1 has consequences for the possibility to define mitigation strategies against the spread of epidemics.
In order to better quantify the mixing within and between departments, we build contact matrices giving for each pair of departments the total time of contact between individuals belonging to these departments. Figure 4a shows that contacts occur much more often inside departments (internal contacts) than between them (external contacts), with the exception of the logistics department. Furthermore, it confirms that the structure of external contacts does not clearly follow the spatial organization in two floors, but that scientific departments form a moderately connected sub-structure, leaving human resources and logistics more isolated. This structure is also found in the contact matrix restricted to the conference rooms (Fig. 4b). Scientific departments are in fact almost the only ones using these rooms for inter-departments meetings. Contacts between individuals of different departments also occur independently of scheduled meetings, for instance during lunch, which takes place either in the cafeteria or in the canteen (located in a distinct building). The contacts taking place in the cafeteria at lunchtime (Fig. 4c) show the same structure as the global one, with many internal contacts for each department, and a substructure corresponding to the three scientific departments on the one hand and logistics and human resources on the other hand. Strikingly, the structure of contacts occurring in the canteen is rather different, with a mostly diagonal contact matrix: in this situation, individuals from
a) b)
c) d)
Fig. 4. Contact matrices. Each matrix element (at row X and column Y) gives the total time of contact between individuals from departments X and Y during the two weeks of the study, in different locations. a) Entire building. b) Conference room. c) Cafeteria, restricted to the interval between 12am and 2pm for each day. d) Canteen. This place is in a different building and is not taken into account in a).
different departments do not mix with each other. In order to test if such structures of contact patterns can simply be explained by the fact that the departments are of different sizes or that individuals from the same department tend to be present at a given location at the same time, we consider in the Electronic Supplementary Material a null model in which contacts occur at random between nodes that are present in the same location at the same time, according to their empirical presence timeline and with a constant rate set to yield the same total contact time as in the empirical data. The empirical contact matrices are significantly different from the ones obtained with such a null model, showing that the observed structure is indeed the result of individual choices and non-random interactions.
Overall, the structure of contacts measured in the InVS offices is strongly shaped by its internal organization in departments. Although contacts are a priori not constrained by
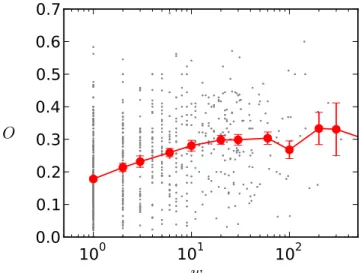
100 101 102 0.0 0.1 0.2 0.3 0.4 0.5 0.6 0.7
O
w
Fig. 5. Overlap of a link as a function of its weight. Scatter plot (gray) is averaged on weight bins (red). The error bars mark the standard error on the average value.
specific schedules, as e.g. in schools or high schools (Stehl´e et al., 2011a; Fournet & Barrat, 2014), the resulting patterns are still very different from contexts such as conferences (Stehl´e et al., 2011b), and in particular very far from a homogeneous mixing situation. This has clear consequences in the design of realistic agent-based models of workplaces. For instance, as shown in the Electronic Supplementary Material, modeling the spread of a disease in such a context under a homogeneous mixing assumption would result in a lack of accuracy with respect to more realistic data representations which take into account the division in departments and the restricted mixing between departments.
3.4 Weak inter-department ties
We investigate in more detail how the network structure is shaped by the departments by computing, as suggested in (Onnela et al., 2007), the topological overlap Oi j of the
neighborhoods of each pair of connected nodes i and j: Oi j= ni j/((ki−1)+(kj−1)−ni j),
where ki and kj are the respective degrees of i and j and ni j is the number of common
neighbors of i and j. If O= 0 the two nodes do not share any neighbors, while if O = 1 the two nodes have exactly the same neighbors. The topological overlap thus quantifies whether a link joins two nodes from the same group or community in the network, or two nodes from different communities. Figure 5 shows, similarly to the results of (Onnela et al., 2007) concerning a communication network, that overlaps and weights are positively cor-related (we recall that the weight of a link is the total contact time between the two linked individuals). Moreover, we measure for internal links an average overlap of 0.29±?, with an average weight of 328±? s, while links joining individuals from different departments have an average overlap of 0.13±? and an average weight of 134±? s. This indicates that internal links are strong, whereas external links tend to be the weak ties in agreement with the weak tie hypothesis of (Granovetter, 1973).
Table 2. Daily contact matrices similarities. For each day, we compute the cosine
similarity between the list of elements of the contact matrix and the ones of the other days, both with and without the diagonal elements. We list in this table the mean value and the standard deviation of the similarities.
Day full w/o diagonal
06/24 0.753± 0.103 0.563 ± 0.222 06/25 0.843± 0.069 0.481 ± 0.087 06/26 0.837± 0.046 0.400 ± 0.246 06/27 0.870± 0.052 0.534 ± 0.108 06/28 0.871± 0.075 0.426 ± 0.134 07/01 0.821± 0.058 0.592 ± 0.152 07/02 0.850± 0.087 0.579 ± 0.180 07/03 0.858± 0.072 0.488 ± 0.262 07/04 0.767± 0.058 0.317 ± 0.131 07/05 0.795± 0.123 0.398 ± 0.199
3.5 Daily contacts structure
3.5.1 Stability of the overall structure
In order to understand how well the structure of the globally aggregated contact network and of the contact matrices described in the previous paragraph reflect how contacts occur every day, we build contact matrices giving for each day the durations of contacts between individuals of different departments (shown in the Electronic Supplementary Material) and compare their properties. Table 2 presents the mean similarity between each daily contact matrix and the matrices of the other days. The high values obtained show that the structure of the contact matrix is largely conserved from one day to another. As the diagonal of the matrices contains the largest values, we also compute similarities restricted to the non-diagonal elements. We still obtain rather large values, showing that even secondary structures are stable across days.
3.5.2 Network evolution
Although the overall contact structure is rather stable from one day to the next, the specific contacts of each individual change. Indeed, Fig. 6a shows that the average degree (num-ber of distinct individuals contacted) of individuals increases steadily when we consider contact networks aggregated over increasing time intervals, both within a department and for external contacts. In order to gain more insights into this issue, we compute simi-larities between daily aggregated contact networks: the similarity between two networks (1) and (2) is defined here as the cosine similarity between their weighted lists of links, ∑i, jwi j,(1)wi j,(2)/q∑i, jw2
i j,(1)∑i, jw2i j,(2) where wi j,(a) is the weight of the link i j in
net-work(a) (if there is no link, the weight is set equal to 0). The resulting values are given in Table 3a.
Table 3. Daily networks similarities. For each day, we calculate the cosine similarity
between the weighted link list of the corresponding network and the lists of all other days. We show here the mean and standard deviation of these similarities. Statistics for the null models are calculated over 1000 realizations. a) Empirical similarities. b) Complete random rewiring of links. c) Rewiring keeping each individual node degree fixed. d) Random redistribution of link weights on the fixed topological structure. e) Rewiring in each contact matrix compartment. f) Random redistribution of link weights in each contact matrix compartment. a) b) c) d) e) f) Day (×10−3) (×10−2) (×10−2) (×10−2) (×10−2) 06/24 0.141± 0.084 6.20 ± 13.8 1.51 ± 1.56 3.83 ± 3.50 2.19 ± 2.69 4.39 ± 3.63 06/25 0.302± 0.162 5.30 ± 13.5 2.40 ± 4.46 4.07 ± 3.90 3.56 ± 5.41 6.34 ± 6.59 06/26 0.125± 0.052 5.33 ± 15.6 2.29 ± 3.44 3.96 ± 3.99 2.90 ± 3.75 5.15 ± 4.78 06/27 0.288± 0.195 6.32 ± 14.8 2.01 ± 2.09 4.67 ± 3.65 3.48 ± 4.73 6.27 ± 6.10 06/28 0.096± 0.041 5.30 ± 12.8 2.23 ± 3.43 4.98 ± 4.08 4.01 ± 5.38 7.55 ± 6.55 07/01 0.109± 0.078 4.15 ± 11.9 1.67 ± 2.93 4.07 ± 4.08 2.19 ± 2.35 4.75 ± 3.65 07/02 0.264± 0.141 5.85 ± 14.7 2.65 ± 3.92 5.28 ± 4.10 4.36 ± 4.76 8.06 ± 5.83 07/03 0.318± 0.206 5.23 ± 14.3 2.03 ± 2.35 4.56 ± 4.04 3.36 ± 5.22 6.72 ± 7.07 07/04 0.246± 0.101 5.03 ± 13.9 1.62 ± 2.19 3.94 ± 3.90 2.46 ± 3.22 5.23 ± 4.64 07/04 0.297± 0.262 2.52 ± 11.4 1.37 ± 4.11 2.43 ± 3.96 2.75 ± 6.37 4.79 ± 8.05
In order to understand if these values correspond to a weak or strong stability, we compare them with several null models obtained by link rewiring. If we consider networks with the same number of nodes and the same set of weights, but edges placed at random between nodes (Table 3b), similarities are much smaller than for the empirical data. This is also the case if links are reshuffled while conserving the degree of each node (Maslov & Sneppen, 2002) (Table 3c) and if weights are redistributed at random among the links while conserving the topology of the networks (Table 3d). Finally, even null models which respect the department structure, i.e. with rewiring or reshuffling procedures inside each compartment of the contact matrix, yield similarities smaller than the empirical ones (Table 3e & f).
Overall, these results indicate on the one hand that the precise structure of the daily contact networks fluctuate significantly across days, even if the contact matrix structure is stable. On the other hand, the changes from one day to the next are much less important than what would be obtained by random chance, and even some degree of intra-department structure is kept across days. Such results should thus be taken into account in the de-velopment of agent-based models, as done e.g. in (Stehl´e et al., 2011b), as the amount of repetition of contacts over different days impacts how dynamical processes such as epidemics unfold in a population (Smieszek et al., 2009).
3.5.3 Daily activity
As Fig. 6b shows, the total duration of contacts within and between departments grows steadily. Contacts however might a priori occur at specific times for specific departments
101 102 103 104 105 10-2 10-1 100 101 102 101 102 103 104 105 10-2 10-1 100 101 102 103 a) b) hki hsi t t
Fig. 6. Network aggregation. We compute the mean degree (number of distinct individuals contacted) a) and the mean node strength (total time in contact) b) as a function of time while aggregating the network over the two weeks of measurement, disregarding nights and the weekend. These are calculated globally (black), and restricted to internal links (blue) and external links (red).
8 10 12 14 16 18 20 0 50 100 150 200 250 300 8 10 12 14 16 18 20 0 50 100 150 200 8 10 12 14 16 18 20 0 100 200 300 400 500 600 8 10 12 14 16 18 20 0 50 100 150 200 250 8 10 12 14 16 18 20 0 100 200 300 400 500 8 10 12 14 16 18 20 0 20 40 60 80 100
τ
τ
τ
τ
τ
τ
hour
hour
hour
hour
hour
hour
a)
b)
c)
d)
e)
f )
All
DISQ
DSE
DMCT
SRH
SFLE
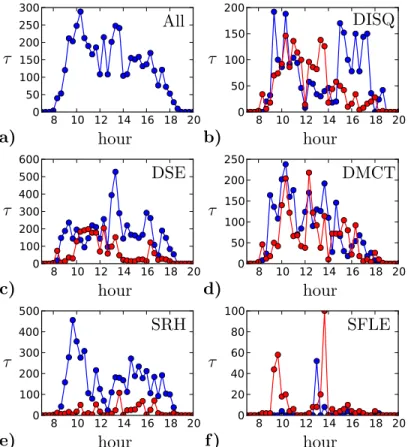
Fig. 7. Daily activity timelines for each department. The activity is defined as the total duration of contacts during windows of 20 minutes. We show the activity averaged over the ten days of the study. Internal contacts are plotted in blue, external contacts in red.
(due to breaks, meetings, etc...). We therefore examine in Fig. 7 the activity timelines averaged over different days. The global, averaged activity for the whole building (Fig. 7a) exhibits activity peaks around 10am and lunchtime, but no other clear feature emerges. This is most probably due to the fact that no strict schedule constraints exist (in contrast
e.g.to schools (Stehl´e et al., 2011a) and hospitals (Vanhems et al., 2013)). We also show for each department both internal and external contact activities for an average day (Fig. 7b to f). Four departments present the 10am peak of activity, which may be related to a common tendency to have a break around that time. During lunch (12am-2pm), DSE, DMCT and SFLE have many contacts, both within and outside the department, whereas SRH exhibits a decrease of activity, and DISQ shows an inversion between internal and external contacts. Finally, for the three scientific departments, external contacts are more present in the morning than in the afternoon.
4 Node behaviors
4.1 Residents, wanderers and linkers
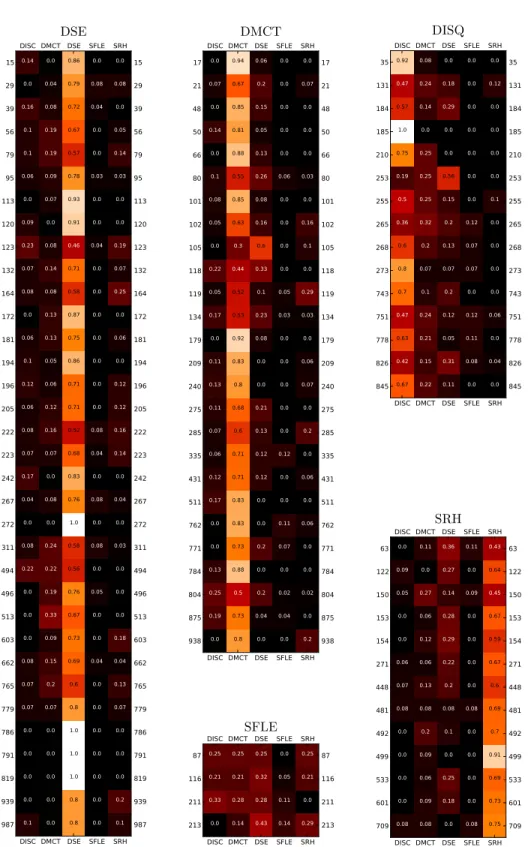
In the context of spreading phenomena, links joining groups of individuals in a contact network play a crucial role (Karsai et al., 2011; Onnela et al., 2007; Salath´e & Jones, 2010; H´ebert-Dufresne et al., 2013). In the present case, the possibility for an infectious disease to spread in the whole population thus strongly depends on the structure of contacts along inter-departments links. In order to shed more light on the role of each node in linking communities, we consider the static aggregated network, and we compute in Fig. 8 for each node the fraction of its links with individuals of each department. We focus in particular on the fraction f of internal links (i.e., with nodes in the same department). Most nodes are “residents”: the large majority of their links are internal. Some other nodes (such as individuals from the Logistics department, or node 105 from DMCT and node 253 from DISQ) are on the other hand mostly linked to nodes outside their own department: they are “wanderers”.
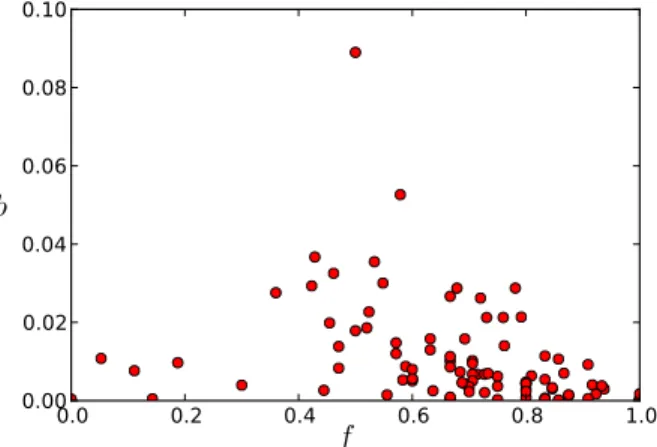
In order to determine how these different types of behaviour could be exploited in the design of targeted vaccination strategies, we investigate in Fig. 9 the relation between the centrality of a node in the aggregated contact network, as measured by its betweenness centrality (BC), and its fraction f of internal links. We note here that different definitions of node centrality exist. They are often correlated but the precise ranking of nodes’ cen-trality slightly depends on the specific cencen-trality measure used, and various works have compared how different centrality measures perform in identifying individuals most at risk of infection or the most efficient spreaders for various models of epidemic spreading (Christley et al., 2005; Kitsak et al., 2010; Castellano & Pastor-Satorras, 2012). In the context of targeted measures to mitigate the spread of diseases in particular, immunizing (i.e., removing) the nodes with highest degree or largest BC is known to be among the most efficient strategies (Pastor-Satorras & Vespignani, 2002; Holme et al., 2002; Dall’Asta
et al., 2006). We also note that BC can be defined both on the unweighted and weighted versions of the network (Dall’Asta et al., 2006; Opsahl et al., 2010). We have considered both cases and found very similar results so we use for simplicity in Fig. 9 the unweighted BC.
DISC DISC DMCT DMCT DSE DSE SFLE SFLE SRH SRH 15 15 29 29 39 39 56 56 79 79 95 95 113 113 120 120 123 123 132 132 164 164 172 172 181 181 194 194 196 196 205 205 222 222 223 223 242 242 267 267 272 272 311 311 494 494 496 496 513 513 603 603 662 662 765 765 779 779 786 786 791 791 819 819 939 939 987 987 0.14 0.0 0.16 0.1 0.1 0.06 0.0 0.09 0.23 0.07 0.08 0.0 0.06 0.1 0.12 0.06 0.08 0.07 0.17 0.04 0.0 0.08 0.22 0.0 0.0 0.0 0.08 0.07 0.07 0.0 0.0 0.0 0.0 0.1 0.0 0.04 0.08 0.19 0.19 0.09 0.07 0.0 0.08 0.14 0.08 0.13 0.13 0.05 0.06 0.12 0.16 0.07 0.0 0.08 0.0 0.24 0.22 0.19 0.33 0.09 0.15 0.2 0.07 0.0 0.0 0.0 0.0 0.0 0.86 0.79 0.72 0.67 0.57 0.78 0.93 0.91 0.46 0.71 0.58 0.87 0.75 0.86 0.71 0.71 0.52 0.68 0.83 0.76 1.0 0.58 0.56 0.76 0.67 0.73 0.69 0.6 0.8 1.0 1.0 1.0 0.8 0.8 0.0 0.08 0.04 0.0 0.0 0.03 0.0 0.0 0.04 0.0 0.0 0.0 0.0 0.0 0.0 0.0 0.08 0.04 0.0 0.08 0.0 0.08 0.0 0.05 0.0 0.0 0.04 0.0 0.0 0.0 0.0 0.0 0.0 0.0 0.0 0.08 0.0 0.05 0.14 0.03 0.0 0.0 0.19 0.07 0.25 0.0 0.06 0.0 0.12 0.12 0.16 0.14 0.0 0.04 0.0 0.03 0.0 0.0 0.0 0.18 0.04 0.13 0.07 0.0 0.0 0.0 0.2 0.1 DSE DISC DISC DMCT DMCT DSE DSE SFLE SFLE SRH SRH 17 17 21 21 48 48 50 50 66 66 80 80 101 101 102 102 105 105 118 118 119 119 134 134 179 179 209 209 240 240 275 275 285 285 335 335 431 431 511 511 762 762 771 771 784 784 804 804 875 875 938 938 0.0 0.07 0.0 0.14 0.0 0.1 0.08 0.05 0.0 0.22 0.05 0.17 0.0 0.11 0.13 0.11 0.07 0.06 0.12 0.17 0.0 0.0 0.13 0.25 0.19 0.0 0.94 0.67 0.85 0.81 0.88 0.55 0.85 0.63 0.3 0.44 0.52 0.53 0.92 0.83 0.8 0.68 0.6 0.71 0.71 0.83 0.83 0.73 0.88 0.5 0.73 0.8 0.06 0.2 0.15 0.05 0.13 0.26 0.08 0.16 0.6 0.33 0.1 0.23 0.08 0.0 0.0 0.21 0.13 0.12 0.12 0.0 0.0 0.2 0.0 0.2 0.04 0.0 0.0 0.0 0.0 0.0 0.0 0.06 0.0 0.0 0.0 0.0 0.05 0.03 0.0 0.0 0.0 0.0 0.0 0.12 0.0 0.0 0.11 0.07 0.0 0.02 0.04 0.0 0.0 0.07 0.0 0.0 0.0 0.03 0.0 0.16 0.1 0.0 0.29 0.03 0.0 0.06 0.07 0.0 0.2 0.0 0.06 0.0 0.06 0.0 0.0 0.02 0.0 0.2 DMCT DISC DISC DMCT DMCT DSE DSE SFLE SFLE SRH SRH 87 87 116 116 211 211 213 213 0.25 0.21 0.33 0.0 0.25 0.21 0.28 0.14 0.25 0.32 0.28 0.43 0.0 0.05 0.11 0.14 0.25 0.21 0.0 0.29 SFLE DISC DISC DMCT DMCT DSE DSE SFLE SFLE SRH SRH 35 35 131 131 184 184 185 185 210 210 253 253 255 255 265 265 268 268 273 273 743 743 751 751 778 778 826 826 845 845 0.92 0.47 0.57 1.0 0.75 0.19 0.5 0.36 0.6 0.8 0.7 0.47 0.63 0.42 0.67 0.08 0.24 0.14 0.0 0.25 0.25 0.25 0.32 0.2 0.07 0.1 0.24 0.21 0.15 0.22 0.0 0.18 0.29 0.0 0.0 0.56 0.15 0.2 0.13 0.07 0.2 0.12 0.05 0.31 0.11 0.0 0.0 0.0 0.0 0.0 0.0 0.0 0.12 0.07 0.07 0.0 0.12 0.11 0.08 0.0 0.0 0.12 0.0 0.0 0.0 0.0 0.1 0.0 0.0 0.0 0.0 0.06 0.0 0.04 0.0 DISQ DISC DISC DMCT DMCT DSE DSE SFLE SFLE SRH SRH 63 63 122 122 150 150 153 153 154 154 271 271 448 448 481 481 492 492 499 499 533 533 601 601 709 709 0.0 0.09 0.05 0.0 0.0 0.06 0.07 0.08 0.0 0.0 0.0 0.0 0.08 0.11 0.0 0.27 0.06 0.12 0.06 0.13 0.08 0.2 0.09 0.06 0.09 0.08 0.36 0.27 0.14 0.28 0.29 0.22 0.2 0.08 0.1 0.0 0.25 0.18 0.0 0.11 0.0 0.09 0.0 0.0 0.0 0.0 0.08 0.0 0.0 0.0 0.0 0.08 0.43 0.64 0.45 0.67 0.59 0.67 0.6 0.69 0.7 0.91 0.69 0.73 0.75 SRH
Fig. 8. Proportion of links with individuals of each department, for each node. Values are calculated from the network aggregated over the two weeks.
0.0 0.2 0.4 0.6 0.8 1.0 0.00 0.02 0.04 0.06 0.08 0.10 b f
Fig. 9. Relation between the betweenness centrality b of a node and the fraction f of its links that are internal. Values are calculated on the network aggregated over the two weeks.
Residents have, as could be expected, low centrality. Wanderers, as nodes connecting to other departments, could be expected to be crucial in potential spreading paths. However, they turn out to have low centralities as well. The most central nodes correspond to a spe-cific population, composed of nodes whose neighborhood is composed by approximately one half of internal links and one half of external links. We call them “linkers”, as they are effectively responsible for the connectivity between the departments and act as bridges (Wasserman & Faust, 1994) between them.
4.2 Linkers and spreading processes
As the linker behavior seems to be associated with high node centralities in the aggre-gated contact network, we consider here the effect on a potential epidemic spread of a containment strategy targeting linkers. Although it is expected that the precise detection (and vaccination) of the nodes with the highest centrality would be more efficient, as the correlation between linkers and high centrality nodes is not perfect, the detection of linker behavior relies a priori on less information than the computation of betweenness centralities and might thus represent an interesting alternative. We show in Fig. 10 the result of simulated SIR processes on the temporal contact network when a fraction of nodes are vaccinated, i.e. considered immune to infection (they can neither be infected nor transmit the infection), according to different strategies. The figure shows that the targeted vaccination of linkers decreases the probability to observe a large outbreak, and, in the case of such an outbreak, limits its size. This strategy is much more efficient than random vaccination, and, for a vaccination rate of 20 %, performs almost as well as a strategy based on centrality, with a strongly decreased outbreak probability. For a small vaccination rate (5%), the outbreak probability is not much reduced, but, in case of outbreak, the resulting epidemic sizes are clearly smaller than for a random vaccination strategy.
0.0004 0.001 0.002 0.005 0.01 0.015 0.02 0.0 0.1 0.2 0.3 0.4 0.5 0.6 Betweenness centrality Linkers Random No vaccination 0.0004 0.001 0.002 0.005 0.01 0.015 0.02 0 20 40 60 80
100 Betweenness centralityLinkers RandomNo vaccination
0.0004 0.001 0.002 0.005 0.01 0.015 0.02 0.0 0.1 0.2 0.3 0.4 0.5 0.6 Betweenness centrality Linkers Random No vaccination 0.0004 0.001 0.002 0.005 0.01 0.015 0.02 0 20 40 60 80
100 Betweenness centralityLinkers RandomNo vaccination
0.0004 0.001 0.002 0.005 0.01 0.015 0.02 0.0 0.1 0.2 0.3 0.4 0.5 0.6 Betweenness centrality Linkers Random No vaccination 0.0004 0.001 0.002 0.005 0.01 0.015 0.02 0 20 40 60 80
100 Betweenness centralityLinkers RandomNo vaccination
f f f N N N β β β β β β a) b) c) d) e) f ) 5% 10% 20%
Fig. 10. Vaccination strategies. We simulate SIR epidemics on the time-resolved contact network, withβ/µ = 1000, in order to test different vaccination strategies. In each case we perform 1000 realizations. a), c), e) Fraction f of epidemics that reach more than 10 individuals. b), d), f) Size distribution of these large epidemics. For each strategy we vaccinate nodes according to the following rules: highest betweenness centralities, best linkers (fraction of internal links closest to 0.5) and random choice. We also plot the case without vaccination as a reference.
4.3 Stability of the linker behavior
Linkers are defined as nodes with approximately 50 % external links, based on the network aggregated over the two weeks data set. If we perform the same analysis on data restricted to either of the weeks, we do not necessarily find the same nodes, as the fine structure of the networks fluctuates a lot from one day to another, as highlighted in the previous section. We investigate this point in Fig. 11 by plotting, for each node with a linker behavior in the global two weeks aggregated networks, its betweenness centrality versus its fraction of external links in each of the two networks aggregated over one week. Though some of these nodes would not be selected as linkers if we restricted the data to one week, their behavior can still be considered as linker-like, as the fraction of external links remains between 40 % and 60 % for most of them. Only two nodes (150 and 255) are insiders one week and linkers the other week. The linker behavior thus seem rather stable over time, and a one week data set may be enough to find linkers. To check this hypothesis, we perform simulations of
0.0 0.2 0.4 0.6 0.8 1.0 0.00 0.02 0.04 0.06 0.08 0.10 0.12 0.14 0.16 0.18 80 119 123 131 134 150 222 255 751 804 b f
Fig. 11. Stability of linker behavior during the two weeks. For each node defined as a linker from the two weeks of data, we plot its characteristics based on each week’s data (squares). Circles show their positions according to the full two weeks of data.
an SIR model using data corresponding to one of the two weeks of the study, and use a vaccination strategy targeting the linkers defined using data from the other week. Figure 12 shows that, although this strategy performs less well than the strategy using linkers defined from the full two weeks data, it still largely outperforms random vaccination in reducing the risk of large outbreaks and the size of large epidemics. The reduced efficiency obtained when using data from one week to define a strategy applied in the other week is reminiscent of the results of (Starnini et al., 2013) showing a limit in the efficiency of vaccination strategies due to the fluctuations of contact networks.
5 Discussion
In this paper, we analyzed data describing the contacts between individuals in the context of an office building. Not all individuals participated in the study, which means that the data cover only a part of the real contact network. As the sampled fraction is quite high, and uniform among the departments, we assume that the behavior of the sampled population is representative of the whole.
Under this caveat, we have shown that, in this situation, many statistical features of contacts are similar to the ones measured in different contexts, with some important speci-ficities. First, contacts are very sparse, which for instance tends to hinder the spread of infectious diseases, especially rapidly spreading ones. Second, the contact network is struc-tured in communities that approximately match the organization in departments of the building. The connections between departments do not reflect their spatial organization in the building, but rather their roles: the three scientific departments form a cluster, whereas human resources and logistics are more isolated. The structure is thus very different from a homogeneous mixing hypothesis, with important consequences on the design of agent-based models of e.g. epidemic spreading processes.
The presence of a strong community structure linked to the organization in departments in the contact network has led us to define three node behaviors, depending on the fraction
0.0004 0.001 0.002 0.005 0.01 0.015 0.02 0.0 0.1 0.2 0.3 0.4 0.5 0.6 Betweenness centrality Linkers Random No vaccination 0.0004 0.001 0.002 0.005 0.01 0.015 0.02 0 20 40 60 80
100 Betweenness centralityLinkers RandomNo vaccination
0.0004 0.001 0.002 0.005 0.01 0.015 0.02 0.0 0.1 0.2 0.3 0.4 0.5 0.6 Betweenness centrality Linkers Random No vaccination 0.0004 0.001 0.002 0.005 0.01 0.015 0.02 0 20 40 60 80
100 Betweenness centralityLinkers RandomNo vaccination
f f N N β β β β a) b) c) d) W1 W2
Fig. 12. Efficiency of sampling over one week. We simulate SIR epidemics on the temporal contact network, withβ/µ = 1000, over only one week of data, with vaccination strategies based on data from the other week. In each case 10 % of the population was vaccinated. The labels indicate on which week the vaccination strategies were defined.
of links each node shares within its own department: residents, whose links are mostly internal; wanderers, whose links are mostly external; linkers, whose links are half internal, half external, and therefore connect departments, acting as bridges between communities (Wasserman & Faust, 1994; Salath´e & Jones, 2010). Empirically, the most central nodes of the network turn out to be linkers. As a consequence, targeted vaccination strategies based on the linker criterion efficiently prevents epidemic outbreaks. This behavior is also stable enough on the scale of one week for such a strategy to remain efficient if based on fewer data.
The precise identification of linker behavior relies on the knowledge of the contact net-work. One could thus argue that it requires almost as much knowledge as the identification of the nodes with highest betweenness centrality. However, the linker behavior, contrary to the betweenness centrality criterion, may be more easily linked to recognizable human behavior or to individual attributes in the organizational chart, for instance in relation to professional grade or specific activities. In this case, one could a priori discern which individuals are more susceptible to be linkers and play an important role in the event of an outbreak, and therefore use such limited information to design an efficient vaccination strategy entailing only a low cost in terms of necessary information (Smieszek & Salath´e, 2013; Chowell & Viboud, 2013). We final note that the linker behavior might also be identified from limited information in other social contexts with communities – schools, hospitals, etc – and provide an important ingredient in agent-based models of epidemic spreading phenomena, as such agents provide crucial gateways between communities. Moreover, in the perspective of modelling and studying epidemic processes in real, large-scale systems, obtaining a complete data set of contacts between individuals in a large-large-scale
population seems beyond reach, so that this type of criterion could be a way to uncover the central elements who could be targeted for outbreak detection and control.
6 Acknowledgments
We thank the direction of the InVS for accepting to host this study in their facility, and all the participants to the study. We acknowledge the SocioPatterns2 collaboration for providing the sensing platform that was used in the collection of the contact data. M.G., I.B. and A.B. are partially supported by the French ANR project HarMS-flu (ANR-12-MONU-0018); C.L.V. and A.B. are partially supported by the EU FET project Multiplex 317532.
References
Ajelli, Marco, Gonc¸alves, Bruno, Balcan, Duygu, Colizza, Vittoria, Hu, Hao, Ramasco, Jose, Merler, Stefano, & Vespignani, Alessandro. (2010). Comparing large-scale computational approaches to epidemic modeling: Agent-based versus structured metapopulation models. BMC Infectious Diseases, 10(1), 190.
Ajelli, Marco, Poletti, Piero, Melegaro, Alessia, & Merler, Stefano. (2014). The role of different social contexts in shaping influenza transmission during the 2009 pandemic. Scientific reports, 4, 7218.
Barab`asi, A.-L. (2005). The origin of bursts and heavy tails in human dynamics. Nature, 435, 207. Barrat, A., Cattuto, C., Colizza, V., Gesualdo, F., Isella, L., Pandolfi, E., Pinton, J.-F., Rav`a, L., Rizzo,
C., Romano, M., Stehl´e, J., Tozzi, A.E., & Broeck, W. (2013). Empirical temporal networks of face-to-face human interactions. The European Physical Journal Special Topics, 222(6), 1295– 1309.
Barrat, A., Cattuto, C., Tozzi, A. E., Vanhems, P., & Voirin, N. (2014). Measuring contact patterns with wearable sensors: methods, data characteristics and applications to data-driven simulations of infectious diseases. Clinical Microbiology and Infections, 20(1), 10–16.
Blower, Sally, & Go, Myong-Hyun. (2011). The importance of including dynamic social networks when modeling epidemics of airborne infections: does increasing complexity increase accuracy? BMC Medicine, 9(1), 88.
Brown, Chlo¨e, Efstratiou, Christos, Leontiadis, Ilias, Quercia, Daniele, Mascolo, Cecilia, Scott, James, & Key, Peter. (2014a). The architecture of innovation: Tracking face-to-face interactions with ubicomp technologies. Pages 811–822 of: Proceedings of the 2014 ACM International Joint Conference on Pervasive and Ubiquitous Computing. UbiComp ’14. New York, NY, USA: ACM. Brown, Chlo¨e, Efstratiou, Christos, Leontiadis, Ilias, Quercia, Daniele, & Mascolo, Cecilia. (2014b). Tracking serendipitous interactions: How individual cultures shape the office. Pages 1072–1081 of: Proceedings of the 17th ACM Conference on Computer Supported Cooperative Work & Social Computing. CSCW ’14. New York, NY, USA: ACM.
Castellano, C, & Pastor-Satorras, R. (2012). Competing activation mechanisms in epidemics on networks. Sci rep, 2, 371.
Cattuto, Ciro, Van den Broeck, Wouter, Barrat, Alain, Colizza, Vittoria, Pinton, Jean-Franc¸ois, & Vespignani, Alessandro. (2010). Dynamics of person-to-person interactions from distributed RFID sensor networks. PLoS ONE, 5(7), e11596.
Chowell, Gerardo, & Viboud, C´ecile. (2013). A practical method to target individuals for outbreak detection and control. BMC Medicine, 11(1), 36.
Christley, R. M., Pinchbeck, G. L., Bowers, R. G., Clancy, D., French, N. P., Bennett, R., & Turner, J. (2005). Infection in social networks: Using network analysis to identify high-risk individuals. American journal of epidemiology, 162(10), 1024–1031.
Dall’Asta, Luca, Barrat, Alain, Barth´elemy, Marc, & Vespignani, Alessandro. (2006). Vulnerability of weighted networks. Journal of Statistical Mechanics: Theory and Experiment, 2006(04), P04006.
Davey, Victoria J., Glass, Robert J., Min, H. Jason, Beyeler, Walter E., & Glass, Laura M. (2008). Effective, robust design of community mitigation for pandemic influenza: A systematic examination of proposed US guidance. PLoS ONE, 3(7).
Eagle, Nathan, Pentland, Alex (Sandy), & Lazer, David. (2009). Inferring friendship network structure by using mobile phone data. Proceedings of the National Academy of Sciences, 106(36), 15274–15278.
Fournet, Julie, & Barrat, Alain. (2014). Contact patterns among high school students. PLoS ONE, 9(9), e107878.
Gauvin, L., Panisson, A., Cattuto, C., & Barrat, A. (2013). Activity clocks: spreading dynamics on temporal networks of human contact. Scientific Reports, 3, 3099.
Gauvin, Laetitia, Panisson, Andr, & Cattuto, Ciro. (2014). Detecting the community structure and activity patterns of temporal networks: A non-negative tensor factorization approach. Plos one, 9(1), e86028.
Gemmetto, V, Barrat, A, & Cattuto, C. (2014). Mitigation of infectious disease at school: targeted class closure vs school closure. Preprint, arXiv:1408.7038.
Granovetter, M. (1973). The strength of weak ties. American Journal of Sociology, 78, 1360 – 1380. H´ebert-Dufresne, Laurent, Allard, Antoine, Young, Jean-Gabriel, & Dub´e, Louis J. (2013). Global
efficiency of local immunization on complex networks. Scientific Reports, 3. Holme, Petter, & Saram¨aki, J. (2012). Temporal networks. Physics reports, 1–28.
Holme, Petter, Kim, Beom Jun, Yoon, Chang No, & Han, Seung Kee. (2002). Attack vulnerability of complex networks. Physical Review E, 65(May), 056109.
Isella, Lorenzo, Romano, Mariateresa, Barrat, Alain, Cattuto, Ciro, Colizza, Vittoria, Van den Broeck, Wouter, Gesualdo, Francesco, Pandolfi, Elisabetta, Rav`a, Lucilla, Rizzo, Caterina, & Tozzi, Alberto Eugenio. (2011a). Close encounters in a pediatric ward: measuring face-to-face proximity and mixing patterns with wearable sensors. PLoS ONE, 6(2), e17144.
Isella, Lorenzo, Stehl´e, Juliette, Barrat, Alain, Cattuto, Ciro, Pinton, Jean-Franc¸ois, & Van den Broeck, Wouter. (2011b). What’s in a crowd? Analysis of face-to-face behavioral networks. Journal of Theoretical Biology, 271(1), 166–180.
Karsai, M., Kivela, M., Pan, R. K., Kaski, K., Kertesz, J., Barab´asi, A. L., & Saram¨aki, J. (2011). Small but slow world: How network topology and burstiness slow down spreading. Physical Review E, 83(2, 2).
Kitsak, Maksim, Gallos, Lazaros K, Havlin, Shlomo, Liljeros, Fredrik, Muchnik, Lev, Stanley, H Eugene, & Makse, Hern´an A. (2010). Identification of influential spreaders in complex networks. Nature Physics, 6(11), 888–893.
Lee, Sungmin, Rocha, Luis E. C., Liljeros, Fredrik, & Holme, Petter. (2012). Exploiting temporal network structures of human interaction to effectively immunize populations. PLoS ONE, 7(5), e36439.
Machens, Anna, Gesualdo, Francesco, Rizzo, Caterina, Tozzi, Alberto, Barrat, Alain, & Cattuto, Ciro. (2013). An infectious disease model on empirical networks of human contact: bridging the gap between dynamic network data and contact matrices. BMC Infectious Diseases, 13(1), 185.
Maslov, Sergei, & Sneppen, Kim. (2002). Specificity and stability in topology of protein networks. Science, 296(5569), 910–913.
Merler, Stefano, & Ajelli, Marco. (2010). The role of population heterogeneity and human mobility in the spread of pandemic influenza. Proceedings of the Royal Society B-Biological Sciences, 277(1681), 557–565.
Mossong, Jo¨el, Hens, Niel, Jit, Mark, Beutels, Philippe, Auranen, Kari, Mikolajczyk, Rafael, Massari, Marco, Salmaso, Stefania, Tomba, Gianpaolo Scalia, Wallinga, Jacco, Heijne, Janneke, Sadkowska-Todys, Malgorzata, Rosinska, Magdalena, & Edmunds, W. John. (2008). Social contacts and mixing patterns relevant to the spread of infectious diseases. PLoS Medicine, 5(3), e74.
Onnela, Jukka-Pekka, Saram¨aki, Jari, Hyv¨onen, J¨orkki, Szab´o, G´abor, de Menezes, M Argollo, Kaski, Kimmo, Barab´asi, Albert-L´aszl´o, & Kert´esz, J´nos. (2007). Analysis of a large-scale weighted network of one-to-one human communication. New Journal of Physics, 9(6), 179. Opsahl, Tore, Agneessens, Filip, & Skvoretz, John. (2010). Node centrality in weighted networks:
Generalizing degree and shortest paths. Social Networks, 32(3), 245 – 251.
Pastor-Satorras, Romualdo, & Vespignani, Alessandro. (2002). Immunization of complex networks. Physical Review E, 65(Feb), 036104.
Penn, Alan, Desyllas, Jake, & Vaughan, Laura. (1999). The space of innovation: interaction and communication in the work environment. Environment and Planning B: Planning and Design, 26(2), 193–218.
Pfitzner, Ren´e, Scholtes, Ingo, Garas, Antonios, Tessone, Claudio J., & Schweitzer, Frank. (2013). Betweenness preference: Quantifying correlations in the topological dynamics of temporal networks. Physical Review Letters, 110(May), 198701.
Read, J. M., Edmunds, W. J., Riley, S., Lessler, J., & Cummings, D. A. T. (2012). Close encounters of the infectious kind: methods to measure social mixing behaviour. Epidemiology and Infection, 140(12), 2117–2130.
Sailer, Kerstin, & McCulloh, Ian. (2012). Social networks and spatial configurationhow office layouts drive social interaction. Social Networks, 34(1), 47 – 58. Capturing Context: Integrating Spatial and Social Network Analyses.
Salath´e, Marcel, & Jones, James H. (2010). Dynamics and control of diseases in networks with community structure. PLoS Computational Biology, 6(4), e1000736.
Salath´e, Marcel, Kazandjieva, Maria, Lee, Jung Woo, Levis, Philip, Feldman, Marcus W., & Jones, James H. (2010). A high-resolution human contact network for infectious disease transmission. Proceedings of the National Academy of Sciences, 107(51), 22020–22025.
Scholtes, Ingo, Wider, Nicolas, Pfitzner, Ren´e, Garas, Antonio, Tessone, Claudio J, & Schweitzer, Frank. (2014). Causality-driven slow-down and speed-up of diffusion in non-markovian temporal networks. Nature communications, 5, 5024.
Smieszek, Timo, & Salath´e, Marcel. (2013). A low-cost method to assess the epidemiological importance of individuals in controlling infectious disease outbreaks. BMC Medicine, 11(1), 35. Smieszek, Timo, Fiebig, Lena, & Scholz, Roland. (2009). Models of epidemics: when contact
repetition and clustering should be included. Theoretical Biology and Medical Modelling, 6(1), 11.
Starnini, Michele, Machens, Anna, Cattuto, Ciro, Barrat, Alain, & Pastor-Satorras, Romualdo. (2013). Immunization strategies for epidemic processes in time-varying contact networks. Journal of Theoretical Biology, 337(0), 89 – 100.
Stehl´e, Juliette, Voirin, Nicolas, Barrat, Alain, Cattuto, Ciro, Isella, Lorenzo, Pinton, Jean-Franois, Quaggiotto, Marco, Van den Broeck, Wouter, R´egis, Corinne, Lina, Bruno, & Vanhems, Philippe. (2011a). High-resolution measurements of face-to-face contact patterns in a primary school. PLoS ONE, 6(8), e23176.
Stehl´e, Juliette, Voirin, Nicolas, Barrat, Alain, Cattuto, Ciro, Colizza, Vittoria, Isella, Lorenzo, R´egis, Corinne, Pinton, Jean-Franc¸ois, Khanafer, Nagham, Van den Broeck, Wouter, & Vanhems, Philippe. (2011b). Simulation of an SEIR infectious disease model on the dynamic contact network of conference attendees. BMC Medicine, 9(1), 87.
Stopczynski, Arkadiusz, Sekara, Vedran, Sapiezynski, Piotr, Cuttone, Andrea, Madsen, Mette My, Larsen, Jakob Eg, & Lehmann, Sune. (2014). Measuring large-scale social networks with high resolution. PLoS ONE, 9(4), e95978.
Vanhems, Philippe, Barrat, Alain, Cattuto, Ciro, Pinton, Jean-Franc¸ois, Khanafer, Nagham, R´egis, Corinne, Kim, Byeul-a, Comte, Brigitte, & Voirin, Nicolas. (2013). Estimating potential infection transmission routes in hospital wards using wearable proximity sensors. PLoS ONE, 8(9), e73970. Vu, Long, Nahrstedt, Klara, Retika, Samuel, & Gupta, Indranil. (2010). Joint Bluetooth/Wifi scanning framework for characterizing and leveraging people movement in University campus. Pages 257–265 of: MSWIM 2010: Proceedings of the 13th ACM International Conference on Modeling, Analysis, and Simulation of Wireless and Mobile Systems. 1515 Broadway, New York, NY 10036-9998 USA: ASSOC Computing Machinery, for ACM SIGSIM.
Wasserman, S., & Faust, K. (1994). Social network analysis: Methods and applications. Cambridge: Cambridge University Press.
Zhang, Yan, Wang, Lin, Zhang, Yi-Qing, & Li, Xiang. (2012). Towards a temporal network analysis of interactive WiFi users. EPL, 98(6).