HAL Id: hal-01738447
https://hal.archives-ouvertes.fr/hal-01738447
Submitted on 20 Mar 2018
HAL is a multi-disciplinary open access
archive for the deposit and dissemination of
sci-entific research documents, whether they are
pub-lished or not. The documents may come from
teaching and research institutions in France or
abroad, or from public or private research centers.
L’archive ouverte pluridisciplinaire HAL, est
destinée au dépôt et à la diffusion de documents
scientifiques de niveau recherche, publiés ou non,
émanant des établissements d’enseignement et de
recherche français ou étrangers, des laboratoires
publics ou privés.
Effect of SET temperature on data retention
performances of HfO2-based RRAM cells
T. Cabout, E. Vianello, E. Jalaguier, H. Grampeix, G. Molas, P. Blaise, O.
Cueto, M. Guillermet, J. Nodin, L. Perniola, et al.
To cite this version:
T. Cabout, E. Vianello, E. Jalaguier, H. Grampeix, G. Molas, et al.. Effect of SET temperature
on data retention performances of HfO2-based RRAM cells. 2014 IEEE 6th International Memory
Workshop (IMW), May 2014, Taipei, France. �10.1109/IMW.2014.6849355�. �hal-01738447�
Effect of SET temperature on data retention
performances of HfO
2
-based RRAM cells
T. Cabout, E. Vianello, E. Jalaguier, H. Grampeix,
G. Molas, P. Blaise, O. Cueto,
M. Guillermet, J.F. Nodin, L. Perniola
CEA LETI, MINATEC Campus, 17 rue des Martyrs 38054 Grenoble, France. [email protected]
S. Blonkowski, S. Jeannot, S. Denorme, P. Candelier
STMicroelectronics, 850 rue Jean Monnet 38920 Crolles, France
M. Bocquet, C. Muller
Im2np, UMR CNRS 7334, Aix Marseille Université, 38 rue Joliot Curie 13451 Marseille Cedex 20, France
Abstract—In this paper the effect of SET temperature on
data-retention performances in HfO2-based RRAM has been
thoroughly investigated. We demonstrated, for the first time to our knowledge, that high temperature programming (even if it has no influence on the initial resistance) has a strong effect on thermal stability of the conductive filaments. Moreover, we highlighted the impact of SET temperature also on RESET characteristics. We gathered all these experimental evidences under a simple modeling of the filament morphology, proving that the filament size might be tuned by adjusting the programming temperature. We conclude that reducing the conductive filament diameter while keeping high density of the oxygen vacancies significantly improves data retention.
Index Terms— Resistive-switching random access memory
(RRAM), data retention, temperature, modeling.
I.INTRODUCTION
Oxide-based Resistive Random Access Memories (RRAM), rely on the reversible switching of transition metal oxide between high (HRS) and low (LRS) resistance states. Due to key advantages such as scalability, low-voltage, high-speed, it has attracted a lot of interest in the last years [1]. However reliability issues still need further investigations. As retention is one of the main concerns, much attention was turned toward the dissolution mechanism of conductive filament (CF) responsible for spontaneous back-switching to HRS [2,3]. In [4] we demonstrated excellent stability for more than 106 s at 150°C. In [2] it has been recently demonstrated
that data retention performances strongly depend on the current compliance, but the effect of programming temperature was not considered yet.
This work investigates the effect of programming temperature on CF stability under high temperature stress. We evidenced degradation of data retention performances in LRS after high temperature SET. To corroborate this result, we showed that the high temperature programming changes current required to RESET the device. A modeling approach for both data retention and RESET operation is proposed.
The devices under test are 1T/1R HfO2-based memory cells
relying on 65 nm CMOS technology. RRAM memory stack
consists of a 5 nm thick HfO2 layer deposited by ALD and
sandwiched between bottom TiN(35 nm) and top Ti(10 nm)/TiN(50 nm) electrodes deposited by PVD.
II.DATA-RETENTION ANALYSIS
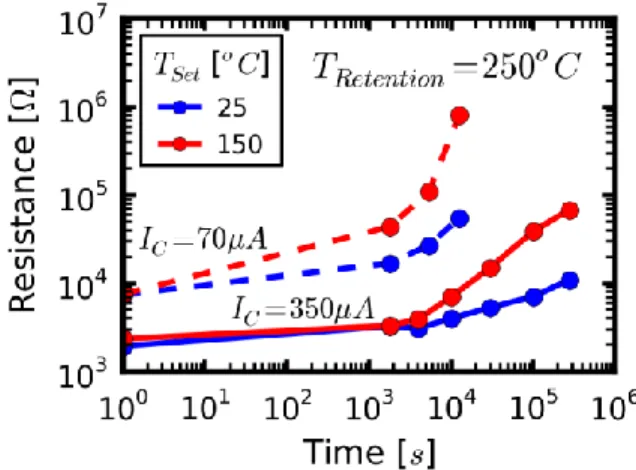
To apprehend the influence of SET temperature on retention properties, devices were written at 25 or 150°C before being backed at 250°C for up to 106 s. In addition, two current
compliances i.e. 350 µA and 70 µA were tested. The time-dependent evolution of average of LRS resistance is shown in Fig. 1. Regarding initial states, the SET temperature has no effect on LRS average resistance (same initial resistances for red and blue curves in Fig. 1), however devices programmed at high temperature (red curves in Fig. 1) exhibit stronger degradation. This phenomenon is even reinforced when working at lower compliance current (i.e. dash-lines).
To confirm that LRS resistance does not depend on SET temperature, we performed quasi-static cycling at various current compliances, IC, and temperatures (from 25 to 200°C).
Fig. 1. High temperature data-retention testing at 250°C for two SET temperatures (25°C in blue, 150°C in red) and for two current compliances (continuous lines 350 µA, dashed lines 70 µA). The characteristics are average on 20 devices.
Fig. 2. Dependence of LRS resistance with compliance current from different temperatures from 25 to 200°C. Each point corresponds to an average on 20 SET/RESET cycles performed on 5 devices.
The average LRS resistance shown in Fig. 2 is inversely proportional to IC [5] but it does not depend on temperature.
This is coherent with the self-limiting CF growth in SET operation [5]: the voltage decrease across the RRAM, as its resistance drops, slows down the CF growing rate establishing a negative feedback loop. In [5] it has been demonstrated that the resulting resistance is mainly fixed by electrical parameters and it does not depend on oxide nature. Fig. 2 shows that the resulting resistance is also independent of temperature.
III.SET TEMPERATURE IMPACT ON RESET CURRENT
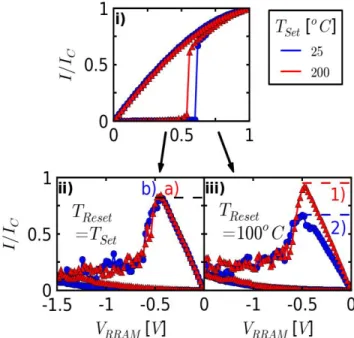
To gain a better insight on the effect of SET temperature on resulting LRS state, we measured systematically RESET current-voltage (I-V) characteristics. Devices were SET at two different temperatures (25 and 200°C) with a current compliance of ~350 µA (Fig. 3i); then it were erased either at SET temperature (Fig. 3ii) or at 100°C (Fig. 3iii). For each RESET I-V characteristic, the maximum RESET current (IRESET) was extracted and its temperature-dependent evolution
is reported in Fig. 4 (points 1, 2, a, b).
When SET and RESET operations are performed at the same temperature, IRESET is proportional to IC: IRESET ≈ 0.8×IC as
shown in Fig. 4 (black dashed line). In [6] it was demonstrated that at room temperature IRESET/IC is independent of compliance
current, being proportional to a universal constant. Fig. 4 shows that IRESET/IC is also independent on the cycling temperature.
Regarding RESET operation carried out at 100°C, we demonstrated the clear effect of SET temperature on normalized RESET current (Fig. 3iii). Indeed, as compared to the previously reported proportionality factor of 0.8, IRESET/IC is
shown to increase with SET temperature (yellow line in Fig. 4). When SET temperature is higher (resp. lower) than RESET temperature, IRESET/IC is larger (resp. lower) than 0.8 as shown
in point 1 (resp. point 2) in Fig. 4. Note that this study was reproduced for different RESET temperatures and same results were obtained (not shown here). These results tend to confirm the observations done on data retention: SET temperature influences the resulting LRS state even if the resistance is kept
constant. This suggests a direct effect at nanoscale in modifying the CF.
In addition, as previously reported in [4], RESET operation is thermally activated. Considering LRS obtained at fixed temperature (vertical line on Fig. 4) and comparing RESET operations at different temperatures, normalized RESET current decreases as RESET temperature increases (points 1 and a for TSET=200° C ; points 2 and b for TSET=25° C in
Fig. 4).
Fig. 3. Typical current-voltage (I-V) characteristics of i) SET operations performed at different temperatures (25°C in blue and 200°C in red) and by using a current compliance of ~350 µA; ii) RESET operations performed at the corresponding SET temperatures shown in i) (25°C in blue and 200°C in red); iii) RESET operations performed at 100°C after SET operations shown in i).
Fig. 4. IRESET/IC current ratio as a function of SET temperature in different
experimental conditions. Black dashed line corresponds to RESET and SET operations performed at the same temperature (ii in Fig. 3), while yellow line is associated with RESET operations performed at 100°C for SET achieved at various temperatures (iii in Fig. 3).
IV.ANALYSIS AND MODELING
A. Data retention modeling
From data retention experiments and measurements of RESET current, we showed that SET temperature tends to modify the nanostructure of CF without changing its resistance. To confirm this hypothesis, we developed 2D Gaussian diffusion data retention model inspired by Ref. [7]. The initial CF, with a radius RCF, was defined as a 2D homogenous disk of
punctual Dirac distribution of defects density n0, whose
diffusion law is analytically represented by eq. 1. By integrating the 2D Gaussian diffusion terms (nD) over the initial
CF, we obtained equation 2. In equations 1 and 2, nCF is the
density of defects of CF, r the distance from the center of CF, t time, D diffusion coefficient. To link the 2D density to resistance in LRS, we adapted conduction model from [8] where conductivity depends on defects density (equations 3 and 4). In these equations, σ is the electrical conductivity, β a pre-factor, EA an activation energy, kb Boltzmann constant, T
temperature, EA0 an activation energy at nCF=0, and nTAT
denotes the density at the transition from a metallic-like conduction (EA=0) to a trap-assisted (TA) conduction (EA>0).
In order to determine the conduction parameters, we used the results presented in [9] obtained by first principles simulations. Assuming HfO2 layer to have an atom density of
about 1029 m-3 and Hf
2O3 oxide to be semi-metallic [9], we
calibrated the model with a semi-metallic like conductivity of 2.8×10⁴ S.m-1 for a defects density of 1.5×1028 m-3
corresponding to the transition from HfO2 to Hf2O3. Figure 5
shows the calculated conductivity as a function of the defects density using parameters summarized in Table 1. Finally 2D conductivity map was linked to CF resistance R by using equation 5 in which h represents HfO2 layer thickness.
𝑛𝐷(𝑟, 𝑡) = 𝑛0𝐷 4.𝜋.𝐷.𝑡𝑒 −(𝑟−𝑟0)2 4.𝐷.𝑡 (1) 𝑛𝐶𝐹(𝑡, 𝑟) = ∫ ∫ 𝑟0. 𝑛0 4.𝜋.𝐷.𝑡𝑒 −(𝑟−𝑟0)24.𝐷.𝑡 . 𝑑𝜃. 𝑑𝑟0 𝑅𝐶𝐹 𝑟0=0 2𝜋 𝜃=0 (2) 𝜎(𝑛𝐶𝐹) = 𝛽. 𝑛𝐶𝐹. 𝑒 −𝐸𝐴 𝑘𝑏.𝑇 (3) 𝐸𝐴= { 0, if 𝑛 ≥ 𝑛𝑇𝐴𝑇 𝐸𝐴0− 𝑛 𝐸𝐴0 𝑛𝑇𝐴𝑇, if 𝑛 < 𝑛𝑇𝐴𝑇 (4) 𝑅 = ℎ 2𝜋 ∫𝑟=0𝑅𝐶𝐹𝑟.𝜎(𝑟).𝑑𝑟 (5)
Fig. 5. Calculated conductivity as a function of the defects density using parameters summarized in Table I.
From this model, we were able to describe the progressive dissolution of two CF with the same resistance but having different radii (i.e. RCF1 = 5 nm and RCF2 = 7 nm) and different
defects densities (i.e. n01=1.45×1028 m-3 and n02=7.5×1027 m-3).
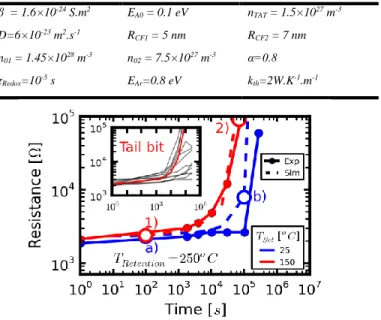
Fig. 6 shows simulated retention curves for these two CF configurations. An excellent agreement is obtained with tail bits extracted from experiments presented in Fig. 1 (inset in Fig. 6). The smallest and densest CF appears more stable in time than the largest one with lowest defects density. Fig. 7 represents 2D maps of conductivity σ after 102 and 105 s. The
larger filament with lower initial defects density (1 and 2 of Fig. 7) switches first to a lower conductivity state as its defects density reaches the transition threshold (n<nTAT, corresponding
to the discontinuity point in Fig. 6).
TABLE I. RETENTION AND RESET MODEL PARAMETERS
β = 1.6×10⁻²⁴ S.m2 E A0 = 0.1 eV nTAT = 1.5×1027 m-3 D=6×10-23 m2.s-1 R CF1 = 5 nm RCF2 = 7 nm n01 = 1.45×1028 m-3 n02 = 7.5×1027 m-3 α=0.8 τRedox=10-5 s EAr=0.8 eV kth=2W.K-1.m-1
Fig. 6. Experimental data retention characteristics of tail bits at 250°C obtained with different SET temperatures (25°C in blue and 200°C in red) and simulation using two different initial CF configurations (RCF1=5nm in blue
dashed lines and RCF2=7nm in red dashed lines). Inset represents tail bits
selected from results shown in Fig. 1.
Fig. 7. 2D simulated conductivity σ maps corresponding to simulation presented in Fig. 6 after 102 s (a and 1) and 105 s (b and 2). The two
configurations correspond to the same initial resistance of R=2.3 kΩ, while after 105 s CF resistances are different (b) R = 7.8 kΩ, (2) R = 440 kΩ.
At the onset of transition from semi-metallic-like conduction to trap-assisted conduction, a resistance increase is observed. As in [3], it has been shown that data retention performances depend on the defects density and size of CF. Larger filaments with lower defects density are less stable in time. These results suggest that CF filaments formed at high (resp. low) temperature are larger (resp. smaller) with a lower (resp. larger) density of defects. This is compatible with a thermally activated defect generation/diffusion SET model [10]. Enhanced defect generation/diffusion at high temperature results in a CF with larger radius and lower defects density.
B. RESET current modeling
To further confirm this hypothesis, we used the modeling approach described in [11]. Destruction of CF during RESET is modeled from redox-based equation 6 and local temperature is computing using equation 7). In these equations VRRAM is the
voltage applied on the device, q the elementary charge, EAr the
redox activation energy, α the charge transfer coefficient and
τRedox the nominal redox rate. For RESET operation current
flowing through the cell (I) can be approximated with the one passing through the CF. The latter is obtained from equation 8 where F is the electrical field and σ is taken from equation 3. Used parameters are summarized in Table I.
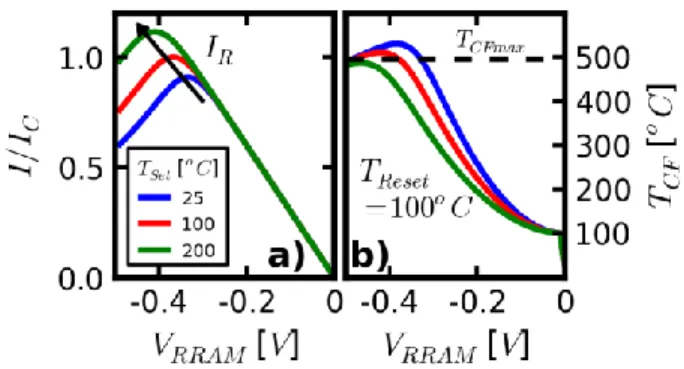
As done in the previous section, we were able to obtain CFs having the same resistance using different radii and defects densities. Consistently with retention simulation, we attributed the largest filament with lowest defects density to high SET temperature (Fig. 8a). Using these initial conductive filaments for RESET simulation, results shown in Fig. 4. were satisfactorily reproduced, i.e. evolution of IRESET/IC current ratio
as a function of SET temperature (Fig. 8b). Detailed I-V and temperature-voltage (T-V) characteristics are respectively shown in Fig. 9a and 9b. Fig. 9b indicates that RESET occurs at a fixed maximum local temperature called TCFmax. Since
local temperature is directly correlated to current density, the same current density has to be reached to reset the device. This is in agreement with the observed thermal activation of RESET operation reported in Fig. 4.
𝑑 𝑛𝐶𝐹 𝑑𝑡 = − 𝑛𝐶𝐹 𝜏𝑅𝑒𝑑𝑂𝑥. 𝑒 −𝐸𝐴𝑟+𝑞.(1−𝛼).𝑉𝑅𝑅𝐴𝑀 𝑘𝑏.𝑇 (6) 𝑇 = 𝑇𝑎𝑚𝑏+ 𝑉𝑅𝑅𝐴𝑀2 2.𝑘𝑡ℎ . 𝜎 (7) 𝐼 = 𝐹. 𝜋. 𝜎. 𝑅𝐶𝐹2 (8) V.CONCLUSION
To summarize, we report for the first time the effect of SET temperature on retention performances in LRS. It was shown that high temperature programming strongly degrades the thermal stability of CF while keeping the same resistance. Besides, detailed analysis of RESET I-V characteristics reveals an increase of RESET current for high SET temperature.
Using diffusion based retention and redox based reset models, these results were explained by a modification of the nanostructure (radius and defects density) of CF with temperature. Higher SET temperature tends to create larger
filaments having worse time stability and requiring higher RESET current.
Fig. 8. a) RCF and nCF parameters used to model CF created at various
temperatures and having a resistance of 1 kΩ. b) Experimental (symbols taken from Fig. 4) and corresponding simulated (lines) of IRESET/IC ratio at different
SET temperatures.
Fig. 9. Simulated RESET I-V characteristics (a) and corresponding local CF temperature/voltage characteristics (b) at TRESET=100°C starting from LRS
states reached at different temperatures.
VI.REFERENCES
[1] H.S. Philip Wong, “Metal-Oxide RRAM”, Proceeding of the IEEE, Vol. 100, No 6, 2012.
[2] Y.Y. Chen, “Endurance/Retention trade-off on HfO2/Metal cap 1T1R
bipolar RRAM”, IEEE TED, Vol. 60, No 3, 2013.
[3] T. Ninomiya et al., “Conductive filament scaling of TaOx bipolar
ReRAM for improving data retention under low operation current”, IEEE TED, Vol. 60, No. 4, 2013.
[4] T. Cabout et al., “Temperature impact (up to 200°C) on performance and reliability of HfO2-based RRAMs”, IMW, 2013.
[5] D. Ielmini, “Filamentary-switching model in RRAM for time, energy and scaling projections”, IEDM, 2011.
[6] D. Ielmini et al., “Universal Reset characteristics of unipolar and bipolar Metal-Oxide RRAM”, IEEE TED, Vol. 58, No 10, 2011.
[7] Z. Wei et al., “Retention Model for High-density ReRAM”, IMW, 2012. [8] S. Larentis et al., “Resistive Switching by Voltage-Driven Ion Migration in Bipolar RRAM – Part II: Modeling”, IEEE TED, Vol. 59, No. 9, 2012.
[9] K.H. Xue et al., “Prediction of Semimetallic Tetragonal Hf2O3 and Zr2O3
from First Principles”, Phys. Rev. Lett. 110, 065502, 2013.
[10] L. Vandelli et al., “Comprehensive physical modeling of forming and switching operations in HfO2 RRAM devices”, IEDM, 2011.
[11] M. Bocquet et al., “Robust Compact Model for Bipolar Oxide-Based Resistive Switching Memories”, IEEE TED, in press, 2014.