HAL Id: halshs-00175061
https://halshs.archives-ouvertes.fr/halshs-00175061
Submitted on 26 Sep 2007
HAL is a multi-disciplinary open access archive for the deposit and dissemination of sci-entific research documents, whether they are pub-lished or not. The documents may come from teaching and research institutions in France or abroad, or from public or private research centers.
L’archive ouverte pluridisciplinaire HAL, est destinée au dépôt et à la diffusion de documents scientifiques de niveau recherche, publiés ou non, émanant des établissements d’enseignement et de recherche français ou étrangers, des laboratoires publics ou privés.
Cooperation, Competition, and Risk Attitudes: An
Intergenerational Field and Laboratory Experiment
Gary Charness, Marie Claire Villeval
To cite this version:
Gary Charness, Marie Claire Villeval. Cooperation, Competition, and Risk Attitudes: An Intergen-erational Field and Laboratory Experiment. 2007. �halshs-00175061�
IZA DP No. 2574
Cooperation, Competition, and Risk Attitudes:
An Intergenerational Field and Laboratory Experiment
Gary Charness Marie-Claire Villeval
DISCUSSION P
APER SERIES
Forschungsinstitut zur Zukunft der Arbeit Institute for the Study of Labor
Cooperation, Competition, and Risk
Attitudes: An Intergenerational
Field and Laboratory Experiment
Gary Charness
University of California, Santa Barbara
Marie-Claire Villeval
CNRS-GATE and IZA
Discussion Paper No. 2574
January 2007
IZA P.O. Box 7240 53072 Bonn Germany Phone: +49-228-3894-0 Fax: +49-228-3894-180 E-mail: [email protected]Any opinions expressed here are those of the author(s) and not those of the institute. Research disseminated by IZA may include views on policy, but the institute itself takes no institutional policy positions.
The Institute for the Study of Labor (IZA) in Bonn is a local and virtual international research center and a place of communication between science, politics and business. IZA is an independent nonprofit company supported by Deutsche Post World Net. The center is associated with the University of Bonn and offers a stimulating research environment through its research networks, research support, and visitors and doctoral programs. IZA engages in (i) original and internationally competitive research in all fields of labor economics, (ii) development of policy concepts, and (iii) dissemination of research results and concepts to the interested public.
IZA Discussion Papers often represent preliminary work and are circulated to encourage discussion. Citation of such a paper should account for its provisional character. A revised version may be available directly from the author.
IZA Discussion Paper No. 2574 January 2007
ABSTRACT
Cooperation, Competition, and Risk Attitudes:
An Intergenerational Field and Laboratory Experiment
*The population of most developed societies is ‘graying’. As life expectancy increases and the large baby-boom generation approaches retirement age, this has critical consequences for maintaining a high standard of living and the sustainability of pension systems. In the light of these labor-force and social concerns, we consider experimentally the comparative behavior of juniors (under 30) and seniors (over 50) in both experiments conducted onsite with the employees of two large firms and in a conventional laboratory environment with students and retirees. Our results are compelling. First, seniors are not more risk-averse, as opposed to the conventional stereotype. Second, both juniors and seniors react to the competitiveness of the environment and there is no significant difference in performance in the real-effort task across the generations when they are competing. Third, seniors are typically more cooperative than juniors in a team-production game. Cooperation is highest in groups in which there is a mix of juniors and seniors, suggesting that there are indeed benefits in maintaining a work force with diversity in age. Overall, the implication is that it is beneficial to define additional short-term incentives near the end of the workers’ career to motivate and to retain older workers. A secondary, but important, issue is the external validity of conventional laboratory experiments. In general we do not find strong differences in behavior between workers and non-workers, indicating that laboratory experiments may not be such a bad approximation for the field environment.
JEL Classification: A13, B49, C91, C93, J14, J18, J38, J70
Keywords: age, performance, labor market, discrimination, diversity, stereotypes, experiments
Corresponding author:
Marie-Claire Villeval CNRS-GATE
93, Chemin des Mouilles 69130 Ecully
France
E-mail: [email protected]
*
The authors are greatly indebted to GAMBRO and to RENAULT TRUCKS for their collaboration in this research. The authors are grateful to M. Le Boulaire, A.L. Ruis Belles, P. Guittet, P. Arnaud, L. Dugros, L. Vidon, M. Bouamoud, M. Bembellat, and the municipality of St Genis les Ollières for their help. We thank Kathryn Shaw and participants at the 1st EWEBE workshop in Valencia for their comments. We thank R. Zeiliger for programming the experiment and for his research assistance. This research was supported by grants from MiRe-DREES at the French Ministry of Social Affairs and from the ACI program at the French Ministry of research.
1
1. INTRODUCTION
The population of most developed societies is ‘graying’. Life expectancy continues to increase, while fertility has been declining. At the same time, the large baby-boom generation is approaching (or in some countries, has reached) retirement age. The combination of these factors has critical consequences for maintaining productivity and a high standard of living in these societies. An immediate consideration involves the funding of pension systems, since in many societies workers are still retiring at an early age and in many cases the replacement generation of young workers is small.1
Further implications of aging for human resource policies include an increasing heterogeneity of the workforce, likely to lead to an increased need for inter-generational cooperation and an increase in the capacity of the firm to organize the transfer of knowledge between the old and the new generations. In addition, there may well be new requirements in terms of competences and adaptability due to more rapid organizational and technological change entailing skill obsolescence.
As mentioned in Kovalchik, Camerer, Grether, Plott, and Allman (2005), there is a common belief that ability and performance declines with aging (see Peters, Finucane, MacGregor, and Slovic, 2000). The tension between this belief and seniority-based wage policies plays against the employment of seniors, leading to discrimination against the hiring of seniors (Bendik, Brown, and Wall, 1999; Riach and Rich, 2006). 2
1
See Banks, Blundell, Disney, and Emmerson (2002) for a discussion of the sustainability of public-pension programs in European countries. The labor-force participation rate for employees between the ages of 50 and 64 was only 53% in France and Germany in 2003, 64% in the United Kingdom, 67% in the U.S.A., 68% in Japan and 74% in Sweden (OECD, 2006).
2
In a survey conducted in the United States in 2002, two-thirds of employees between 45 and 75 years of age report having witnessed or personally suffered from age discrimination in their company (OECD, 2006). This seems to be
2
The importance of negative stereotypes about seniors was highlighted in a recent OECD report (OECD, 2006). This report mentions survey results showing that even in Sweden, where the participation rate of the seniors is the highest, half of the employers believe that seniors are less flexible and less willing to change. A survey in the United States reveals that even if employers believe that seniors are more reliable and determined than juniors, seniors are also believed to be less willing to learn. A third survey indicates that the lower adaptability to technical change is the most common reason French employers state for not employing people over the age of fifty (Monso and Tomasini, 2003).3
But are these views justified? Studying the wage premium for experience, Katz and Murphy (1992) have shown that older workers are less affected by their degree of technological skills. This may be partly due to the ability of older workers to compensate in other ways (e.g., with better judgment, intuition, or self-knowledge). Nevertheless, to answer this question it is essential to study the implications of aging on behavior, individual and group decision-making and abilities. In particular, are there different attitudes towards dimensions that are critical to the management of innovation, such as cooperation (see for example Ichniowski, Shaw and Gant, 2003), competition and sensitivity to incentives, and risk-taking?
Another important issue concerns the effect of age heterogeneity on group performance. Lazear (1998a) suggest that heterogeneity with respect to group composition may be desirable, as there are possible gains in production from complementarities among workers. He also argues particularly true for females: in a labor-market experiment, Lahey (2005) finds that a younger female worker is more than 40% more likely to be offered an interview than an older female worker.
3 There is a negative correlation between senior employment and the introduction of innovation (Aubert, Caroli, and
Roger, 2004; Hujer and Radic, 2006). Some suggest that technical and organizational changes are age-biased against seniors through a direct negative effect on their productivity (Behagel and Greenan, 2005). Others suggest that this bias results from the relatively small time horizon before retirement, which discourages employers to provide seniors with the training necessary to cope with innovation (d’Autume, Betbeze, and Hairault, 2005). Bartel and Sicherman (1993) show that, due to the diversity of access to training, employees retire at higher ages in industries characterized by a permanent higher rate of innovation, and retire early when the introduction of innovation is more sporadic.
3
that young employees have new ideas and more skill with new technologies, while older employees have knowledge about firm structure and relevant markets and networks (Lazear, 1998b).4 Hamilton, Nickerson, and Owan (2003, 2004) examine how group composition affects productivity under team incentives, using field data from a garment factory. They find that teams with more heterogeneous ability levels are indeed more productive, which is consistent with mutual learning across types and the notion of complementarities. On the other hand, demographic heterogeneity, in terms of ethnicity and age, has a negative impact on productivity.
To date, economists have focused more on the macro-economic dimensions of aging for the future of pension systems and on its micro-economic implications on the labor market than on its behavioral implications.5 Yet, a behavioral analysis of the impact of aging on decision-making may help in understanding how firms can, in the coming years, deal with the major issues mentioned above. Here, we wish to assess the behavior and attitudes of old and young cohorts, to provide an analysis of the impact of age and age pairing on attitudes toward cooperation and competition, and to gather data on the effects of endogenous or exogenous age pairing.
In this light, we consider experimentally the comparative behavior of juniors (under 30) and seniors (over 50) in rather novel subject pools. First, we conduct experiments with employees at two large French firms at their work sites. Second, we conduct a conventional laboratory experiment, where we invite students and retirees. The laboratory experiment allows us to extend the age dispersion in the observations. It is also justified by the fact that survey data on the relationship between productivity and age frequently suffer from a selection bias, since
4 Similarly, Bellmann, Kistler, and Wahse (2003) find that a majority of the managers of German firms assign
advantages to older employees for know-how, working morale, and awareness of quality, while assigning advantages to younger employees regarding ability, willingness to learn, and physical resilience.
5
One experimental exception is Kovalchik et al. (2005), who find that older adults’ decision behavior is generally similar to that of students in several experimental tasks. Also, Holm and Nystedt (2004) find that a younger cohort exhibits considerably more trust than does an older cohort in a mail-based game in Sweden, and that participants prefer to place trust in other people in their own age cohort. These studies are discussed in more detail in section 2.
4
one cannot otherwise observe those older potential workers who are no longer employed. Our design permits more comprehensive comparisons of productivity and behavior. Our experiments consist of a public-goods (or team production) game in which we vary whether participants are informed about the age composition of their three-person groups, a real-effort task (solving anagrams) in which individuals can choose a piece-rate pay scheme or can elect to compete against a counterpart for a higher pay rate if successful (but a lower pay rate if unsuccessful), and a test of the degree of risk aversion. We also ask people for their preferences with respect to age composition in one phase of the public-goods (team-production) experiment.
To clarify our contribution, a number of other researchers have experimentally, empirically, or theoretically considered the question of how one’s age and the age composition of groups might affect issues of decision-making and performance, particularly in work environments. However, we are at least one of the first to go directly to the workplace and conduct direct tests of behavior and performance. In addition, we are unaware of any other study that explores this issue across a work environment and a laboratory environment, or that brings both students and retirees together in a laboratory. Lastly, we bring new results on the impact of generation on the level of cooperation and risk taking, on the degree of competitiveness and on sensitivity to incentives; we also show how the willingness to cooperate and to compete are affected by the generation of the group members; and we provide the first results on the effects of age and heterogeneity on behavior in a team-production game.
Our results are compelling and may surprise many people, including human-resource managers. First, seniors are not more risk averse, as opposed to the conventional stereotype. Second, seniors react to incentives and the competitiveness of the environment as strongly as juniors and there is no significant difference in performance in the real-effort task across the
5
generations. Third, seniors are typically more cooperative than juniors, in the sense of making more contributions to team production while being less conditional than juniors. In accordance with the results in Lazear (1998b), we observe beneficial effects from having groups in which there is a mix of juniors and seniors, suggesting that there are indeed benefits or complementarities in maintaining a work force with diversity in age; it is also interesting that the participants reveal a preference for being in age-heterogeneous groups and do not express a taste for age discrimination. Overall, the implication is that it may well be inadvisable to exclude seniors from the labor force; instead defining additional short-term incentives near the end of a worker’s career to retain and to motivate older workers may provide great benefits to society.
A secondary, but important, issue is the external validity of conventional laboratory experiments, as students may well not be the most representative sample upon which to base vital policy decisions. Gneezy and List (2006) contend that gift exchange is an ephemeral laboratory phenomenon and that it is unprofitable for employers to rely upon it when setting wages. Levitt and List (2006) suggest that results obtained inside and outside of the laboratory need not correspond, in part due to differences in the demographics in these different environments. We test whether we observe differences in behavior across working and non-working subpopulations. In general we do not find strong differences in behavior between workers and non-workers, indicating that laboratory experiments may not be such a bad approximation for the field environment; however, we do observe some modest differences in the behavior of students compared to the other groups, for example, students contribute less in the team-production game.
The remainder of this paper is organized as follows. In section 2, we discuss the related literature, and in section 3, we describe our experimental methodology. In section 4, we present our results, and in section 5 we discuss the implications of these results. Section 6 concludes.
6
2. RELATED LITERATURE
The two main theories of the labor market that establish a relationship between age and productivity deliver opposite predictions. On the one hand, the firm-specific human-capital theory (Becker, 1975) states that firms with older employees should outperform other firms as long as the growth of specific human capital outweighs the wage growth over time; this observation also finds some support from the theory of job matching (Jovanovic, 1979), since seniors have had more time than juniors to find the best match on the labor market. On the other hand, the theory of deferred compensation (Lazear, 1979) states that juniors are paid below their marginal productivity whereas seniors with long tenure are paid above their marginal productivity, for the purpose of offering career incentives. The employment of seniors is therefore associated with a higher cost-benefit ratio. The question remains to determine whether for a given wage cost, juniors and seniors differ in their productivity levels (for a review of the literature on the estimation of life-cycle productivity, see Lumsdaine and Michell, 1999).6
Productivity may be influenced by the evolution of cognitive and behavioral abilities. As mentioned in the introduction, there are pervasive stereotypes about the declining decision-making ability of older individuals and their more cautious behavior in terms of risk attitude (see Nelson, 2002). Further, many people also appear to have views that older workers are less willing to learn, and implicitly less interested in working hard and competing (see OECD, 2006). The experimental research closest to ours is that conducted by Kovalchik et al. (2005). This innovative study compares the behavior of healthy elderly individuals (average age 82) and younger students (average age 20) with respect to confidence about their answers to trivia
6
The accessibility to employer-employee datasets has recently permitted an estimation of the seniors’ productivity, but the results are mixed. Hellerstein, Neumark and Troske (1999) find that seniors are paid more because they are more productive, whereas Aubert and Crépon (2004) find that productivity stabilizes after the age of 40.
7
questions, decision-making under uncertainty in gambling tasks, possible asymmetries between one’s willingness-to-pay (WTP) and willingness-to-accept (WTA) for an item (reflecting the “endowment effect”), and strategic thinking in the Nagel (1995) guessing game. Participants were interviewed individually, rather than in a group environment. The main conclusion of the paper is that it does not appear that older individuals do substantially worse on these decision-making tasks. Both cohorts displayed overconfidence, but this was lower for older individuals at intermediate levels of reported confidence; there were no significant differences across age cohorts in the gambling tasks. There were no significant differences between WTP and WTA for either cohort, and both young and old samples behave similarly in the guessing game.
The relationship between trust and age has been recently studied experimentally. Holm and Nystedt (2004) analyze behavior in the Berg, Dickhaut, and McCabe (1995) investment game, where a first mover can send some or all of his or her endowment to a responder, with the responder receiving triple the amount sent; the responder can then send back an amount to the first mover. This experiment was performed by sending out mail to people selected from a public database in Sweden; one cohort consisted of people 20 years old, while the other cohort consisted of people 70 years old. It was found that the young cohort sent significantly more as first movers than did the older cohort. While the average amount returned was similar for both cohorts, the proportions dispersed for the older responders, suggesting a greater degree of responsiveness to the environment; this result goes against the stereotype that older people are less adaptable.7
At the other end of the age spectrum, Harbaugh, Krause, and Liday (2003) find that children are more selfish than young adults and that individuals learn to become more fair. Their evidence shows that bargaining behavior changes substantially with age; most of this change
7 Studies conducted with representative surveys in Germany (Fehr et al., 2003) and the Netherlands (Bellemare and
8
appears to be related to changes in preferences for fairness, rather than bargaining ability. Younger children make and accept smaller ultimatum proposals than do older children. Sutter and Kocher (2004) find that the elderly appear to be more reciprocal, in a study with participants from various age groups, ranging from 8-year-old children to people in their late sixties. In their study, trust increases from early childhood to early adulthood, but stays constant thereafter.
Among the previous studies, only Holm and Nystedt (2004) manipulate the information about the partners’ generation and find that first movers were more trustful with members of their own age cohort. This raises the question of the composition of teams and its impact on behavior and performance. Some theoretical and empirical work in personnel economics or management sciences supports the view that a heterogeneous work force is likely to lead to higher productivity if there are useful complementarities or simply positive spillovers from more able or knowledgeable workers to other workers, particularly in an environment where people work closely together. Lazear (1998a) proposes a theory explaining the development of multi-cultural teams despite increased costs of communication. The diversity gains in such teams may overcome its costs if there are complementarities between workers, if the information or skill sets are not completely disjoint but are instead related, and if communication costs are not too high. Hamilton, Nickerson and Owan (2003, 2004) make a distinction between diversity in abilities and demographic diversity in teams. The first type of diversity may enhance productivity if there is mutual learning and cooperation, whereas demographic diversity is likely to harm productivity by making learning and peer pressure less effective. Using panel data from a garment plant, they show that teams with more heterogeneous workers achieve a higher productivity, supporting the Lazear (1998a) theory. However, holding the ability distribution constant, they observe that teams with a higher heterogeneity in age are less productive. They
9
suggest three reasons for a lower efficiency of demographic diversity: an inhibition of knowledge transfer, a reduction of peer pressure due to weaker social ties and a taste for discrimination.
However, it should be noted that the few studies examining the impact of age diversity in teams on performance have not reached a consensus. In the vein of Hamilton, Nickerson and Owan (2004), some studies identify a negative correlation between heterogeneity in age and within-team cohesion and communication (Zenger and Lawrence, 1989) or the growth of sales (Simons, Pelled, and Smith, 1999; Leonard and Levine, 2004). On the other hand, other studies (Pelled, Eisenhardt, and Xin, 1999; Kilduff, Angelmar and Mehra, 2000) conclude this heterogeneity has a positive impact on overall team performance.
Grund and Westergård-Nielsen (2005) use a comprehensive linked employer-employee dataset covering the whole population of firms and employees in Denmark to estimate the relationship between the corporate age structure and the value-added per employee. They obtain an inverse U-shaped relationship between mean age of employees and firm performance; the same relationship is found with the age dispersion. This indicates that firms who have either a very homogenous or a very heterogeneous age structure perform less well than those who have a moderate degree of age dispersion. These results tend to support a combined version of the firm-specific human capital theory and the deferred compensation theory. Thus, in our team-production game we might expect that teams composed of participants with a mix of ages will achieve the highest level of contribution.
In contrast with the last studies, in this paper we focus on the impact of both the generation of individuals and the age structure of teams on individual behavior in various types of situations. It is only after analyzing the behavioral dimensions of age and diversity that we will derive an analysis of efficiency in teams.
10
3. EXPERIMENTAL DESIGN AND IMPLEMENTATION
Our experiment was comprised of three different decision-making tasks, performed in sequence. We conducted the sessions in both the field and the laboratory.
3.1 The decision tasks
Each session consisted of a team-production task designed to measure cooperation, and a real-effort task where competition was an integral aspect of the payoff structure, and a simple test of an individual’s degree of risk aversion.
The team-production task
The first task was a standard linear public-good game, featuring groups of three participants. There were 17 periods in this game, divided into three respective segments of eight periods, eight periods, and one period; we varied the sequence in the two eight-period segments to mitigate possible order effects. In one case, participants played a standard public-good game the first eight periods, in which no information is given about the generation of the other players. This was followed by eight periods in which information is provided about the generation composition of the group. In the second case, we began with eight periods in which information was provided, and followed this with eight periods without this information.
In both cases, a two-stage game (the ‘selection treatment’) was played in the 17th period. In the first stage of this game, each person could select the composition of his or her group; i.e., he or she chose to be matched with two juniors, two seniors, or one junior and one senior.8 The
8 Each person in the selection treatment was always matched with his or her generation composition. We
implemented this as follows: Suppose that person X chose to be matched with two seniors. We randomly drew two seniors in the session and added their contributions to that of person X to determine X’s payoff. Now, suppose that one of these two seniors, person Y, has expressed a preference to be matched with two juniors. We randomly drew two juniors from the population and added their contributions to that made by person Y determine Y’s payoff. In other words, a participant’s contribution may well be added to the contributions of people belonging to different
11
choice cannot depend on information about the others’ behavior in previous stages of the game, but could only be conditional on an exogenous attribute, i.e. the generation. The second stage of the game consisted of the contribution decision, as in the earlier periods.
At the beginning of each period, each group member i is endowed with 20 units. Each member simultaneously chose a fraction gi of his or her endowment to contribute to a group
project, while keeping the remainder in his or her private account. All funds in the group project paid a positive return to each member whatever his or her contribution. The marginal per capita return from a contribution to the group project was 0.5; this parameter value meant that full free-riding (contributing nothing) was the dominant strategy, whereas full contribution to the public good corresponded to the social optimum. Subject i’s payoff was given by:
!i = 20 " gi+ 0.5 gj j=1 3
#
. (1) After they have made their contribution decisions, the group members were informed of both the amount of the group contribution and their own individual payoffs.The no-information treatment allows us to determine whether juniors and seniors are equally cooperative or selfish in a group. The information treatment informs us about whether people condition the contribution to the group project on the generation composition of the group, and also indicates whether this effect (if any) differs across generations. The selection treatment tells us about the participants’ preferences between homogenous and heterogeneous groups in this game. It also provides evidence concerning whether people condition the willingness to cooperate on the possibility of choosing the generation composition of the group.
groups. This artifact guaranteed that each person’s matching preference was always respected, and it did not cause any subsequent problems, since this procedure was only used in the last period of this one-shot game.
12
The real-effort competition task
Our second task consisted of two stages. In the first stage, people were randomly matched in pairs, and each person received information about the generation (junior or senior) of the other person. Each person then simultaneously chose his or her payment scheme, having been informed about the task that must be performed in the second stage of the game; this task consisted of solving anagrams, as detailed below.9 The choice was between a payment scheme based on absolute performance and a tournament payment scheme. Before performing the task, each person was informed about his or her co-participant’s choice of payment scheme.
If an individual chose the pay scheme based on absolute performance, he or she was paid 18 points for every anagram subsequently solved. If both people in the pair chose the tournament, the person who creates most anagrams receives 30 points for every anagram solved, while the other person received six points for every anagram solved. In case of a tie, the winner was randomly selected. If only one person chose the tournament, he or she received 30 points for every anagram solved. Note that in our tournament, there is no fixed payment from winning per
se; instead, one’s payoff was increasing in the number of anagrams created, so that there was
always an incentive to exert full effort, even if one’s co-participant has decided to not compete. After a participant has chosen a payment scheme and received information about the co-participant’s choice, he or she has four minutes in which to perform the task. Anagrams must be solved from a series of seven letters.10 When the allotted time had elapsed, each person was only informed about the number of valid words he or she had created and the corresponding payoff.
Because one’s choice of payment scheme is likely to depend on one’s beliefs about both one’s own ability and the ability of the co-participant, we elicited the participants’ beliefs. After
9
The structure of this game is adapted from Datta Gupta, Poulsen and Villeval (2005).
10 We alternated between two series of three vowels and four consonants across sessions to counter the effect of a
13
choosing a payment scheme but before performing the task, people report the number of words they estimate they can generate in four minutes. This provides us with a measure of the individual’s self-confidence. Each person also estimated the average performance of juniors and seniors in the session. Every accurate answer paid one additional Euro. By comparing these values, we can observe whether an individual believes he or she is more, less, or equally able than the generation of the co-participant; this provides us with a proxy for the individual’s relative ability. We can also measure whether a person believes that seniors are on average less able at this task than juniors. These data allow us to observe whether juniors or seniors are more accurate when predicting their absolute and relative performance. This game indicates whether the attitude towards competition is affected by the individual’s generation. It provides us with measures of self-confidence and stereotypes in relation to an individual’s generation.
A test of risk aversion
At the end of the session, we used a very parsimonious procedure to elicit an individual’s degree of risk aversion, as in Charness and Gneezy (2003). Each person was endowed with 100 points and was confronted with a one-shot decision task, to choose how much of his or her endowment to invest in a risky asset and how much to keep. It is common information that there is an even chance for the investment in the risky asset to be a success or a failure. In case it fails, the amount invested is lost; in case of a success, the investment returns 2.5 times its amount. In addition to the amount of the risky investment, each person chose one of two colors. If the chosen color is randomly drawn in an even lottery, the risky investment is considered a success. If the subject decides on the basis of the expected value of the lottery, he should invest all his endowment in the risky asset. The lower the amount invested in the risky asset, the higher the degree of risk aversion. This test allows us to measure the sensitivity of risk aversion to age.
14
3.2 Artefactual field experiments and lab experiments
Our artefactual field experiments (Harrison and List, 2004) were conducted with 87 employees of two large private companies in the neighborhoods of Lyon, France.11 Forty-eight juniors below 30 years old and 39 seniors above 50 years of age participated in a total of seven sessions.12 The human-resource department in each company recruited volunteers by means of email and phone calls, with special attention to the balance of occupations (manager or non-manager) in each age category; volunteers were allocated to sessions so as to maintain a balance in terms of both generations and occupations. We wrote the text of the recruiting message that clearly mentioned participation in an experiment managed and funded by researchers.
At the beginning of each session, the participants were reminded that no individual data would be communicated to their company. At one firm, the experiment was conducted in the training center; it was conducted in a meeting room at the other firm. We equipped the rooms so that the usual laboratory conditions were met; in particular, each place was separated from the next by a high mobile fence; fences prevented people from seeing their neighbors. The experiment was computerized using the REGATE program developed at GATE (Zeiliger, 2000).
The experiment was replicated with 37 students and 35 retirees, in five sessions that were conducted at the Groupe d’Analyse et de Théorie Economique (GATE), CNRS, France. The students were recruited from undergraduate courses in local Engineering and Business schools. The retirees were recruited from various places in Lyon and in the neighborhood of Lyon, by
11 Gambro is a Swedish company and one of the leading makers of products used for dialysis for chronic kidney
disease. The Lyon facility produces plastic products for hemodialysers and employs about 600 employees. Renault Trucks is the second company in importance within the Volvo group, which is the leader in truck building in Europe. Its Lyon plant employs about 5,000 employees.
12
Initially we planned to recruitbelow 25 and above 55, but the age structure of the companies did not permit this. In France, where the official retirement age is 60, the participation rate of the 15-24 years old was 30% in 2003; the corresponding rates for the 55-59 years old, the 60-64 years old and above 64 were 54%, 13% and 2%, respectively, despite the introduction of a tax against the firing of seniors in the late nineties.
15
means of leaflets and phone calls to associations and one municipality. We contacted associations offering computer classes, as we needed to attract retirees able to use a computer.
In total, 159 subjects took part in this experiment. No subject participated in more than one session of the study. The working juniors who participated were on average 25.3 years old (min = 18, max = 29) and the working seniors 54.1 (min = 51, max = 57). The students were 20.6 years old on average (min = 18, max = 28) and the retirees were an average of 65.9 years old (min = 58, max = 77). Table 1 shows the session structure.
Table 1: Session structure
Location Treatment / Game Session # of subjects # of observations
Field No-Info /Info PG
Info /No-Info PG Selection PG* Anagram Competition* Risk decision** 1,3,5,7 2,4,6 1-7 1-7 2-7* 48 39 81 81 62 768 624 81 81 62
Laboratory No-Info /Info PG
Info /No-Info PG Selection PG Anagram Competition Risk decision 8,9 10,11,12 8-12 8-12 8-12 30 42 72 72 72 480 672 72 72 72 * For technical reasons, six subjects could not participate in the game after period 16.
** In the first session, we did not play the risk game due to time constraints.
At the beginning of the session, participants entered their age on their computer and chose between two colors.13 Next, the instructions for the first eight periods of the public-good game were distributed and read aloud; these instructions (see the Appendix) included a series of examples. The participants then filled out a questionnaire to check their understanding of this game; all questions were asked and answered privately. It was common information that the
13
We introduced this choice of colors (orange and green), in order to try to divert attention from the age issue. This artifact has almost no impact. The individuals who chose the orange color invested more in the test of risk attitude (5% level of significance) but the other decisions are not affected.
16
matching was random and that groups remained fixed for the first eight periods. New instructions were distributed for the next eight periods. People were aware that we re-matched the groups for the new series of periods and that the new groups were fixed for these periods. Finally, instructions were distributed for the selection treatment in period 17. During this game, a table was displayed on the subjects’ screen, with one row for each group member indicating when applicable the color chosen by the participant and his or her generation (junior or senior). In addition, a feedback table was available to remind one of his own contribution, the amount of the public good, and his or her payoff in each past period.
At the end of the previous game, we distributed the instructions for the competition game, we read them aloud, we checked for whether people understood the game, and we answered questions privately. As soon as the game was launched, each person was informed about the generation and color choice of his or her co-participant and then chose a payment scheme. We then elicited the beliefs about one’s own performance and the performance of juniors and seniors. At this point in time, we distributed a sheet of paper to each participant to record anagrams. Next, we read aloud the series of seven letters and started the clock. After four minutes had elapsed, an experimenter validated the number of qualifying words and entered this number on the computer, using a password. Except for this exercise, the experiment was fully computerized. After the completion of this game, we distributed the last set of instructions for the test of risk aversion. At the end of the session, participants reported their gender and occupational category.
On average, a session lasted 75 minutes, including reading of the consent form, initial instructions and payment of subjects. At the end of each session, subjects were individually given an envelope including their payment in cash. On average, subjects earned 24 Euros in
17
companies and 22 Euros in the laboratory. The show-up fee was !5, except in one company in which we raised it to !10, as the experiment was not conducted during working hours.
4. EXPERIMENTAL RESULTS
In this section, we first present the analysis of risk attitudes. Then, we analyze behavior in the team-production game. Last, we focus on the attitudes towards competition.
4.1 Risk attitudes
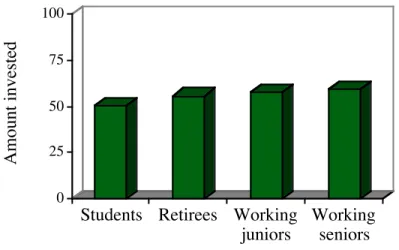
Figure 1 shows the average amount invested in the risky asset for each sub-population:
0 25 50 75 100 Amount invested
Students Retirees Working juniors
Working seniors
Figure 1 - Amounts invested in the risky asset
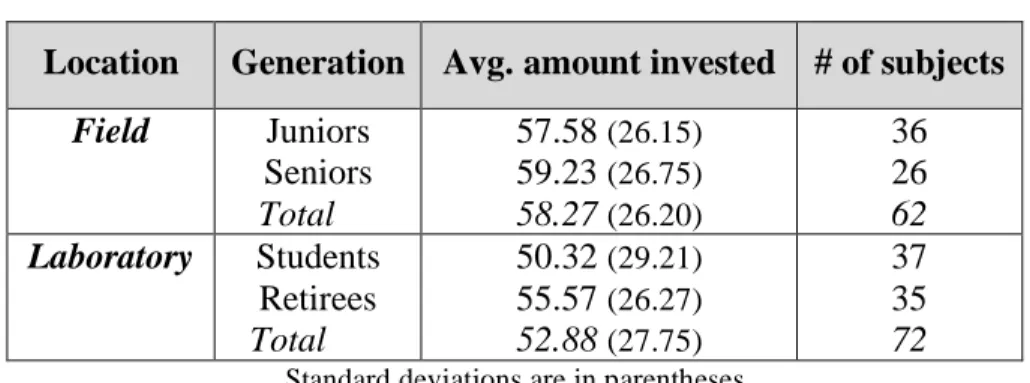
In terms of the idea that seniors would be more risk-averse than juniors, in fact retirees invest slightly more than students, and working seniors invest slightly more than working juniors. Table 2 shows the investment for each group.
18
Table 2: Investment in the test of risk aversion
Location Generation Avg. amount invested # of subjects
Field Juniors Seniors Total 57.58 (26.15) 59.23 (26.75) 58.27 (26.20) 36 26 62 Laboratory Students Retirees Total 50.32 (29.21) 55.57 (26.27) 52.88 (27.75) 37 35 72
Standard deviations are in parentheses
These observations are close to those by Andersen, Harrison, Lau and Rutström (2004), who compare the results of a field experiment on risk conducted on a representative sample of the Danish population with those from a lab experiment. They show that age has no significant impact on the average risk aversion; however when looking at individual behavior, they also observe that risk aversion tends to be greater for students than older people.
To analyze the determinants of the individual investment decision, we estimate a Tobit model accounting for the right censoring of observations. The exogenous variables include each generation, with the working juniors as the reference, and gender. Table 3 displays the results.
Table 3: Determinants of the investment decision
Amount invested Pooled data Student Working junior Working senior Retiree Gender (male=1) Constant -5.802 (7.423) Ref. 2.043 (8.129) -3.772 (7.485) 9.126* (5.541) 55.255*** (6.001) Nb observations
Right censored obs. (=100) Log likelihood LR chi2 Prob>chi2 Pseudo R2 134 22 -569.935 4.23 0.376 0.004
19
Table 3 confirms that there are no significant differences across generations or between working and non-working participants. Only gender is at all significant (but marginally), tending to confirm previous results (Eckel and Grossman, 2003; Charness and Gneezy, 2003) that males are less risk averse. This leads to our first result:
Result 1: There is very little difference in the average investment across juniors and seniors or across the field and the laboratory.
4.2 Attitudes toward cooperation in the team-production task
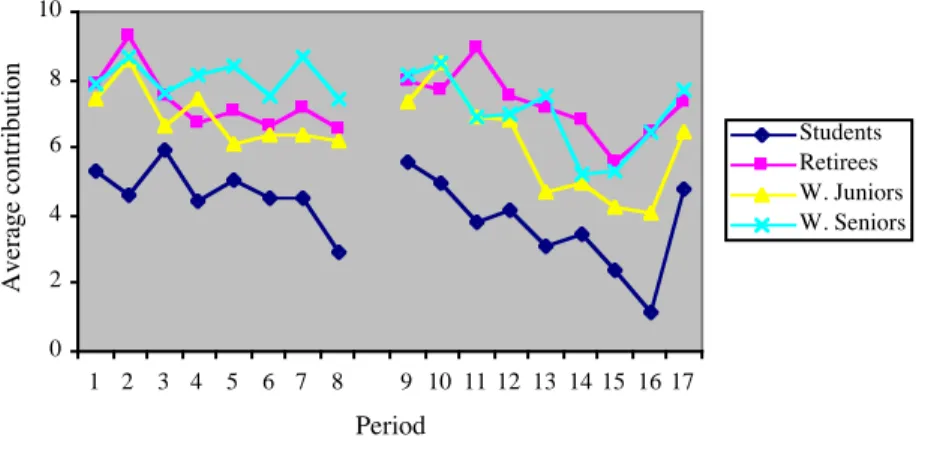
Figure 2 shows the contribution over time for each group in the team-production task:
Figure 2: Avg. individual contributions over time
0 2 4 6 8 10 1 2 3 4 5 6 7 8 9 10 11 12 13 14 15 16 17 Period Average contribution Students Retirees W. Juniors W. Seniors
The average contribution in the first 16 periods (exogenous matching) was 4.13 for students, 6.41 for working juniors, 7.31 for retirees, and 7.46 for working seniors. Contributions tend to decline over time, as is a standard result in the public-goods game, but the contribution of the seniors remains higher than that of the juniors in almost all periods. We also observe the familiar ‘re-start’ phenomenon, where contributions go up after a new group is formed in period 9; this is particularly strong for students and working juniors, perhaps in part because their level
20
of contributions is so low by period 16. Finally, there is a definite jump in contributions in period 17, when groups are formed endogenously with respect to generation, with an average increase of 2.32 from the contributions in period 16.
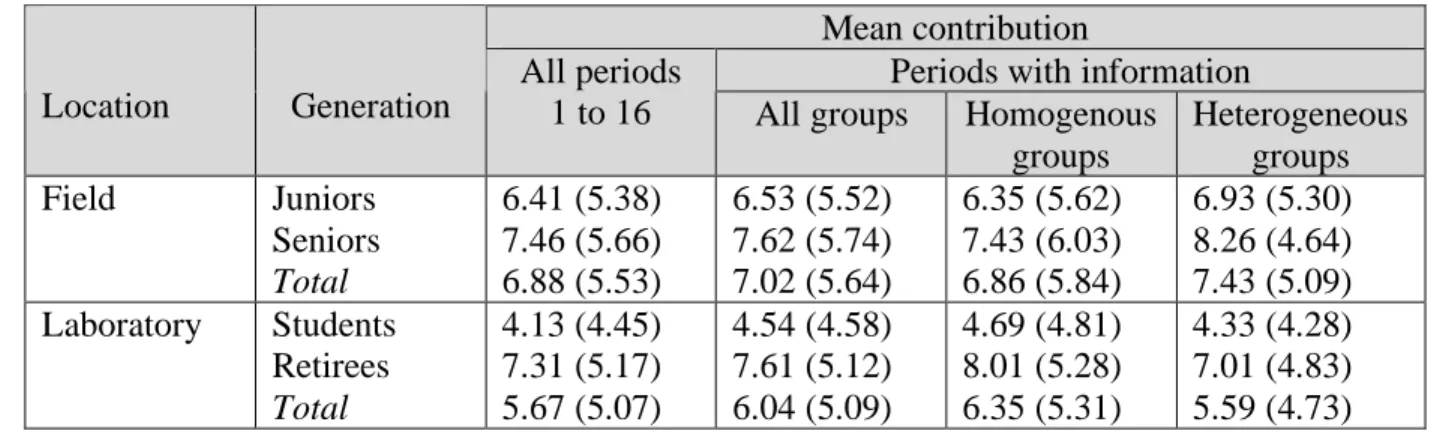
Recall that we vary whether information is provided about the composition of the group. The effects of information provision and heterogeneity on individual contribution and on the total group contribution in the team-production game are explored in Table 4 and Figure 3:
Table 4: Individual contributions in the team-production game
Mean contribution
Periods with information Location Generation
All periods
1 to 16 All groups Homogenous groups Heterogeneous groups Field Juniors Seniors Total 6.41 (5.38) 7.46 (5.66) 6.88 (5.53) 6.53 (5.52) 7.62 (5.74) 7.02 (5.64) 6.35 (5.62) 7.43 (6.03) 6.86 (5.84) 6.93 (5.30) 8.26 (4.64) 7.43 (5.09) Laboratory Students Retirees Total 4.13 (4.45) 7.31 (5.17) 5.67 (5.07) 4.54 (4.58) 7.61 (5.12) 6.04 (5.09) 4.69 (4.81) 8.01 (5.28) 6.35 (5.31) 4.33 (4.28) 7.01 (4.83) 5.59 (4.73) Standard deviations are in parentheses
0 5 10 15 20 25 30
Avg. group contribution
3 Juniors 2 Juniors, I Senior
1 Junior, 2 Seniors
3 Seniors
Figure 3 - Heterogeneous and homogenous group contributions
Field, no info Field, info Lab, no info Lab, info
21
While information provision increases group contributions in seven of the eight comparisons (statistically significant at p = 0.035, one-tailed binomial test), the effect is primarily present in the field data, as is shown in the regressions in Table 5 below. It is particularly strong in the field data when there is one junior and two seniors; in this case, the average group contribution is one-third higher (28 instead of 21) when information is available. It is however also noticeable in the lab when subjects learn they are in an all-student group. Groups with only seniors do contribute more than groups with only juniors, and the difference is especially salient in the lab. Nevertheless, in companies, mixed groups on average contribute the most, particularly when they are given information about the group composition, as would be natural in a workplace.
Table 4 shows that working seniors increase their average contribution when matched with juniors (although they might realize that the latter contribute less on average), as if to teach them the ‘good example’ of cooperation; juniors react to this by contributing more than in all-junior teams. This generates a cooperative dynamic. In contrast, in the laboratory, heterogeneous age groups are less efficient than homogenous groups, due to the large difference in juniors’ and seniors’ contributions. Indeed, when informed that they are interacting with seniors, students increase their free-riding on the retirees’ contributions and retirees react by contributing less than in an all-senior groups. This generates a non-cooperative dynamic. One interpretation is that heterogeneity should be encouraged, provided that each category’s behavior is not too divergent.
To explain the determinants of cooperation in the team-production game, we estimate a random-effects Tobit model; this accounts for the fact that we observe each participant’s decision sixteen times and controls for both the left and right censoring of the observations. The first
22
column of Table 5 displays the results of the regression when we pool the data from all the sessions; the second column presents the analysis of the field data and the third column the analysis of the data generated in the lab.
The exogenous variables include each age category (with the working juniors being the omitted category), gender, whether one is a manager, a variable interacting generation and whether one is a manager, and the risk attitude (measured by the amount invested in the risky asset). In addition, we control for whether the participant is informed about the age composition of his or her group, and we interact this variable with the number of seniors among team members. These two variables aim at determining whether people condition their willingness to cooperate on their level of information and on the age of their teammates. Since conditional cooperation is likely, we include in the regressions the team members’ average contribution to the public good in the previous period. We interact this variable with the generation to check whether seniors are more, less, or equally conditional than juniors. We control for a likely time trend in the level of contribution. Finally, we add a control for the order of treatments, to check whether informing the participants about the composition of their team at the beginning of the game influences behavior throughout the game.
23
Table 5: Determinants of cooperation in the team production game
Random-effects Tobit model Amount contributed to
the public good Pooled data (1) Field data (2) Lab data (3)
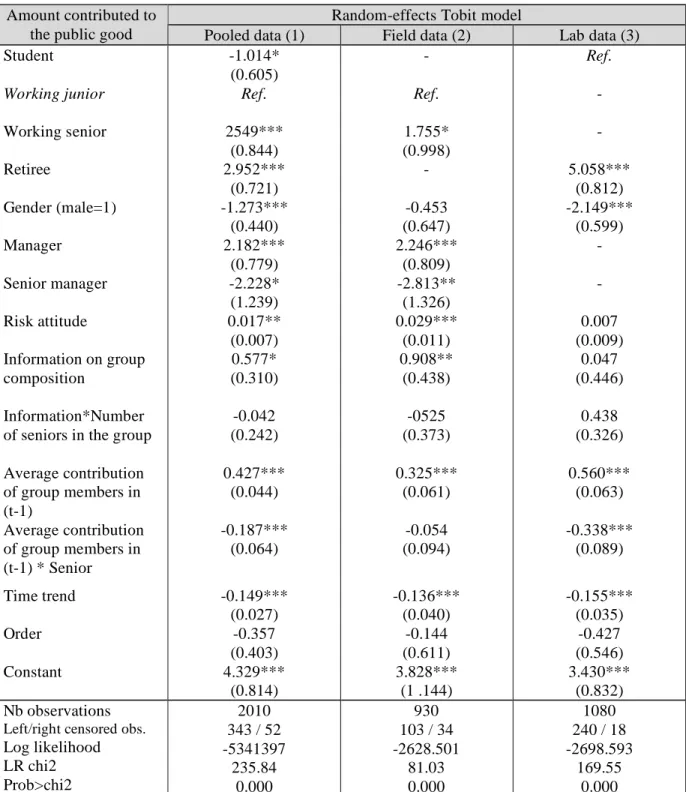
Student Working junior Working senior Retiree Gender (male=1) Manager Senior manager Risk attitude Information on group composition Information*Number of seniors in the group
Average contribution of group members in (t-1) Average contribution of group members in (t-1) * Senior Time trend Order Constant -1.014* (0.605) Ref. 2549*** (0.844) 2.952*** (0.721) -1.273*** (0.440) 2.182*** (0.779) -2.228* (1.239) 0.017** (0.007) 0.577* (0.310) -0.042 (0.242) 0.427*** (0.044) -0.187*** (0.064) -0.149*** (0.027) -0.357 (0.403) 4.329*** (0.814) - Ref. 1.755* (0.998) - -0.453 (0.647) 2.246*** (0.809) -2.813** (1.326) 0.029*** (0.011) 0.908** (0.438) -0525 (0.373) 0.325*** (0.061) -0.054 (0.094) -0.136*** (0.040) -0.144 (0.611) 3.828*** (1 .144) Ref. - - 5.058*** (0.812) -2.149*** (0.599) - - 0.007 (0.009) 0.047 (0.446) 0.438 (0.326) 0.560*** (0.063) -0.338*** (0.089) -0.155*** (0.035) -0.427 (0.546) 3.430*** (0.832) Nb observations
Left/right censored obs.
Log likelihood LR chi2 Prob>chi2 2010 343 / 52 -5341397 235.84 0.000 930 103 / 34 -2628.501 81.03 0.000 1080 240 / 18 -2698.593 169.55 0.000
Standard deviations are in parentheses. *** significant at the 0.01 level; ** at the 0.05 level; * at the 0.1 level.
The results in Table 5 indicate that both working seniors and retirees are significantly more cooperative than working juniors and that students are significantly less cooperative than
24
working juniors. We find a strong effect of the generation in the three regressions, and we can also suspect a positive impact of the experience of work on the level of cooperation. We also observe that males contribute less than females, a result that is controversial in the literature (see Eckel and Grossman, 2006), but this effect is only significant in the lab. Managers are more cooperative only when they are young. In the field data, those who are less risk averse are more willing to cooperate; this makes sense since cooperating in such a game is taking the risk of being a sucker if the team comprises free riders.14 This analysis supports our second finding:
Result 2: Seniors, whether working or retired, contribute more than juniors, whether working or students, in nearly all periods; students consistently contribute the least.
Consistent with the descriptive statistics above, we also observe that, in the pooled data, providing the participants with information about the composition of their group increases their level of cooperation. Interestingly, this effect is not driven by the age composition of the team and is not significant in the laboratory sample. This supports our third finding:
Result 3: Information provision per se improves team production for almost every group composition, but there is no effect from exogenous group composition of the group.
Not surprisingly, we observe that the participants condition their behavior on the contribution level of their teammates in the previous period. But our new finding is that this is less true for the retirees: they are less conditional than the other categories and this result probably explains the smoother evolution of their contributions over time displayed in Figure 2. Contributions decline over time in both samples. There is no order effect.
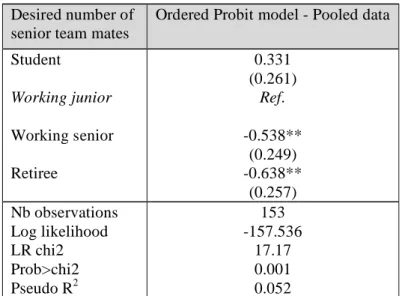
Next, we examine the results of the selection treatment played in period 17 with the pooled data. In Table 6, we analyze the determinants of the desired number of senior teammates,
14 A negative relationship between risk aversion and contribution in a repeated prisoner’s dilemma game has also
25
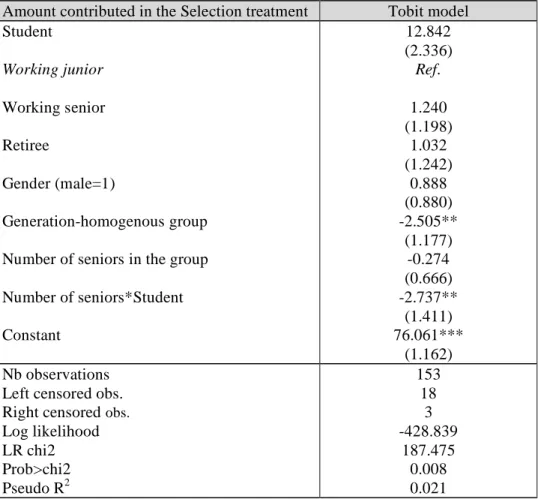
using an ordered-probit model, in which the explained variable can take values 0, 1, or 2. In Table 7, we then estimate the determinants of the contribution in period 17, using a Tobit model that accounts for the left and right censoring of the data.
Table 6: Desired number of senior teammates in the selection treatment
Desired number of senior team mates
Ordered Probit model - Pooled data
Student Working junior Working senior Retiree 0.331 (0.261) Ref. -0.538** (0.249) -0.638** (0.257) Nb observations Log likelihood LR chi2 Prob>chi2 Pseudo R2 153 -157.536 17.17 0.001 0.052
Standard deviations are in parentheses. ** significant at the 0.05 level.
The regression in Table 6 supports result 4:
Result 4: People have a preference for heterogeneous teams, since the number of desired senior teammates is significantly negatively correlated with being a senior.
In other words, there is no taste for discrimination regarding generations and there is no difference between students and working juniors. To delve more deeply into the motivation of such a choice, one must examine the contribution behavior, shown in Table 7.
26
Table 7: Determinants of contributions in the selection treatment
Amount contributed in the Selection treatment Tobit model Student Working junior Working senior Retiree Gender (male=1) Generation-homogenous group
Number of seniors in the group
Number of seniors*Student Constant 12.842 (2.336) Ref. 1.240 (1.198) 1.032 (1.242) 0.888 (0.880) -2.505** (1.177) -0.274 (0.666) -2.737** (1.411) 76.061*** (1.162) Nb observations
Left censored obs. Right censored obs.
Log likelihood LR chi2 Prob>chi2 Pseudo R2 153 18 3 -428.839 187.475 0.008 0.021
Standard deviations are in parentheses. *** significant at the 0.01 level; ** at the 0.05 level.
The regression displayed in Table 7 supports our fifth main finding:
Result 5:When group formation is endogenous, age-homogenous teams are less cooperative
than age-heterogeneous teams. Thus, diversity has a positive impact on performance.
However this cannot be directly related to the number of seniors in the group, as this variable is not significant. There is an exception, as students are willing to be matched with seniors and, conditional on this choice, they reduce the amount of their contribution. In other words, they try to exploit the retirees.
27
4.3 Attitudes toward competition and productivity in the real-effort task
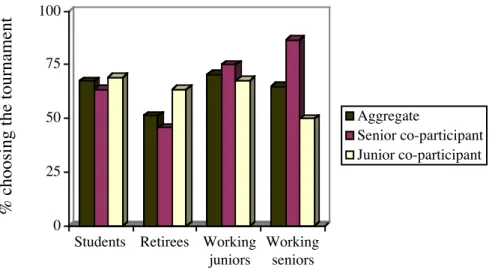
Figure 4 shows the proportion of people who chose to enter the tournament in each sub-population in the aggregate and according to whether the co-participant was junior or senior:
0 25 50 75 100
% choosing the tournament
Students Retirees Working juniors
Working seniors
Figure 4 - Tournament choice in the real-effort task
Aggregate
Senior co-participant Junior co-participant
We see that there is a slightly greater degree of competitiveness among the working sub-population. Juniors are more likely to enter the tournament than seniors; the difference is strongest for students and retirees. Table 8 shows the entry rates for each category.
Table 8: Tournament entry rates in the real-effort task
Location Generation Aggregate Rate N Senior co-participant N Junior co-participant N Juniors 0.705 44 0.750 16 0.679 28 Seniors 0.649 37 0.867 15 0.500 22 Field Total 0.679 81 0.807 31 0.600 50 Students 0.676 37 0.636 11 0.692 26 Retirees 0.514 35 0.458 24 0.636 11 Laboratory Total 0.597 72 0.514 35 0.676 37
Whereas retirees are more likely to enter the tournament when facing a junior co-participant, the opposite is true for working seniors. This leads to our sixth main finding:
28
Result 6: Contrary to stereotypes about older people being less responsive to their environment, both retirees and working seniors show much greater sensitivity to the type of co-participant than do students and working juniors.
The decision to enter the competition is influenced by beliefs about one’s own absolute and relative ability. The first column of Table 9 shows the beliefs about own performance (self-confidence) in number of words created for the individuals who chose the pay scheme based on absolute performance and those who chose the tournament. The second column indicates the rate of individuals who believe they are able to create more words than the generation of their co-participant (and potential opponent in the competition), since they report a higher belief about themselves than about the generation of their co-participant.
Table 9: Own-performance beliefs and chosen pay scheme
Beliefs on one’s ability (1) Beliefs on relative ability (2) Location Generation Absolute performance Tournament Absolute performance Tournament Juniors 4.00 (1.22) 6.26 (2.35) 0.154 (0.376) 0.129 (0.341) Seniors 7.23 (5.93) 7.83 (6.58) 0.154 (0.376) 0.292 (0.464) Field Total 5.62 (4.51) 6.95 (4.70) 0.154 (0.368) 0.200 (0.404) Students 7.50 (5.23) 8.12 (5.47) 0.083 (0.029) 0.440 (0.507) Retirees 5.94 (3.27) 11.44 (12.19) 0.059 (0.024) 0.500 (0.515) Laboratory Total 6.58 (4.18) 9.51 (8.95) 0.069 (0.026) 0.465 (0.505) Standard deviations are in parentheses
We observe a consistent pattern in Table 9: for every group, those people who choose the tournament are more self-confident than those who choose the pay scheme based on absolute performance. With the exception of the working juniors, the rate of individuals who believe they
29
are more able than their co-participant is dramatically higher among those who chose the tournament. Overall, the working participants, and especially the working juniors, report a lower expected ability and are less likely to feel better than their opponent’s generation than the non-working participants. It should also be noted that when we compare the individuals’ beliefs about own ability and the ability of own generation, seniors are less over-confident than juniors: only a minority think they are better than the average of their generation.15 Finally, when we compare self-confidence with the actual individual performance, workers are more optimistic than non-workers, especially when we compare working seniors with students.16
Figure 5 shows the average performance for each sub-population, according to whether people chose the pay scheme based on absolute performance, entered the tournament and won by default (when the co-participant has chosen not to compete), or entered the tournament and actually competed against another person who entered the tournament:
15
29.2% of the working juniors and 40.5% of the students believe they are better than their generation; the corresponding percentages for the working seniors and the retirees are 20.5 and 22.9, respectively.
16 56.8% of the working seniors and 65.9% of the working juniors performed better than they expected; the
30
Every group produces more words when choosing the tournament and actually competing than when choosing the pay scheme based on absolute performance. Despite the fact that there is incentive to produce more words even when one has won the tournament by default, all groups except retirees produce substantially more words when in an actual competition than when they win the tournament by default. Table 10 shows the performance for each category, along with the number of observations and the standard deviation.
Table 10: Performance in the real-effort task
Location Generation Absolute
performance N Tournament (default) N Tournament (compete) N Juniors 5.92 (4.09) 13 7.43 (3.55) 14 10.12 (4.50) 17 Seniors 7.85 (5.87) 13 5.86 (2.12) 7 10.76 (5.30) 17 Field Total 6.88 (5.05) 26 6.90 (3.18) 21 10.44 (4.85) 34 Students 10.58 (2.39) 12 9.00 (4.80) 7 12.06 (3.39) 18 Retirees 8.65 (4.31) 17 11.10 (4.01) 10 10.13 (5.11) 8 Laboratory Total 9.45 (3.72) 29 10.24 (4.34) 17 11.46 (3.99) 26
Standard deviations are in parentheses
We also see that working people seem to be much more motivated by actual competition, in comparison to winning the tournament by default; performance is more than 50% higher for this comparison in the workplace, but less than 15% higher in the laboratory.
To analyze the determinants of the individual performance, we estimate a model with a correction of the potential selection bias due to the choice of the payment scheme. To achieve this, we use the Heckman two-step estimation procedure. We first study the determinants of
31
choosing the tournament payment scheme using a Probit model. We then explain the number of words created, conditional on that decision, with an OLS model corrected for the selection bias.17
The hypotheses tested are that people who feel more able than the age category of their co-participants are more willing to compete. A person who has experienced the greater cooperation of seniors in the team-production game may be expecting a lower tournament entry rate for seniors, making his or her own entry more likely. The latter variables are not included in the performance specification, in order to ease the identification of the model and because they are assumed to exert no influence on performance (we checked for this assumption). In the second specification, we control for the existence of competition involving both pair members, since this is expected to generate an incentive to work harder. We also control for the series of letters we used. Finally, we include the inverse of the Mill’s ratio (the "IMR" variable) in this equation in order to correct for a likely selection bias arising from the first-stage decision.
Table 11 displays the results from these regressions.
17
In both regressions, the individual characteristics variables include generation, gender, whether the participant is working or not (and if so, whether he or she is a manager), and belief about own ability; the working juniors are the omitted category. In addition, we include a variable indicating whether the participant is paired with a senior in this game, since stereotypes regarding the lower competitiveness of seniors may have a positive influence on the decision to compete and a negative influence on one’s performance. In the selection equation, we also control for the individual’s risk attitude (measured by the amount invested in the risky asset), and for whether the individual has interacted with seniors in the information treatment of the team-production game (the “experience with seniors” variable). We also include a dummy variable regarding beliefs about relative ability, indicating whether the individual believes he or she is more able than the generation of his or her co-participant.
32
Table 11: Determinants of behavior in the competition game (Heckman two-step estimation procedure)
Exogenous variables Tournament entry Probit model (1) Performance OLS model (2) Student Working junior Working senior Retiree Gender (male=1) Risk attitude
Belief on own ability
Belief on relative ability
Manager
Senior opponent
Experience with seniors (Yes=1) 2-person tournament Set of letters Constant IMR -0.378 (0.400) Ref. -0.915** (0.446) -1.546*** (0.462) -0.149 (0.270) 0.011** (0.005) 0.054 (0.037) 1.707*** (0.421) 0.866* (0.504) 0.750** (0.300) 1.352*** (0.348) - - -1.311*** (0.512) - 2.432** (1.073) Ref. 0.136 (1.145) 0.836 (1.227) -0.001 (0.791) - 0.301*** (0.058) - 1.842 (1.224) 0.846 (0.801) - 1.991*** (0.775) -0.272 (0.781) 4.070*** (1.299) 1.827* (1.126) Nb observations Wald chi2 Prob>chi2 129 69.37 0.000
Standard deviations are in parentheses. *** significant at the 0.01 level; ** at the 0.05 level; * at the 0.1 level.
The first regression in Table 11 indicates that both working seniors and retirees are less likely to choose the tournament than working juniors. In contrast, there is no significant difference between students and working juniors. Not surprisingly, the probability of choosing the tournament is positively influenced by the risk attitude of the participants. Managers are also more willing to compete, perhaps because they are more used to doing so in their occupation
33
Logically, people are more influenced by their relative situation than by their belief about their own ability. Indeed, believing one is better than an average potential competitor increases the probability one chooses the tournament. Interestingly, this decision is influenced by the generation of the opponent: controlling for the other variables (including beliefs about relative ability), being matched with a senior in this game and in the team-production game increases the probability of choosing the tournament. One interpretation is that people expect the seniors to be more cooperative and thus less likely to enter the competition. Since if the co-participant chooses the piece-rate pay scheme, opting for the tournament automatically returns the high payment, such a belief about seniors may increase the probability of choosing the tournament.
The second regression in Table 11 indicates that the level of performance is similar across generations, except for the fact that the students outperform the working juniors. The latter observation can be explained by the great homogeneity of the student pool in terms of education. More generally, the self-confident participants do perform better than those who are less confident. Not surprisingly, the reality of the competition – and the associated risk of getting a low payment – makes people working harder than when the co-participant has chosen the pay scheme based on absolute performance, in which case the high payment is certain. The IMR variable is marginally significant, indicating that it is better to control for the selection bias. There is no significant impact from the other variables, such as gender, occupational category, or the nature of the task. These two regressions support our last main finding:
Result 7: While seniors are less attracted by competition than juniors, there is not much difference in word production among the various subpopulations when in an actual competition.
This result is important in that it shows that seniors react to competitive incentives as strongly as juniors.