HAL Id: tel-03214567
https://tel.archives-ouvertes.fr/tel-03214567
Submitted on 2 May 2021HAL is a multi-disciplinary open access archive for the deposit and dissemination of sci-entific research documents, whether they are pub-lished or not. The documents may come from teaching and research institutions in France or abroad, or from public or private research centers.
L’archive ouverte pluridisciplinaire HAL, est destinée au dépôt et à la diffusion de documents scientifiques de niveau recherche, publiés ou non, émanant des établissements d’enseignement et de recherche français ou étrangers, des laboratoires publics ou privés.
Tree diversity effects on root production, decomposition
and nutrient cycling under global change.
Andreas Altinalmazis Kondylis
To cite this version:
Andreas Altinalmazis Kondylis. Tree diversity effects on root production, decomposition and nu-trient cycling under global change.. Ecosystems. Université de Bordeaux, 2021. English. �NNT : 2021BORD0067�. �tel-03214567�
i THÈSE PRÉSENTÉE
POUR OBTENIR LE GRADE DE
DOCTEUR DE
L’UNIVERSITÉ DE BORDEAUX
ÉCOLE DOCTORALE SCIENCES ET ENVIRONNEMENTSSpécialité : Biogéochimie et écosystèmes
Par Andreas Altinalmazis – Kondylis
La biodiversité dans les écosystèmes forestiers est-elle susceptible de modifier les processus de production de racines et de décomposition des
litières dans un contexte de changement climatique ?
Tree diversity effects on root production, decomposition and nutrient cycling under global change
Sous la direction de : Mark R. Bakker Co-directeur de thèse: Stephan Hättenschwiler
Soutenue le 11 Mars 2021
Membres du jury :
Mme. Ivika OSTONEN Professeur, University of Tartu (Estonia) Rapporteur
Mme. Catherine ROUMET Chargée de recherche (HDR), CNRS Montpellier Rapporteur
M. Richard MICHALET Professeur, Université de Bordeaux Président
M. Antonino DI IORIO Associate Professor, University of Insubria (Italy) Examinateur
M. Ivano BRUNNER Chargé de recherche, WSL (Switzerland) Examinateur
M. Stephan HATTENSCHWILER Directeur de recherche, CNRS Montpellier Co-Directeur
iii
Tree diversity effects on root
production, decomposition and
nutrient cycling under global
change
Andreas Altinalmazis – Kondylis
2021
v
Résumé
L'hypothèse de l'assurance prévoit que les forêts composées de mélanges d'espèces d'arbres pourraient mieux résister aux conditions environnementales stressantes que les forêts composées d'une seule espèce d'arbre. La majorité des travaux antérieurs ont testé cette hypothèse en se focalisant sur la productivité et les variables de réponse associées sans prendre en compte les processus souterrains. L’objectif principal de ma thèse était d’étudier l’effet de la diversité des espèces d’arbres sur les processus souterrains impliqués dans la décomposition des racines à travers des gradients climatiques. J'ai émis l'hypothèse que le mélange d'espèces ayant des systèmes racinaires contrastés entraînerait une faible compétition souterraine, et se traduirait par la production de plus biomasse de racines fines. En outre, j'ai émis l'hypothèse que les racines ayant des caractéristiques chimiques et morphologiques contrastées dans les peuplements mixtes se décomposent plus rapidement. Dans des conditions de stress hydrique, j'ai émis l'hypothèse d'une décomposition plus lente mais d’une atténuation des mélanges d'arbres sur la décomposition en raison de l'amélioration des conditions micro-environnementales. Pour tester ces hypothèses, j'ai examiné la variation des caractéristiques fonctionnelles des racines et leurs conséquences sur les flux de C, N et P à l'échelle de l'écosystème à travers l’étude de : 1) la ségrégation verticale des racines et la biomasse des racines fines, 2) la dynamique des racines fines et les flux de nutriments associés et 3) la décomposition des racines fines et des feuilles mortes. Dans ce cadre, deux expériences de terrain ont été réalisé, l'une avec une expérience de plantation d'arbres de 10 ans avec du bouleau et du pin près de Bordeaux (expérience ORPHEE), la seconde le long d'un gradient latitudinal de forêts de hêtres matures dans les Alpes françaises (expérience BIOPROFOR).
Les résultats obtenus montrent que les racines de bouleaux et de pins présentaient une distribution verticale similaire et une biomasse souterraine similaire de racines dans les mélanges d'arbres par rapport aux monocultures, contrairement à ma première hypothèse. Cependant, l'attribution plus importante du pin mais pas du bouleau à la croissance des racines dans les horizons du sol supérieur dans des conditions moins limitatives en eau suggère des conditions localement favorables qui peuvent conduire à une compétition asymétrique à la profondeur du sol. De plus, la production et la décomposition des racines fines étaient similaires dans les mélanges et dans les monocultures, en contradiction avec ma deuxième hypothèse. Il est intéressant de noter que les racines de bouleau, mais pas les racines de pin, ont libéré du P pendant leur décomposition, ce qui suggère un rôle important du bouleau dans le cycle du P et pour la nutrition en P des arbres sur ces sols sableux limités en P. Conformément à ma troisième hypothèse, j'ai observé une décomposition plus lente de la litière de feuilles et des racines fines en réponse à une sécheresse estivale prolongée, tout au long du gradient latitudinal dans les Alpes. Cependant, cette décomposition plus lente sous la sécheresse n'a pas été atténuée dans les peuplements forestiers à essences mixtes par rapport aux peuplements à essences uniques. Il est intéressant de noter qu’il y a une libération nette d'azote dans les racines fines en décomposition mais pas dans la litière de feuilles en décomposition, ce qui suggère un rôle distinct des racines fines dans le cycle de l'azote. En conclusion, j'ai constaté que le mélange des espèces d'arbres n'atténue pas les effets négatifs du changement climatique. Cette thèse démontre que la promotion de mélanges peut toujours être bénéfique pour au moins une des espèces d'arbres mélangées, par l'ajout d'espèces, car une espèce d'arbre peut en faciliter la nutrition minérale d’une autre par des flux souterrains de N et de P.
Mots clés : biodiversité, écosystèmes forestiers, changement climatique, qualité de la litière, production de racines fines, cycle des nutriments
vii
Abstract
The insurance hypothesis predicts that forests with tree species mixtures may resist better to stressful environmental conditions than forests composed of only one tree species. Most of the currently available literature tested this hypothesis for aboveground productivity and its related response variables, but less is known about belowground processes. In my PhD thesis, I studied the drivers of belowground productivity and decomposition across climatic gradients and how they are affected by tree mixtures. I hypothesized that mixing of tree species with contrasting rooting patterns and fine root morphologies, would result in a release of competitive pressure belowground, and translate into higher fine root standing biomass and increased fine root productivity. Moreover, I hypothesized that roots with contrasting chemical and morphological characteristics in mixed stands would decompose faster, which may be particularly important under nutrient-limited conditions. Under water-limiting conditions, such as during extreme summer drought, I hypothesized overall slower decomposition but an attenuating effect of tree mixtures on decomposition due to improved micro-environmental conditions, in particular for leaves, since roots decompose in a more buffered soil environment. To test these hypotheses I examined the variation in tree root functional traits (across- and within-species), and its consequences for fluxes of C, N and P at the ecosystem scale. I addressed three main objectives and associated research questions to quantify the interactive effect of tree mixtures and climate on: 1) vertical root segregation and fine root standing biomass, 2) fine root dynamics and their associated nutrient fluxes and 3) fine root- and leaf litter decomposition. I could benefit from two different field experiments for my work, one with a 10-year-old tree-plantation experiment with birch and pine close to Bordeaux (ORPHEE experiment), the second along a latitudinal gradient of mature beech forests in the French Alps (BIOPROFOR experiment).
I observed that roots from the birch and pine tree-plantation showed similar vertical distribution and similar belowground root standing biomass in tree mixtures compared to monocultures, contrary to my first hypothesis. However, the greater allocation of pine but not of birch to root growth within the top soil horizons under less water-limiting conditions suggests locally favourable conditions that may lead to soil depth-specific asymmetric competition. In the same experiment, fine root production and decomposition were similar in mixtures and in monocultures, in contradiction with my second hypothesis. Moreover, I did not observe any interactive effects of tree mixtures with stand density or water availability. Interestingly though, birch roots, but not pine roots released P during root decomposition, which suggests an important role of birch in the P-cycle and for P nutrition of trees on these P-limited sandy soils. In line with my third hypothesis, I observed a slower decomposition of leaf litter and fine roots in response to reinforced and prolonged summer drought, irrespective of the position along the latitudinal gradient in the Alps. However, this slower decomposition under drought was not attenuated in forest stands with mixed tree species compared to single species stands. Compared to leaf litter, fine roots decomposed slower and released less C. Interestingly, I found a net N release in decomposing fine roots but not in decomposing leaf litter, which suggests a distinct role of fine roots in the N cycle. In conclusion, I found that mixing tree species did not attenuate negative effects of climate change. However, this thesis demonstrates that promoting mixtures can still be beneficial for at least one of the admixed tree species, through species addition (i.e., complementing one tree species with another tree species), as one tree species may facilitate another via belowground fluxes of N and P. Keywords: biodiversity, forest ecosystems, climate change, litter quality, fine root production, nutrient cycling
ix
Remerciements / Acknowledgments
This thesis is the product of many people, and it would never have come to fruition without them. I truly believe that relationships we build are sacred and should be cherished, and I want to dedicate this long acknowledgments section to all of you that were in my PhD life the last years.
It was not too long ago that I was in my MSc thesis, counting mycorrhizae through a microscope. A tedious process, which took me a couple of months to master. Also a
brutal repeated sequence of four actions: counting, scanning, drying,
weighing…..counting, scanning, drying, weighing. My friends would ask me “Andreas why are you still in the lab looking at these roots, and what the hell are you doing with your life?”. Actually, I knew exactly why I was looking at roots all day, but it is true that I did not really know what I was doing with my life, or what the future had in store for me. It was during that time that I first reflected on doing a PhD. Little did I know that I would spend that much and even more time, working with roots, thinking about roots, writing about roots. A few months later, I contacted Mark, and Stephan, we did a skype, and soon after, it all started!
First of all I give a big thank you to my wife Adriana who has been by my side through our adventures in The Netherlands, and at the moment in France, spending her Sundays cleaning roots with me in the living room, and even made few of the litterbags (large mesh !). You nourish my soul and give me balance, you hold me when I need to be held and I love you. Thank you to my family: my father Lefteris, my mother Gina, my sister Elena, who believed in me, and who supported me in my studies abroad. They taught me by example, to work hard and to never ever quit. Thank you to my extended Mexican family: Rafael, Patricia, Galilea, Rafa, Perlita, Chofies, Buki, and Felix. You have treated me like a son, and accepted me in your life. Thank you to my Greek extended family: Alexandros, his father Nikos, and his mother Maria. Although I have been away, it is so great to see our families unite and grow together.
Thank you to my international friends from the Netherlands: Lalo, Kodji, Mai, Nyandula, Shaibu, Daniel. Thank you for all the skype chats, and for being a real community of people that I can always rely on. Thank you to Gerlinde de Deyn and Janna Barel, for taking me into their project during my Msc thesis, and for (unintentionally) inspiring me to pursue a PhD. It is with your team that I discovered my fascination for science. Thank you to my French colocs, Arturo, Bastien, Joan, you made confinement so easy! I will always remember our BBQs à la plancha, the miniature garden, the movie nights, the raclettes, the tartiflettes, greek food, Spanish food, Peruvian food (ceviche !!!). Thank you to the franco-latino couples of Bordeaux!! Simon and Katie, Simon and Raquel, Arnaud and Krystal, Angel and Vicky. Que gente hermosa !!
I am grateful to our small but very productive team of the DiPTiCC project. Thank you Nicolas for motivating me to keep pushing, and for inspiring me. Laurent you have been a quiet force of stability all this time, although you have four kids at home, it feels like your father instinct crosses over at work as well. Thank you Hervé, Bastien,
x Damien, Céline, Xavier, Maude, Soline for being such great collaborators. Even though I was lost in translation many times (you speak so fast French people!), I always felt at ease, and I learned a lot from you. Thank you Cathy for always being so eager to help, for being so patient with me, and for letting me use your lab to chop my roots! I give a very warm thank you to Sylvie Milin, for being a guardian angel in the lab. You are not only an excellent professional but a wonderful person.
Thank you to all the BIONUTs, previous and new ones! Arthur, David, Manon, Mohamed, Fred, Marko, Lucie, Pablo, Nicolas. My Mexican-marriage best men, Pietro and Ulysse, for creating the best office atmosphere, for teaching me R, for introducing me to climbing, for teaching me French. If I suck at all three, it is your fault!!! Very special thanks to my French-marriage best lady Tania (Yes, I married the same person twice in two different countries, one marriage was not a statistically robust design). Tania, I will terribly miss our conversations, our laughs and your never-ending optimism and ambition. Also, thank you to Lukas for keeping Tania sane, so that she could keep me sane...hahah. Finally yet importantly, I want to thank Kathina, Constance, Alison, and Meriam. You are the undoubtful carriers of this Thesis! You are all very talented and I hope to see you again in future root (or not) projects.
A very important thank you is addressed to my two supervisors. Stephan, although we could not spend more time together, you always did your best to help me. Even if that meant having a skype meeting on your son’s birthday or travelling to Bordeaux from Montpellier for a one-day meeting! Thank you for being kind and patient with me, and for being a tutor when I needed you the most. Your kind emails always brightened my mood and gave a smile to my face. Mark, we have certainly been through a lot together. Thank you for the bike, the beers, the silly jokes, thank you for always being present, thank you for all the lab work we did together, and so much more. In reality, I cannot thank you enough and I cannot owe you enough beers (I guess the number is over three digits by now). I will remember our working together very dearly. You are both excellent men and scientists, I will always be grateful for giving me the opportunity to work on such an ambitious project, and to have rubbed shoulders with such charismatic people.
xii Contents
Résumé ... v
Abstract ...vii
Remerciements / Acknowledgments ...ix
List of Tables ... xvi
List of Figures ... xxi
Chapter 1 | Introduction ... 1
1.1 Changes in climate and biodiversity ... 1
1.2 Importance of roots for nutrient cycling ... 2
1.3 General aspects of biodiversity belowground ... 4
1.4 Fine root dynamics ... 5
1.4.1 Environmental effects on fine root dynamics ... 6
1.4.2 Biodiversity effects and resource availability ... 6
1.5 Decomposition ... 7
1.5.1 Climate and trait control on the decomposition of leaves and roots ... 8
1.5.2 Direct and indirect effects of tree diversity on decomposition ... 9
1.6 Rationale and research questions ...10
References ...13
Chapter 2 | Materials and Methods ...26
2.1 Study design ...26
2.2 Site description ...26
2.3 Methods ...29
2.3.1 Tree species studied and tree inventory ...29
2.3.2 Belowground productivity and turnover ...29
2.3.3 Vertical root profiles ...30
2.3.4 Decomposition ...30
2.3.5 Soil analyses ...33
2.4 Data treatment ...34
2.5 Organization of the Result chapters ...35
References ...36
Chapter 3 | Effect of tree mixtures and water availability on belowground complementarity of fine roots of birch and pine planted on sandy podzol...38
3.1 Introduction ...39
3.2 Materials and Methods ...41
3.2.1 Study site ...41
3.2.2 Field sampling ...42
xiii
3.2.4 Data collection and computation of root morphology variables ...44
3.2.5 Calculation of vertical root distribution index ...45
3.2.6 Calculation of diversity metrics ...45
3.2.7 Data analysis ...46
3.3 Results ...46
3.3.1 Overall treatment effects on fine root biomass and morphology ...46
...47
3.3.2 Vertical root patterns ...48
3.3.3 Relative fine root attributes ...51
3.4 Discussion ...53
3.4.1 General considerations ...53
3.4.2 Effect of mixing tree species on vertical root segregation and belowground overyielding ...55
3.4.3 Pronounced vertical root segregation and belowground overyielding under ambient water supply ...56
3.4.4 Depth-specific effects on relative yield ...56
3.5 Conclusion ...59
Acknowledgements ...59
References ...60
Chapter 4 | Fine root dynamics in response to tree species mixing, stand density, and water availability ...68
Abstract ...68
4.1 Introduction ...69
4.2 Materials and Methods ...72
4.2.1 Study site and experimental design ...72
4.2.2 Fine root production and turnover ...74
4.2.3 Fine root decomposition ...76
4.2.4 Chemical analysis of roots ...77
4.2.5 Root litter input and C, N, P fluxes in the soil ...78
4.2.6 Data analysis ...79
4.3 Results ...79
4.3.1 Differences in fine root morphology and chemistry between species, and between ingrowth cores and root standing biomass cores ...79
4.3.2 Fine root production and turnover ...82
4.3.3 Fine root decomposition ...84
4.4 Discussion ...86
4.4.1 General considerations ...86
4.4.2 Effect of tree species mixing ...87
4.4.3 Effect of stand density ...88
4.4.4 Effect of irrigation ...89
4.4.5 Implications for carbon and nutrient cycling ...90
4.5 Conclusion ...91
Acknowledgements ...91
xiv Chapter 5 | Prolonged summer drought decreases C release but does not change N
release during fine root and leaf litter decomposition in beech forests ... 101
Abstract ... 101
5.1 Introduction ... 102
5.2 Materials and Methods ... 104
5.2.1 Study sites ... 104
5.2.2 Rain exclusion treatment ... 106
5.2.3 Litterbag construction ... 106
5.2.4 Chemical analysis of plant material ... 107
5.2.5 Carbon and nitrogen loss ... 107
5.2.6 Experimental design and statistical analyses ... 108
5.3 Results ... 109
5.3.1 Reinforced and prolonged summer drought ... 109
5.3.2 Initial fine root and leaf litter chemistry ... 109
5.3.3 Fine root- and leaf litter decomposition in response to reinforced and prolonged drought ... 111
5.3.4 Fauna contribution to leaf litter decomposition ... 114
5.4 Discussion ... 115
5.4.1 Drought effects on decomposition ... 115
5.4.2 Severe summer drought and tree species mixtures ... 117
5.4.3 Comparison between root and leaf decomposition ... 118
5.4.4 Fauna contribution to leaf litter decomposition ... 119
5.5 Conclusion ... 119
Acknowledgements ... 119
References ... 120
Chapter 6 | Discussion ... 125
6.1 Root adaptations to water availability and the role of interspecific interactions... 125
6.1.1 Vertical root distribution ... 126
6.1.2 Fine root growth in mixed stands ... 127
6.1.3 Fine root morphology ... 128
6.1.4 Fine root mortality and mycorrhizal associations as adaptations to changing conditions ... 129
6.2 Belowground carbon and nutrient cycling ... 130
6.2.1 Tree mixture effects on belowground nutrient cycling... 132
6.3 Root versus leaf litter decomposition ... 134
6.3.1 Comparison between roots and leaves ... 134
6.3.2 The contribution of macrofauna to decomposition ... 135
6.4 Concluding remarks & recommendations ... 136
References ... 138
Appendix A | Materials and Methods ... 146
Appendix B | Effect of tree mixtures and water availability on belowground complementarity of fine roots of birch and pine planted on sandy podzol... 152
xv Appendix C | Fine root dynamics in response to tree species mixing, stand density, and water availability ... 164 Appendix D | Prolonged summer drought decreases C release but does not change N release during fine root and leaf litter decomposition in beech forests ... 170 Appendix E | Preliminary results ... 174
xvi
List of Tables
Table 2.1 English name, species, families and plant clades used in the study, per experimental site, and their abbreviations. ...29
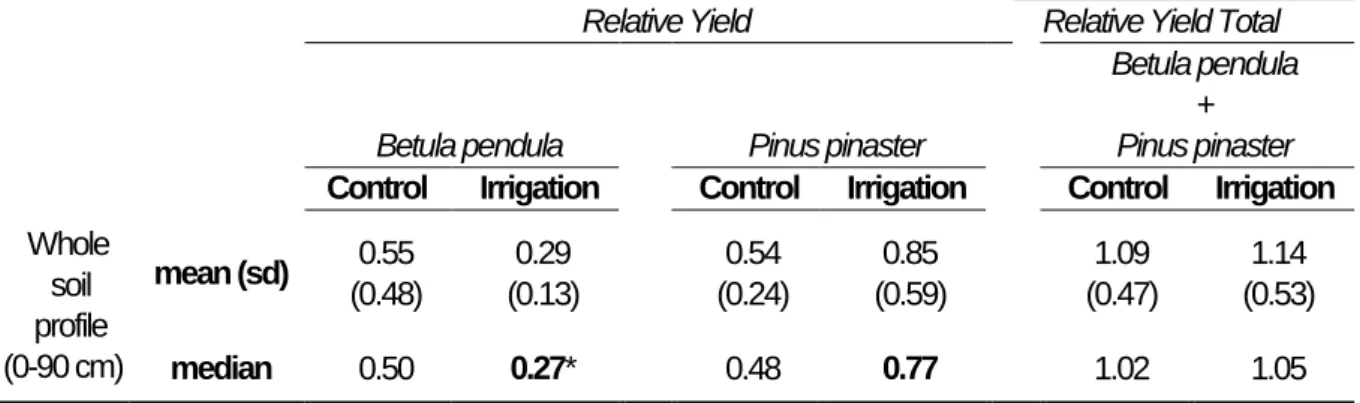
Table 3.1 Overview table of stand characteristics at 10 years-old. Values are means (± standard deviations) of 36 centre trees per plot (alive and measurable trees at breast height 130 cm) repeated across 8 blocks (4 blocks are irrigated and 4 blocks are not). 43 Table 3. 2 Overview of the summed values of fine root biomass (FRB; g m-2), adjusted fine root biomass (FRBadj.; g m-2 m-2 BA), understory fine root biomass (g m-2), fine root length (FRL; m m-2), fine root surface area (FRA; m2 m2) and root tip abundance (FRT; 103 tips m-2) for the whole soil profile (0–90 cm) for Betula pendula, Pinus pinaster in pure and mixed plots, in control and irrigated blocks. The tables also includes fine root morphology for the upper 15 cm of soil: specific root length (SRL15; m g-1), and specific root area (SRA15; cm2 g-1). Different lowercase letters indicate significant differences between the eight combinations of stand composition and water treatment. ...47 Table 3.3 Means and medians of the relative mixed stand values (± standard deviations) of fine root biomass for the whole soil profile. Mean values of RY > 0.5 (per species), or when RYT > 1 (for the whole community) indicate positive mixture effects. Bold values indicate significant deviation (p < 0.05) from 0.5 (per species) or 1 (for the whole community). Asterisks * indicate significant effect of irrigation at species or community level (p < 0.05). ...51
Table 4.1 Overview of fine root morphology between fine roots of birch and pine, originating from root standing biomass (RSB) and 2nd year ingrowth cores harvests (IC2). The morphological traits are: specific root length (SRL; m g–1), specific root area (SRA; cm2 g -1), root tissue density (RTD; g cm-3), and root diameter (D; mm). We also present an estimation of initial root litter morphology based on the fine root standing biomass collected in March 2018 from birch (n = 64 replicates) and pine trees (n = 61 replicates) that were left unirrigated. Values are means with standard deviation in parenthesis. Different upper case letters indicate differences for a root cohort between both species for a given root metric, while different lower case letters indicate differences within a species between root cohorts for a given root metric. ...80 Table 4.2 Overview of fine root quality between fine roots of birch and pine, originating from root standing biomass (RSB), 2nd year ingrowth cores harvests (IC2), from initial litter of fine roots collected from birch and pine trees at three km from the study site, and for root litterbags. All available replicates of each species were used for RSB, IC2 and root litterbag analysis of C, N, P. For initial litter quality three replicates (n = 3) were used for the elemental analysis, and one replicate (n = 1) was used for lignin measurements. Values are means with standard deviation in parenthesis. Different upper case letters indicate differences for a root cohort between both species for a given chemical variable, while different lower case letters indicate differences within a species between root cohorts for a given chemical variable. ...81
Table 5.1 Overview of site characteristics, and soil characteristics. Average precipitation and temperature is averaged between years (2018 – 2019) and collected from the closest available meteorological stations. Soil data are averages of two tree species mixture plots (i.e. two plots at each site) and were collected, using automated sensors (RT-1 and EC-5 or GS-1 sensors for temperature and moisture (TDR sensors), respectively, Decagon
xvii Devices Inc., Pullman, WA, USA) storing average values every three hours for the whole duration of the experiment. ... 105 Table 5.2 Results of the PERMANOVA test, using Euclidean distances, to test for the dissimilarity between groups of litter type (leaves vs roots), between sites (Vercors, Mont Ventoux, Lubéron, Ste Baume), and their interaction. Significant results are in bold font (p < 0.05). ... 109 Table 5.3 Overview of initial litter quality of a) fine root-, and b) leaf litter. Means and standard deviation (in parentheses) of three replicates of: Carbon, Nitrogen, Phosphorus, Calcium, Potassium, Magnesium, Manganese, across the four sites (Vercors, Mont Ventoux, Lubéron Ste Baume). Significant differences are annotated with small letters (p < 0.05). ... 110 Table 5.4 Results of the linear mixed effects models to test for the effects of site, mixture, rainfall exclusion and their interactions on remaining carbon (C), and remaining nitrogen (N), after two years of decomposition, for: a) root litterbags, b) leaf litterbags with a fine mesh. Significant results are in bold font (p < 0.05). ... 113 Table 5.5 Results of the linear mixed effects models to test for the effects of site, rainfall exclusion, litterbag type and their interactions on remaining carbon (C), and remaining nitrogen (N), after two years of decomposition. The litterbag comparison is between fine root litterbags and leaf litterbags with a fine mesh. Significant results are in bold font (p < 0.05). ... 113 Table 5.6 Results of the linear mixed effects models to test for the effects of site, rainfall exclusion, litterbag type and their interactions on remaining carbon (C), and remaining nitrogen (N), after two years of decomposition. The litterbag comparison is between leaf litterbags with a fine mesh, and leaf litterbags with a coarse mesh. Significant results are in bold font (p < 0.05). ... 115
Table A2.1 Overview of the ingrowth core and hyphal bag installation per plot. Each plot code is replicated for eight blocks, for a total of 56 plots. A total of eight ingrowth cores and their hyphal bags are installed per plot, and divided among 4 subplots. ... 146 Table A2.2 Overview of the of the ingrowth core and hyphal bag installation installation in the Alps, per site. Each site comprises of two altitudes (low and high elevation). Each altitude has a triplet of plots, and each plot comprises of 4 subplots (two with rain exclusion and two without). ... 147 Table A2.3 Overview of the vertical root profiles per plot. Each plot code is replicated for eight blocks, for a total of 32 plots. A total of four soil columns were harvested per plot, and further divided to six layers. ... 147 Table A2.4 Overview of the litterbag installation in the experimental site of ORPHEE, and divided for two litterbag types: a) root litterbags (mesh of 48µm Ø), b) leaf litterbags (mesh of 48µm Ø). Each plot code represents a different tree species composition, which can be monospecific or a mixture, and is replicated for 8 blocks, for a total of 56 plots. Standardized litter, which corresponds to the tree species composition of each plot, was placed in pairs of three litterbags. ... 148 Table A2.5 Overview of the litterbag installation in the Alpes, per site, and divided for three litterbag types: a) root litterbags (mesh of 48µm Ø), b) leaf litterbags (mesh of 48µm Ø), c) leaf litterbags (mesh of 2mm Ø). Each site comprises of two altitudes (low and high elevation). Each altitude has a triplet of plots, and each plot comprises of 4 subplots (two with rain exclusion and two without). Site-specific litter, which corresponds to the tree species composition of each plot, is placed in pairs of three litterbags. ... 149
xviii Table B3.1 Overview table of understory species with means of soil cover (%) and std. deviations (in parentheses), under monocultures of Betula pendula, Pinus pinaster, and their mixture. Presence is the percentage of aboveground occurrence for each understory species. ... 158 Table B3.2 Soil moisture (%) along the soil profile in the three different species composition treatments (pure Betula pendula, pure Pinus pinaster, mixed Betula pendula + Pinus pinaster), each in both control and irrigated blocks. Soil was collected in March 2018 along with the roots. Data are means ± standard deviation. ... 159 Table B3.3 Results of the linear mixed effects models to test for the effects of species, mixture, irrigation, depth and their interactions on Fine root mass density (FRMD), Specific root length (SRL), Specific root area (SRA) and Specific root tip density (SRTD). Significant results are in bold font. ... 160 Table B3.4 Results of the linear mixed effects models to test for the effects of mixture, irrigation, depth and their interactions on Fine root mass density (FRMD), Specific root length (SRL), Specific root area (SRA) and Specific root tip density (SRTD). The upper part shows results for Betula pendula, and the lower part for Pinus pinaster. Significant results are in bold font. ... 161 Table B3.5 Means of root distribution values, with std. deviations (in parentheses) calculated for g m-2 soil surface. The parameters d30 and d60 are fine root cumulative proportions to depths of 30 and 60 cm respectively. The d50 parameter is the depth at which we find 50% of roots, and was estimated with the beta values. ... 162 Table B3.6 Overview of fine root biomass (FRB; g m-2) per soil layer, and summed for the whole profile (0-90 cm) that is found in pure and mixed plots of birch and pine, under control and irrigated conditions. Different lowercase letters indicate significant differences between the six combinations of stand composition and water treatment, across each soil layer. ... 163
Table C4.1 Overview table of stand characteristics at 10 years-old. Measurements were performed in the summer of 2018; therefore in the middle of the two year observation period for roots. Values are means (± standard deviations) of 36 centre trees per plot (alive and measurable trees at breast height 130 cm) repeated across 8 blocks (4 blocks are irrigated and 4 blocks are not). ... 165 Table C4.2 Relative canopy ratios when trees are growing in mixture, and the % of missing trees per measurement (dead trees and trees with a trunk diameter of less than 1.3 cm were excluded). The canopy extension (in m2) of each tree was computed by using the four largest branches and assuming a vertical projection on the forest floor. The canopy ratio was then defined as the canopy extension divided by 4 m2 (the theoretical space of each tree in the design). Values higher than 1 mean that the tree occupies more than this space (canopy closure). ... 166 Table C4.3 Overview table of understory species with means of soil cover (%) and std. deviations (in parentheses), under monocultures of birch, pine, and their mixture (birch + pine). Presence is the percentage of aboveground occurrence for each understory species. ... 167 Table C4.4 Results of the linear mixed effects models to test for the effects of tree species composition, stand density, irrigation, and their interactions on Fine root production (FRP), Fine root necromass (FRN), Fine root turnover (FRT) and Fine root decomposition (FRD). Significant results are in bold font (p < 0.05). ... 168 Table C4.5 Results of the linear mixed effects models to test for the effects of tree species composition, stand density, irrigation, and their interactions on cumulative release (after
xix a 2-year decomposition period) of carbon (C), nitrogen (N), and phosphorus (P). Significant results are in bold font (p < 0.05). ... 168 Table C4.6 Annual fine root litter input to soil (fine root necromass) and cumulative N and Carbon release (after 2 years of fine root decomposition) between different tree species composition of birch and pine, planted at high and low stand density. Half of the stands are left unirrigated (Crtl) and half are irrigated during the summer (Irr). Values are means with stand deviation in parentheses. ... 169
Table D5.1 Overview of stand basal area of the tree species present in the pure and mixed tree stands, across the four sites (Vercors, Mont Ventoux, Lubéron, Ste Baume). ... 173
xxi
List of Figures
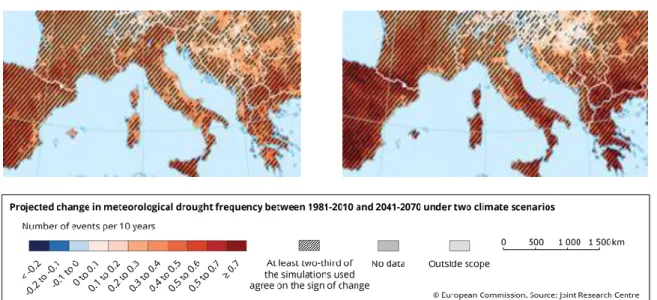
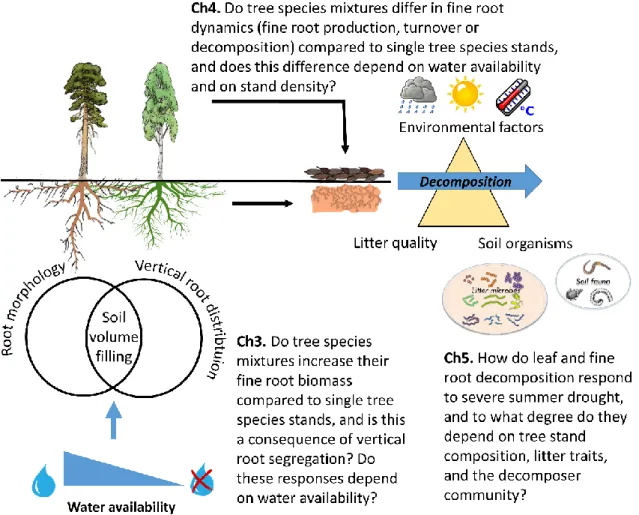
Fig. 1.1 Projected change in meteorological drought frequency between the present (1981-2010) and the mid-century 21st century (2041-2070) in Europe, under two emissions scenarios; RCP 4.5 (moderate), RCP 8.5 (severe). Data source: Projections of future meteorological droughts in Europe provided by Joint Research Centre (JRC) ... 2 Fig. 1.2 Simplified scheme of pools and fluxes. ... 6 Fig. 1.3 Schematic overview of research questions addressed in the indicated chapters of my thesis. ...11
Fig. 2.1 Schematic representation of the ORPHEE experimental design. Image is taken from
the official ORPHEE online site
‘https://sites.google.com/view/orpheeexperiment/experimental-design’. ...27 Fig. 2.2 (a) Study area and location of the six sites in southeastern France. Northern points (sites S1, S2, S3) represent sites with European beech (Fagus sylvatica) and silver fir (Abies alba) forests. Southern points (sites S4, S5, S6) represent southern sites with European beech and pubescent oak (Quercus pubescens) forests. The sites are located in the following mountain ranges of the French pre-Alps: Bauges (S1), Vercors (S2), Mont Ventoux (S3), Lubéron Lagarde (S4), Grand Lubéron (S5), Sainte-Baume (S6) (b) Schematic representation of a site with two triplets per site. Each triplet is made up of two pure plots and one mixed plot. (c) Representation of an individual plot. Plots are circular with a central plot area (10 m radius) and a buffer zone (7.5 m radius). ...28 Fig. 2.3 Schematic representation of: (a) a plot in ORPHEE, (b) a plot in the Alps, (c) the ingrowth cores (represented by a red triangle) and hyphal bags, and (d) root litterbags installed on the side (brown font) and leaf litterbags (green font) installed in the middle, and under metal grids. ...32
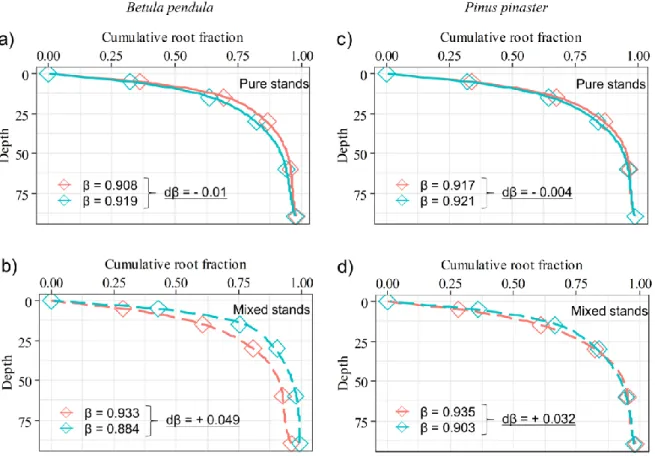
Fig. 3.1 Depth distributions for root traits of Betula pendula and Pinus pinaster for all four Irrigation × Mixture combinations (Pure – C; Mixed – C; Pure – IRR; Mixed – IRR). Presented data are mean values with st. errors for: (a,e) fine root mass density (FRMD; g m-3), (b, f) specific root length (SRL; m g–1), (c, g) specific root area (SRA; cm2 g-1), and (d, h) branching intensity (SRTD; 1000 x tips g-1). Effects of irrigation (IRR), mixture (MIX) and their interaction are indicated at the lower right side of each graph. Significant differences per soil depth, between combinations of Irrigation and Mixture are indicated with lower case letters. Absence of letters means that there are no significant differences. ...49 Fig. 3.2 Cumulative fine root fraction with soil depth and the coefficients of the rooting distribution (β) for: a) Betula pendula in pure stands b) Betula pendula in mixed stands, c) Pinus pinaster in pure stands, d) Pinus pinaster in mixed stands, under irrigation and control treatment. The β values are based on fine root biomass (g m-2); the higher the β value (the closer to 1), the deeper is the vertical distribution of fine roots. Absence of letters means that there are no significant differences. ...50 Fig. 3.3 Boxplots with medians (-), and means (◊) of the relative mixed stand values of fine root biomass (g m-2). RY > 0.5 indicates positive mixture effects for a given species: a) Betula pendula, b) Pinus pinaster, c) and RYT > 1 indicates positive mixture effects for the whole community. Significant relative yield effects (overyielding or underyielding) are noted using # (p < 0.05), ## (p < 0.01) and ### (p < 0.001). Asterisks * indicate significant differences (p < 0.05) between irrigated and non-irrigated plots, per depth. ...52 Fig. 3.4 Depictions of the simplified shallow vs deep paradigm for species 1 (in red colour) and species 2 (in green colour) growing in mixtures, and the proposed depth-specific
xxii paradigm for young mixed forests. On the left is the response in fine root investment of Species 1 and Species 2 growing together in mixture, in the middle is their calculated vertical fine root distributions (β values), on the right is the yield effect for the whole soil column (pure versus mix). The shallow vs deep paradigm is based on the assumption that in case of vertical root segregation, there will be a higher root occupation of the soil profile, which results in belowground overyielding in tree mixtures. In scenario A, vertical root segregation could occur if more roots of one species grow in either the top soil layers or the deeper soil layers (respectively curves on the left, curves on the right) relative to its distribution in a pure stand, leading to an overyielding for the whole soil column. However, vertical root segregation can also be obtained if one species would grow less roots in top or deeper soil layers relative to the pure stand, though in that case this implies an underyielding at the whole soil profile level (scenario B). Alternatively, other factors such as soil conditions and the depth of the water table, can constrain root growth at deeper soil layers, giving results that are not consistent with the shallow vs deep paradigm. For example, a lack of vertical root segregation may still result in overyielding for the whole soil profile, as both species actually invest in higher biomass when growing in mixture (scenario C). Under our conditions, this pattern, considering root segregation per soil layer, and not throughout the whole soil profile, better matches our observations of root distribution in tree mixtures. ...58
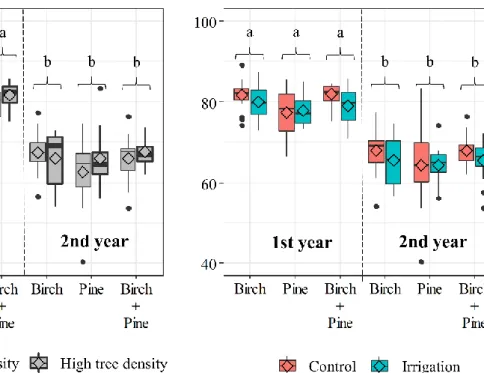
Fig. 4.1 Conceptual diagram representing our experimental setup. We take advantage of the slower growth and higher mortality rate of oak (small black dots) to test tree diversity effect at high and low stand densities of pine (dark green dots) and birch (light green dots) in the ORPHEE experiment. In each plot, we chose four zones for the study of root growth (‘Ingrowth’ subplots) and two zones for the study of the decomposition of roots (‘Decomp’ subplots). The four ‘Ingrowth’ subplots were regularly distributed over each plot and were used for tree and understory inventory, sampling of root standing biomass and the study of root dynamics with ingrowth cores. The two ‘Decomp’ subplots were assigned in half of the root zones. Diversity effects were tested between pure plots of pine, birch (solid squares) and pine x birch mixture (dashed line). The effect of stand density was tested using high-density plots (thick squares) and low-density plots (thin squares); these were plots were pine and birch grew together with oak. ...73 Fig. 4.2 Annual fine root productivity (g m-2 y-1) based on both biomass and necromass collected from the ingrowth-cores. The graph effects of stand density ‘D’(on the left), and irrigation ‘I’ (on the right) on the three tree species compositions ‘C’: birch monoculture, pine monoculture, and birch-pine mixture. Different lowercase letters indicate significant differences between the three tree species compositions. Asterisks ** indicate a significant effect of stand density (p < 0.01) for a given tree species composition. Values are means with st. errors. ...82 Fig. 4.3 Boxplots with medians (-), and means (◊) of fine root turnover (y-1). The effects of stand density (on the left), and irrigation (on the right) on the three tree species compositions: birch monoculture, pine monoculture, and birch-pine mixture. Different lowercase letters indicate significant differences between the three tree species compositions. The dashed lines indicate an overall significant difference between high (thick dashed line) and low (fine dashed line) stand density (p < 0.05). ...83 Fig. 4.4 Boxplots with medians (-), and means (◊) of fine root decomposition (root remaining mass %). The effects of stand density (on the left), and irrigation (on the right) on the three tree species compositions: birch monoculture, pine monoculture, and birch-pine mixture. Different lowercase letters indicate significant differences after 1 and 2 years of decomposition. ...84
xxiii Fig. 4.5 Boxplots with medians (-), and means (◊) of cumulative release (kg ha-1) of Carbon, Nitrogen, and Phosphorus. The effects of stand density (on the left), and irrigation (on the right) on the three tree species compositions: birch monoculture, pine monoculture, and birch-pine mixture. Different lowercase letters indicate significant differences between the three tree species compositions. The dashed lines indicate an overall significant difference between high (thick dashed line) and low (fine dashed line) stand density (p < 0.05). ...85
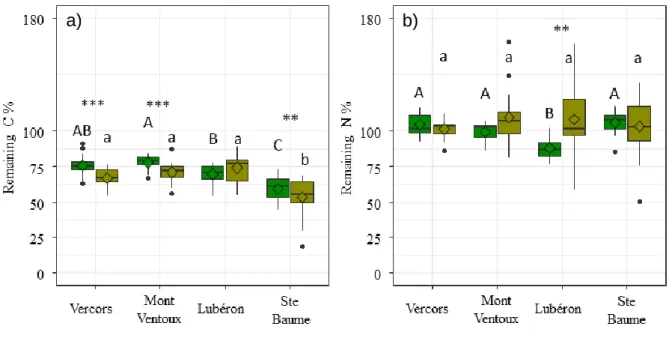
Fig. 5.1 Boxplots with medians (-), and means (◊) of remaining C%, and remaining N% of: a) root litterbags , b) leaf litterbags/fine mesh, as affected by rainfall exclusion, and depicted across sites. Different lowercase letters indicate significant differences between the sites. Asterisks indicate a significant difference between rainfall exclusion treatments (***; p < 0.001). ... 112 Fig. 5.2 Boxplots with medians (-), and means (◊) of: a) remaining C%, and b) remaining N%, on leaf litter as affected by contribution of fauna, and depicted across sites. Absence of letters and Asterisks means there were no significant effects. Different uppercase letters indicate significant differences between sites, for leaf litterbags with fine mesh, and different lowercase letters indicate significant differences between sites, for leaf litterbags with a coarse mesh. Asterisks indicate a significant differnce between litterbag type per site (**; p < 0.01), (***; p < 0.001). ... 114
Fig. B3.1 Curves of ground water level from the ORPHEE experimental site. The data presented are monthly values (January – December) with std. deviations (in parentheses) from 2015 (initiation year of the irrigation treatment) until 2018 (year of study). Water table depth (m). ... 152 Fig. B3.2 Ombrothermic diagram from the Cestas weather station, positioned 1.43 km from the ORPHEE experimental site. The data presented are monthly values (January – December) from 2015 (initiation year of the irrigation treatment) until 2018 (year of study). Temperature = monthly average temperature (°C), Precipitation = monthly total rainfall (mm). Precipitation scale = 2 × Temperature scale. Potential evapotranspiration per month (mm). By plotting in this manner, we identify the potential for water stress, when mean precipitation is lower than mean temperature. Source: CLIMATICK – INRAE. .. 153 Fig. B3.3 Stacked barchart showing the distribution of fine root understory biomass for each soil layer, under pure (birch or pine) and mixed plots (birch + pine), growing under control and irrigated conditions. ... 154 Fig. B3.4 Depth distributions for root traits of Betula pendula and Pinus pinaster for all four Irrigation × Mixture combinations (Pure – C; Mixed – C; Pure – IRR; Mixed – IRR). Presented data are mean values with st. errors for: (a, c) fine root mass density (FRMD; g m-3), (b, d) fine root length density (FRLD; cm cm-3). Effects of irrigation (IRR), mixture (MIX) and their interaction are indicated at the lower right side of each graph. Significant differences per soil depth, between combinations of Irrigation and Mixture are indicated with lower case letters. Absence of letters means that there are no significant differences. ... 155 Fig. B3.5 Depth distributions of fine root length divided into diameter classes of Betula pendula and Pinus pinaster for all four Irrigation × Mixture combinations (Pure – C; Mixed – C; Pure – IRR; Mixed – IRR). Presented data are mean fine root fraction values with st. errors for the following diameter classes: (a,e) [0.000 – 0.500 mm], (b, f) [0.500 – 1.000 mm], (c, g) [1.000 – 1.500 mm], and (d, h) [1.500 – 2.000 mm]. Effects of irrigation (IRR), mixture (MIX) and their interaction are indicated at the lower right side of each graph.. ... 156
xxiv Fig. B3.6 Cumulative fine root fraction with soil depth and the coefficients of the rooting distribution (β) of pure and mixed stands of Betula pendula and Pinus pinaster under: a) Irrigation, b) non-irrigation. The β values are calculated for fine root biomass (g m-2); the higher the β value (the closer to 1), the deeper is the vertical root distribution of fine roots. ... 157
Fig. C4.1 Annual fine root productivity (g m-2 y-1) per tree species composition, with the contribution of biomass and necromass measured in the ingrowth-cores, 1 and 2 years after ingrowth-core installation. Understory roots (on the left), tree roots (on the right). Values are means with st. errors. ... 164
Fig. D5.1 (a) Study area and block of the four sites in southeAstern France. Northern point Points (sites S1, S2) represent sites with European beech (Fagus sylvatica) and silver fir (Abies alba) forests. Southern points (sites S3, S4) represent southern sites with European beech and pubescent oak (Quercus pubescens) forests. The sites are located in the following mountain ranges of the French pre-Alps: Vercors (S1), Ventoux (S2), Grand Lubéron (S3), Sainte-Baume (S4) (b) Schematic representation of a site with two blocks per site. Each block comprises of one pure beech plot and one mixed plot. (c) Representation of an individual plot. Plots are circular with a central plot area (10 m radius) and a buffer zone (7.5 m radius). The red rectangles indicate rain-exclusion in summer. ... 170 Fig. D5.2 The soil moisture (%) during the summers of 2018 and 2019 when rainout shelters were installed for each site (Vercors, Mont Ventoux, Lubéron and Ste Baume) and block (block 1, and block 2). The percentage values on top of each bar represent the reduction in soil moisture under the rainout shelters, relative to the non-exclusion zone, for each site and block. ... 171 Fig. D5.3 Principal Component Analysis (PCA) of initial leaf and root litter quality of beech trees, collected from two blocks per site (Vercors, Mont Ventoux, Lubéron, Ste Baume). Litter quality includes the following elements: N, C, P, Ca, K, Mg, Mn. A PERMANOVA test showed that initial quality was different between the two litter types (p = 0.001). . 172 Fig. E6.1 Boxplot with medians (-), and means (◊) of annual hyphal productivity (kg ha-1 y-1), across all plots of the ORPHEE experimental design, and comparison between control (in red) and irrigated conditions (in blue). ... 174 Fig. E6.2 Multifaceted barchart of root tip colonization level (%) between birch and pine trees, grown in pure and mixed stands. Colonization levels under control conditions are depicted at the top panels, and under irrigated conditions at the bottom panels. ... 174 Fig. E6.3 Stacked barcharts depicting exploration types of birch and pine, grown in pure and mixed stands. Results under control conditions is depicted at the top panels, and under irrigated conditions at the bottom panels. ... 175 Fig. E6.4 Effect of irrigation on soil moisture for the months receiving the irrigation treatment (July – August – September – October) for the year of 2019. Barchart presents means with standard errors ... 175
1
Chapter 1 | Introduction
1.1 Changes in climate and biodiversity
Biodiversity enhances many of nature's benefits to people, including the regulation of climate and the production of wood in forests, and livestock forage in grasslands (Daily et al. 1997; Isbell et al. 2017). Biodiversity is declining at a fast pace mostly due to human activities leading to habitat conversion, degradation, fragmentation, overexploitation, pollution, and also to changes in atmospheric composition resulting from excessive use of fossil fuel. The combination of these human impacts accelerates climate change and biodiversity loss, with current species extinction rates likely exceeding those of the past (Butchart et al. 2010; Millennium Ecosystem Assessment 2005; Parmesan and Yohe 2003). Climate change affects ecosystems through a gradual climate warming that results in changing species distribution patterns and major extinctions (Thomas et al. 2004). In addition, climate change may also threaten the functioning of ecosystems through more frequent and more extreme climate events, such as prolonged drought (Hartmann 2011). Prolonged droughts reduce water availability in the soil, thereby limiting plant growth and affecting plant interactions and vegetation structure (Debouk et al. 2015). For example, trees that are long-lived species, may not be able to adapt to rapid changes in environmental conditions (changes in precipitation and/or temperature) (Aitken et al. 2008; McCormack et al. 2013). The adaptive ability of forest tree species to a changing climate could depend on whether trees can adapt to the new conditions by adapting aboveground organs, or its belowground uptake organs (through larger belowground allocation, or morphological, anatomical, physiological adaptations). Adaptations of the root system to a changing environment could be particularly relevant, because roots support plant growth with both, nutrient (higher potential demand under higher carbon supply), and water supply (higher potential demand is expected due to water stress, less precipitation and more transpiration). In fact, summer droughts have been shown to reduce forest productivity throughout Europe (Ciais et al. 2005; Dale et al. 2001; Jactel et al. 2012) and summer drought is predicted to increase in Central and Southern Europe over the next decades, with up to 40% less precipitation in summer
for the years 2071-2100 (Dankers and Hiederer 2008; IPCC 2014) (Fig. 1.1). According
to future climate scenarios, tree plantations and natural forests are expected to have to cope with drought events that may entail reduced forest productivity (woody biomass) due to reduced tree growth or higher tree mortality (Klein et al. 2019). There is a need for adaptive forestry strategies to meet the social demand for timber production (Gardiner and Moore 2014) and climate change mitigation through increased carbon sequestration (Bonan 2008; Seidl et al. 2014). Increasing tree species mixing in forests and tree plantations may be a solution for both of these requirements. The insurance hypothesis predicts that forests with tree species mixtures may resist better to stressful environmental conditions than forests composed of monocultures. Moreover, mixed tree species stands may increase forest productivity as well as contribute to higher C storage in soils (Dawud et al. 2017). For example, tree species richness can have an impact on soil carbon stocks through altered litter
2 decomposition rates, nitrogen fixation and rooting patterns, as well as on the water
balance, soil microclimate and nutrient availability (Böttcher and Lindner 2010), with
mixed plant communities potentially having higher carbon stocks than monocultures (Gamfeldt et al. 2013). Moreover, mixed species forests may create higher habitat diversity for other groups of species and increasing their abundance and/or diversity (Ampoorter et al. 2020), including soil biota such as macroarthropods, earthworms, enchytraeids, collembola, nematodes, isopods, acari, bacteria, protozoa, archaea, and fungi (Briones 2014). A higher diversity of soil biota, in particular, may mediate the supply of ecosystem services, for example by suppressing diseases, degrading pollutants, stimulating soil formation and water infiltration and through their effect on soil carbon dynamics contributing to climate regulation (Nielsen et al. 2015).
Fig. 1.1 Projected change in meteorological drought frequency between the present
(1981-2010) and the mid-century 21st century (2041-2070) in Europe, under two emissions scenarios; RCP 4.5 (moderate), RCP 8.5 (severe). Data source: Projections of future meteorological droughts in Europe provided by Joint Research Centre (JRC)
1.2 Importance of roots for nutrient cycling
The primary function of roots are anchorage and uptake of nutrients and water from soil. Roots achieve this, by exploring and exploiting the soil space, vertically, horizontally, and by adapting morphological root traits (such as root length density, root diameter, architecture), and physiological root traits, such as root respiration, nutrient uptake kinetics and root tissue nutrient contents (Bolte and Villanueva 2006; Göransson et al. 2007; Liese et al. 2017). Additionally, roots release C in the form of
exudates, respire C in the form of CO2, and form associations with mycorrhizal fungi
(Chen et al. 2000; Soudzilovskaia et al. 2015). The different ways with which roots can take up water and nutrients, and how they participate to soil C dynamics, positions roots as a primary essential link between living plants and the environment with respect to nutrient uptake.
3 Nutrients can be transported by mass flow or diffusive processes to the soil-root interface or associated symbiotic structures, where they are taken up by the roots. The part of the nutrients that are not used for root growth and function are then transported via xylem conduits to aboveground parts, where they are used for maintenance of existing living tissues and to produce stems, branches, twigs and foliage. During tissue senescence, plants recover a variable amount of nutrients through resorption, before dead organs such as leaves are deposited onto the soil, where they decompose and release nutrients during the mineralization of organic molecules that become potentially available to plants. The decomposition of leaf litter is recognized as a critical pathway linking above- and belowground processes (Polyakova and Billor 2007; Xuluc-Tolosa et al. 2003). Although leaf litter is an important source of nutrients for plants in most unmanaged terrestrial ecosystems, other plant organs, above all roots also contribute to organic matter derived nutrients. Their relative importance strongly depends on soil fertility and increases in particular on old and weathered soils, for example in some tropical ecosystems (Vitousek and Farrington 1997). Fine roots for example, represent 13–60 % of net primary production in different forest ecosystems (Brunner and Godbold 2007; Jackson et al. 1997; Ostonen et al. 2005), and the deposited fine root litter constitutes up to 30–46 % of total litter production (total of leaf and root litter) (Godbold et al. 2003; Joslin and Henderson 1987). These root deposits (also called ‘root litter’) contribute 18–58 % of total nitrogen (N) returned to forest soils from decomposing plant litter, and can thus be higher than that contributed by aboveground litterfall in some ecosystems (Vogt et al. 1986). Via associated mycorrhizal fungi that scavenge nutrients from soils and transfer a portion of these nutrients to their host plant in return for labile plant C (Smith & Read 1997), the plant-mycorrhizal association may promote belowground storage of C, in the form of root remains, their associated mycelium, and microbially transformed C. As such, roots and their associated mycorrhizae may determine soil C dynamics to a much larger extent than leaf litter decomposing at the soil surface as it was suggested for a boreal forest ecosystem (Clemmensen et al. 2013).
The predicted increasing drought occurrence with climate change, may force tree root systems to adapt through biomass allocation, changes in anatomy, physiology and even in the composition of the mycorrhizal community associated to tree roots (Hertel et al. 2013; Rewald et al. 2011; Weemstra et al. 2017), and these adaptations have implications for ecosystem functioning (Brunner et al. 2015). For example, more severe summer droughts in a future warmer climate may substantially alter C allocation between above- and below-ground, as trees may respond with a large increase in the size and productivity of the fine root system (Hertel et al. 2013), or by investing in deeper roots (Germon et al. 2020; Iversen 2010). If trees would invest in deeper roots, this may result in soil C sequestration within deeper soil layers. At the same time, under extreme drought events there may be increased fine root mortality in the top soil layers which increases the total flux of root carbon and nutrients that enter the top soil via
necromass (Majdi and Öhrvik 2004). Drought can also influence root anatomy
(anatomical conduits might narrow down, creating denser and less decomposable roots) (Kozlowski and Pallardy 2002) and root biochemistry (for example lignification or suberisation of roots can slow down decomposition) (Steudle 2000). While it is largely recognized that climate change can lead to substantially altered aboveground
4 litter production and decomposition, there is a lack of knowledge on how trees will respond belowground, and how this may affect belowground nutrient and carbon dynamics.
1.3 General aspects of biodiversity belowground
The generally positive relationship between plant diversity and productivity is well established with an increasing number of studies reporting increasing productivity with increasing plant diversity. This increased productivity is often referred to as ‘overyielding’ (i.e. when a species mixture results in higher aboveground productivity
than the average productivity of their component monocultures) in the biodiversity –
ecosystem functioning literature (Jactel et al. 2018). Higher aboveground productivity has been hypothesized to occur due to complementary use of resources with higher plant diversity, due to higher niche space filling and thus better resource partitioning by more species (Tilman et al. 2001). A key assumption of this hypothesis is that species differ in their traits and/or growth strategies permitting co-existence while allowing at the same time a more efficient uptake of resources such as light, nutrients, or water at the community level (Bauhus et al. 2017). Hence, a tree community that is composed of different species is likely functionally more diverse with a higher efficiency of resource capture than a community composed of a single species. Despite evidence that diverse forests are able to support higher levels of ecosystem functioning than forests with low species numbers (Gamfeldt et al. 2013), this positive relationship between biodiversity and ecosystem functioning may vary considerably among forest types, developmental stages of forests, geographic regions, and in relation to climatic conditions (Ammer 2019; Ratcliffe et al. 2017). The functional diversity of plant communities is largely described and quantified by aboveground plant traits that are then used for a better mechanistic understanding of biodiversity effects, but root traits remain critically understudied (Bardgett et al. 2014).
Positive diversity effects on root biomass (belowground overyielding) have been shown to be a consequence of an improved space filling of the soil volume, or of reduced competition due to a higher variation in root traits in species-rich stands, and thus lower interspecific competition compared to intraspecific competition of species-poor or single-species stands (Casper et al. 2000; Goldberg et al. 1999; Hodge 2004; Rajaniemi 2007). Previous studies on grasslands showed that herbaceous communities including both shallow- and deep-rooted species filled the available soil volume better (Dornbush and Wilsey 2010). If diverse plant communities use the available soil volume complementarily, the community may have higher total resource uptake, standing root biomass, belowground and aboveground productivity compared with less diverse communities (Husse et al. 2016; Mueller et al. 2013; Oram et al.
2018; Prechsl et al. 2015; von Felten et al. 2012). This phenomenon, named ‘spatial
resource partitioning’, is commonly referred to as a potential driver of positive biodiversity–ecosystem functioning relationships in grasslands. However, the few existing studies on tree communities reported ambiguous results. For example, increasing tree species diversity was reported to increase (Brassard et al. 2011, 2013; Meinen et al. 2009a; Schmid and Kazda 2002), have no effects (Fruleux et al. 2018; Meinen et al. 2009b) or even to decrease root productivity (Bolte and Villanueva 2006).
5 Similarly, vertical root segregation has been found in some (Bolte and Villanueva 2006; Schmid and Kazda 2002), but not in all of the studies investigating root distribution along the soil profile (Fruleux et al. 2018; Meinen et al. 2009b), which appears to be an important aspect to consider among other root traits (Barry et al. 2020; Zeng et al. 2020). A recent meta-analysis on herbaceous plants provided little evidence for a relationship between ‘spatial resource partitioning’ and belowground overyielding (only 3 out of 21 tested datasets showed a positive relationship, Barry et al. (2020)). Similarly for trees, the study by Zeng et al. (2020), found that roots growing into deeper, still unexplored soil layers were not sufficient contributors to the positive diversity-function relationship. However, the existing tree studies that have investigated how tree species compete along the vertical soil profile, investigated stand density and tree stand age (Schmid and Kazda 2002; Curt and Prévosto 2003; Bolte and Villanueva 2006; Fruleux et al. 2018) but not water availability. For instance, if the top soil layers are regularly dry during the summer months, plants will likely have part of their fine roots distributed in deeper layers as an important adaptation for plant survival (Padilla and Pugnaire 2007), resulting in more evenly distributed resource use across the whole profile (Mueller et al. 2013). This could well be important, since benefits of species mixing may be more pronounced on nutrient-poor and dry sites than on nutrient-rich and wet sites (Pretzsch 2013). This leads to the question, as to whether asymmetrical vertical root distributions (this implies roots from neighbouring tree species occupying different soil layers) could explain part of the belowground overyielding in mixed forests, and if water limitation may reinforce this effect.
1.4 Fine root dynamics
Fine root dynamics comprise the following three processes: fine root productivity,
turnover and decomposition (Fig. 1.2). Fine root productivity is the amount of fine root
biomass produced per unit of time, typically on an annual basis. Fine root turnover refers to the rate at which fine roots are replaced and is usually calculated by dividing
fine root production after variable periods of observation by living root standing
biomass (Gill and Jackson 2000; Joslin et al. 2000). Fine root decomposition is defined as the rate at which dead roots decompose within the soil. A high and frequent input of fine root biomass, paired with slow decomposition rates may account for higher soil carbon buildup due to direct plant litter contribution to the soil organic matter, or due to the contribution from products of microbial transformation of plant litter (Cotrufo et al. 2015). On the other hand, faster decomposition rates imply that nutrients from plant litter will be rapidly available for subsequent uptake by the trees. The rate at which fine root biomass turns over and fuels nutrient fluxes via decomposition in forests, may influence soil fertility and the potential for aboveground productivity (Hobbie 2015); this is especially important in the context of climate change, as the expected longer and more frequent summer droughts may interrupt fine root growth and decelerate decomposition (IPCC 2014).
6
Fig. 1. 2 Simplified scheme of pools and fluxes.
1.4.1 Environmental effects on fine root dynamics
The processes that comprise root nutrient cycling are generally influenced by climate, and soil fertility (Bakker et al. 2009; Brunner et al. 2015; McCormack and Guo 2014; Silver and Miya 2001). Previous studies on trees, that investigated simultaneously fine root production and turnover, reported that lower water availability may either: (i) simultaneously increase fine root production and turnover (Santantonio and Hermann 1985); (ii) decrease fine root production and turnover (Majdi and Andersson 2005); (iii) decrease production, but increase turnover (Meier and Leuschner 2008); or (iv) may have no influence on either (Joslin et al. 2000; Rytter 2013). Contrasting results have also been found relative to decomposition as fine root decomposition has been found to decrease (Gaul et al. 2008), increase (Zhang and Wang 2015a), or remain unchanged (King et al. 1997) under decreased water availability. These variable effects of water availability may be related to the general environmental context of the studies, including the intensity of water stress and to plant species-specific differences, including root traits such as root diameter and root tissue density. Moreover, there are not enough studies that measured fluxes of nutrients by roots, by combining all three processes in a holistic manner (Guo et al. 2006; Morozov et al. 2018; Palviainen et al. 2004). More studies manipulating water supply are needed to improve our understanding of the potential effect of lower water availability on fine root dynamics, and how nutrients move between the different pools.
1.4.2 Biodiversity effects and resource availability
Mixed species forests have been shown to better withstand drought episodes and fire-outbreaks with higher rates of tree survival than monocultures (Klein et al. 2019). It was further shown that nutrient cycling rates increased in species-rich compared to species-poor forests with increasingly unfavourable environmental conditions in relative terms, suggesting that species rich forests may adapt better to changing environmental conditions (Ratcliffe et al. 2017; Richards et al. 2010). Ratcliffe et al. (2017) found that water availability was the most important environmental factor in changing the relationship between tree species richness and forest functioning and