HAL Id: hal-00295533
https://hal.archives-ouvertes.fr/hal-00295533
Submitted on 29 Sep 2004
HAL is a multi-disciplinary open access
archive for the deposit and dissemination of
sci-entific research documents, whether they are
pub-lished or not. The documents may come from
teaching and research institutions in France or
abroad, or from public or private research centers.
L’archive ouverte pluridisciplinaire HAL, est
destinée au dépôt et à la diffusion de documents
scientifiques de niveau recherche, publiés ou non,
émanant des établissements d’enseignement et de
recherche français ou étrangers, des laboratoires
publics ou privés.
particle and radiation measurements
L. Laakso, T. Petäjä, K. E. J. Lehtinen, M. Kulmala, J. Paatero, U. Hõrrak,
H. Tammet, J. Joutsensaari
To cite this version:
L. Laakso, T. Petäjä, K. E. J. Lehtinen, M. Kulmala, J. Paatero, et al.. Ion production rate in a
boreal forest based on ion, particle and radiation measurements. Atmospheric Chemistry and Physics,
European Geosciences Union, 2004, 4 (7), pp.1933-1943. �hal-00295533�
www.atmos-chem-phys.org/acp/4/1933/
SRef-ID: 1680-7324/acp/2004-4-1933
Chemistry
and Physics
Ion production rate in a boreal forest based on ion, particle and
radiation measurements
L. Laakso1, T. Pet¨aj¨a1, K. E. J. Lehtinen1, M. Kulmala1, J. Paatero2, U. H˜orrak3, H. Tammet3, and J. Joutsensaari4
1Department of Physical Sciences, P.O. Box 64, FI-00014 University of Helsinki, Finland
2Finnish Meteorological Institute, Air Quality Research, Sahaajankatu 20E, FIN-00880 Helsinki, Finland
3Institute of Environmental Physics, University of Tartu, 18 ¨Ulikooli Street, Tartu, 50090, Estonia
4Department of Applied Physics, University of Kuopio, P.O. Box 1627, FIN-70211 Kuopio, Finland
Received: 23 April 2004 – Published in Atmos. Chem. Phys. Discuss.: 20 July 2004
Revised: 17 September 2004 – Accepted: 21 September 2004 – Published: 29 September 2004
Abstract. In this study the ion production rates in a bo-real forest were studied based on two different methods: 1) cluster ion and particle concentration measurements, 2) external radiation and radon concentration measurements. Both methods produced reasonable estimates for ion pro-duction rates. The average ion propro-duction rate calculated from aerosol particle size distribution and air ion
mobil-ity distribution measurements was 2.6 ion pairs cm−3s−1,
and based on external radiation and radon measurements,
4.5 ion pairs cm−3s−1. The first method based on ion and
particle measurements gave lower values for the ion produc-tion rates especially during the day. A possible reason for this is that particle measurements started only from 3 nm, so the sink of small ions during the nucleation events was un-derestimated. It may also be possible that the hygroscopic growth factors of aerosol particles were underestimated. An-other reason for the discrepancy is the nucleation mechanism itself. If the ions are somehow present in the nucleation pro-cess, there could have been an additional ion sink during the nucleation days.
1 Introduction
Nucleation followed by particle growth has recently been ob-served at various locations and by several research groups (see overview by Kulmala et al. (2004) and references therein). Although these bursts of new particles have been frequently observed, the mechanisms of particle formation still remain unclear. Several nucleation mechanisms have been proposed, including classical binary homogeneous nu-cleation, ternary nucleation (Kulmala et al., 2000a), ion-induced nucleation and ion-mediated nucleation (Yu and
Correspondence to: L. Laakso
Turco, 2000). Recent results indicate the possibility of barri-erless nucleation (Laakso et al., 2004). None of the mecha-nisms have been confirmed or rejected yet and it may be pos-sible, that several of these mechanisms are simultaneously effective in the atmosphere.
For ion-induced nucleation, the ion production rate is one of the factors governing the nucleation rates. Even if con-densation is enhanced by electric interactions (Yu and Turco, 2000),the maximum nucleation rate is still equal to the ion production rate. This is one of the reasons why the ion pro-duction rate is such a key quantity in atmospheric physics. The measurements of the ionization rate can be divided into two groups: direct measurements by means of ionization chambers and indirect measurements based on calculations according to the balance equation for small air ions. If dif-ferent measuring methods are compared, the measurement method, measuring height and time (summer/winter) should be given.
Overviews of the earlier measurements (mainly before 1950) of the ionization rate have been made by Israel (1970, 1973) and Chalmers (1967). An average ionization rate of
10 ion pairs cm−3s−1 is considered a standard at the height
of 1 m from the ground in continental areas.
Considering different locations, the ionization rate could exhibit considerable variation depending on the content of radioactive substances in the ground, on the soil properties, on the water content of the snow cover, and due to local orography. The measurements below 1 m strongly depend on the ionization profile. The ionization rate decreases with altitude near the ground up to about 1–2 km, and increases
with altitude with a maximum of about 50 ion pairs cm−3s−1
near 15 km (Hoppel et al., 1986; Mohnen, 1977; Rosen et al., 1985).
In continental areas, the temporal variation of the ioniza-tion rate (annual and diurnal variaioniza-tion) is mostly due to the variation in radon and thoron concentration. The ionization
rate can be used as an indicator of boundary layer stability similarly as the concentration of radon (Porstend¨orfer, 1994; Kataoka et al., 1998).
Galactic cosmic rays (GCR) are the primary ionization source above the oceans. The intensity of the cosmic rays in the atmosphere is modulated by the 11-year solar cycle. This modulation increases as a function of height (Larsen, 1993). A comprehensive review of ionization rate measure-ments in marine environmeasure-ments was compiled by Hensen and van der Hage (1994), depicting a variation in ionization rate
from 1.5 to 2.9 cm−3s−1within different latitudes.
Ionization rates have recently been measured by
(Dhanorkar and Kamra, 1994; Wilkening, 1985; Mochizuki et al., 1977; Hensen and van der Hage, 1994). Dhanorkar and Kamra (1994) have used a set of integral ion counters to measure the small ion concentration and the aerosol ion mobility distribution at a height of about 1 m above the ground at Pune, India. The ionization rate was calculated based on a balance equation. The two-day measurements showed a diurnal variation of the ionization rate with a
mini-mum of 2.75 ion pairs cm−3s−1at noon and a maximum of
117 ion pairs cm−3s−1in the early morning.
Wilkening (1985) measured small ion and radon con-centrations in Carlsbad Caverns in southwestern United States. The ion pair production rates have been estimated
from a knowledge of the radon (220Rn, 222Rn)
concen-trations, and their daughters under equilibrium conditions in outdoor air, and from published values of cosmic ray fluxes. The estimated ion production rates for the Lang-muir Laboratory for Atmospheric Researh (3240 m msl) and for Rio Grande Valley at Socorro (1410 m) were 10 and
15 ion pairs cm−3s−1, respectively. The estimate for
Carls-bad Caverns (230 m underground, surface elevation 1340 m)
was 2300 ion pairs cm−3s−1.
Mochizuki et al. (1977) designed an ionization chamber for continuous monitoring of the ion formation rate in the at-mosphere. Results for one day at two different levels (0.2 m and 1 m) were presented. The diurnal variation of the
ion-ization rate at 1 m has a minimum of 6 ion pairs cm−3s−1at
noon and a maximum of 13 ion pairs cm−3s−1during
night-time. The ionization rate at a height of 0.2 m displayed the same pattern, but was about two times higher (minimum
10 ion pairs cm−3s−1and maximum 22 ion pairs cm−3s−1).
This can be attributed to the steep radon concentration gradi-ent in the air close to the ground (Liu et al., 1984).
Since the ion production rate is such a crucial factor when investigating the charging state of aerosols and the possi-bility of ion-induced nucleation, it is studied in further de-tail, in this case in a Finnish boreal forest. Two indepen-dent methods for obtaining the ion production rate are com-pared. The first method is based on a balance equation for small cluster ions and the second method on the measure-ments of radon and external radiation. The experimeasure-ments were carried out during the QUEST (Quantification of aerosol nucleation in the European boundary layer) 2-measurement
campaign in spring 2003 at SMEAR (Station for MEasur-ing forest ecosystem-Atmosphere Relations) II-measurement
station (61◦510N, 24◦170E, 180 m above sea level) (Vesala
et al., 1998; Kulmala et al., 2001) in Hyyt¨al¨a, Finland.
2 Experimental setup and theory
In this study several different instruments were utilized. The mobility distribution of the ions was measured with a Bal-anced Scanning Mobility Analyzer (BSMA), of the particles with two differential mobility particle sizers (DMPS) and an aerodynamical particle sizer (APS). The ionizing radiation was measured by glass-fibre filters and a scintillation gamma spectrometer. All instruments are explained in more detail in the next sections.
2.1 BSMA
The Balanced Scanning Mobility Analyzer (BSMS), man-ufactured by Airel Ltd., Estonia, consists of two plain aspiration-type differential mobility analyzers, one for pos-itive and the other for negative ions. The two aspiration con-densers are connected as a balanced bridge circuit that allows continuous variation of the driving voltage and scanning of the mobility distribution of charged clusters and nanoparti-cles, usually called air ions. A large airflow rate of 44 liters per second helps to suppress the loss of air ions in the in-let of the instrument. The inin-let can be closed or opened for ions using a controlled electrostatic filter and the background signal is eliminated making every second scan with a closed inlet. A mobility distribution is calculated according to the results of 9 scans performed during 3 min. The electrical
mo-bility range of 0.032–3.2 cm2V−1s−1is logarithmically
uni-formly divided into 16 fractions. The mobility distribution is converted to size distribution using the algorithm developed by Tammet (1995). The size distribution is presented by 12 fractions, logarithmically uniformly distributed in the diam-eter range of 0.4–6.3 nm. The sampling height was about 1.6 m above the ground.
2.2 DMPS
For sub-micron particle sizing the main instrument used was the differential mobility particle sizer (DMPS), operated 2 m above the ground and with a time resolution of 10 min. The system consists of two parallel DMPS devices: one classi-fying the particles between 3 and 10 nm and the other be-tween 10 and 500 nm. Both devices use a Hauke-type differ-ential mobility analyzer (DMA) (Winklmayr et al., 1991) and a closed loop sheath flow arrangement (Jokinen and M¨akel¨a, 1997). The first device consists of a 10.9 cm long DMA and a TSI model 3025 Condensation Particle Counter (CPC) and the second one of a 28 cm long DMA and a TSI model 3010 CPC. Before sizing the aerosol is neutralized with a 74 MBq (2 mCi) Krypton-85 beta source.
The conventional DMPS measures particle size distribu-tions at dry condidistribu-tions with a RH typically below 10%. In addition to the dry conditions, we have measured particle size distributions at higher relatively humidifies with a wet-DMPS system. In the wet-wet-DMPS, the aerosol particles are humidified with water vapor before the particle size mea-surement. The wet-DMPS system consists of a Gore-Tex type aerosol humidifier, a Hauke-type DMA (10.9 cm long), a sheath air humidifier unit and an ultrafine CPC (TSI 3025). The construction of the system (e.g. humidifiers) is based on the hygroscopic tandem DMA described in detail by Jout-sensaari et al. (2001). The size distributions were measured every 10 min at RH of 90% for 3–70 nm particles. The sam-pling height was about 4 m above the ground.
In principle, the freshly formed nucleation mode particles can be observed earlier with the wet-DMPS compared to the dry-DMPS if they grow to detectable size during humidifica-tion, i.e. particles below 3 nm in diameter (detection limit of the dry DMPS) at dry conditions can be detected.
2.3 APS
For large particle sizing, an aerodynamical particle sizer (APS) (model TSI 3320) was used. The APS measures par-ticle size distributions from 0.7 µm to 20 µm by determining the time-of flight of individual particles in an accelerating flow field (Peters and Leith, 2003). The particle size dis-tributions measured with the APS were transformed to mo-bility equivalent diameter by dividing the aerodynamic di-ameter by the square root of the estimated particle density
of 1.9 g cm−3. This density has been found to give a good
agreement between DMPS and APS size distributions (Aalto et al., 2001) in Hyyti¨al¨a during previous campaigns.
2.4 Measurements of ionizing radiation
In the lower troposphere, ions are created mainly by cosmic radiation, radiation from the ground and decay of radon emit-ted from the ground. Both of these ion sources are contin-uously measured in Hyyti¨al¨a. The sampling inlet is ca. 6 m above the ground. Measurements of airborne radon-222 have been made since March 2000.
2.4.1 Measurements of radon
The222Rn content of the air is monitored continuously by
counting the beta particle emissions of the particle-bound
daughter nuclides214Pb and214Bi collected onto glass-fibre
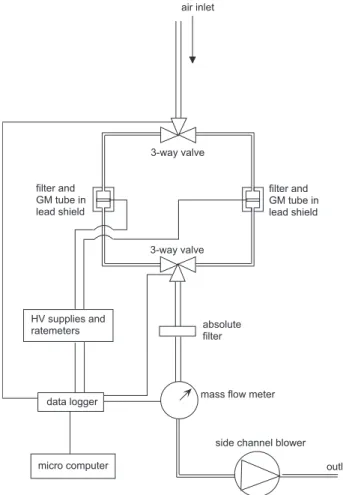
filters (see Fig. 1). 222Rn, being a noble gas, cannot be
col-lected with aerosol filters. The beta activity of the short-lived
222Rn progeny is distinguished from the220Rn progeny and
artificial radioactivity by their half-life differences (Paatero et al., 1998). The air flow is directed through one of two fil-ters alternately for four-hour periods. The count rate of the Geiger-Mueller (GM) tube increases as beta-active aerosol particles accumulate onto the filter. After four hours the air
a i r i n l e t 3 - w a y v a l v e f i l t e r a n d G M t u b e i n l e a d s h i e l d 3 - w a y v a l v e a b s o l u t e f i l t e r m a s s f l o w m e t e r s i d e c h a n n e l b l o w e r o u t l e t d a t a l o g g e r m i c r o c o m p u t e r H V s u p p l i e s a n d r a t e m e t e r s f i l t e r a n d G M t u b e i n l e a d s h i e l d
Fig. 1. Setup of the radon monitoring system (HV: high voltage,
GM: Geiger-Mueller).
flow is directed through the other filter. If the beta
activ-ity on the first filter is due to222Rn progeny only, it decays
practically completely during the following four hours and the count rate of the GM tube returns to base level. If,
how-ever, there is220Rn progeny or artificial radioactivity present
on the filter, the count rate remains above the base line after the four-hour period due to the longer half-lives of these
nu-clides.222Rn was assumed to be in equilibrium with its
short-lived progeny. The ion pair production rate caused by222Rn
and its short-lived progeny was calculated by taking into con-sideration the total energy of the three alpha and the two beta particles and by assuming an average energy of 34 eV per produced ion pair. The uncertainty of ionization rate caused by radon varies between 3% and 20% depending on the radon activity concentration.
2.4.2 Measurements of external radiation
External radiation consisting mainly of cosmic radiation and gamma radiation from the ground was measured with a
scin-tillation gamma spectrometer system. A 76 mm×76 mm
temperature was maintained. The shelter is located 1.5 m above the ground. The gamma spectra are recorded with a computer add-on board containing a high-voltage supply for the photomultiplier tube, a shaping amplifier and a 1024-channel pulse-height analyzer. The energy spectra between 100 and 3000 keV are acquired in 10-minute intervals using a digital spectrum stabilizer. The observed count rates are converted to the dose rate units with a calibration factor ob-tained by a comparison to a calibrated pressurized ionization
chamber. The dose rate values (mGy h−1=mJ kg−1h−1) are
converted to ion production rates (ion pairs m−3s−1) by
as-suming an average energy of 34 eV per produced ion pair. The uncertainty in ionization rate caused by the external ra-diation is ±10%.
2.5 Ion production rate calculated from ion and aerosol
par-ticle measurements
The balance equation for the small cluster ion concentration is (Israel, 1970) dn± dt =Q − αn±n∓−n± Z dp ∞ X q=−∞ β±(dp, q)N (dp, q)ddp (1)
where Q is the ion production rate, n±is the concentration
of positive or negative cluster ions, α is the ion-ion
recombi-nation coefficient, β±(dp, q)the cluster ion-aerosol particle
attachment coefficient, q is the charge of the aerosol
parti-cle and N (dp, q)the concentration of aerosol particles. The
sink of small ions by ion-induced nucleation is not taken into account in this simplified balance equation. In the case of steady state, the derivative in Eq. (2) is equal to zero and thus the ion production rate Q can be obtained. This leads to
Q = αn±n∓+n± Z dp ∞ X q=−∞ β±(dp, q)N (dp, q)ddp (2)
Because the concentrations of cluster ions and aerosol par-ticles are measured and the recombination and attachment coefficients can be calculated, it is possible to estimate Q from measurements independently of direct measurements.
Both the DMPS and the APS measured size distributions of dry particles. Thus, the effect of ambient relative humidity had to be somehow taken into account. In this work, we used a simple parameterization suggested by Zhou (2001)
GF = (1 − RH /100)γ (dp). (3) This parameterization gives the particle growth factor GF (ie. how much the particle diameter is increased), due to absorption of water vapour as a function of relative humid-ity (RH). The above parameterization was based on mea-surements conducted in the Arctic Ocean. In this study we used γ (dp) values obtained by fitting a first order polyno-mial to the measurements carried out in Hyyti¨al¨a during the BIOFOR (Biogenic Aerosol Formation in the Boreal For-est) campaign (H¨ameri et al., 2001) for the size range 10– 264 nm. The growth factors of possible different externally
mixed (hygroscopicity) modes were weighted by their corre-sponding fractions. The size dependence of the exponential
γ was obtained by optimizing a linear function, to obtain
γ = −3.11 · 105·dp/dp0−0.0847. (4)
where the non-dimensionalizing factor dp0 is 1 m. The
growth factors during QUEST 2-campaigns were measured with two independent devices at a constant relative humid-ity. A Hygroscopic Tandem Differential Mobility analyzer (HTDMA) (e.g. H¨ameri et al. (2000)) measured growth fac-tors for monodisperse aerosol samples (8, 10, 20 and 50 nm in diameter) at 90% RH. A wet-DMPS was used to measure aerosol growth and the consequent size distribution change at 90 % RH for particles from 3 to 70 nm in diameter. The largest contribution to the condensation sink comes from ac-cumulation mode particles, of which we did not have any hygroscopicity measurements. Existing measurements, how-ever, can be used to establish the quality of the parameteri-zation. For 90% RH, the parameterization gives a growth factor of 1.2–1.3. Based on the HTDMA measurements, the average growth factor for 50 nm particles was 1.29±0.11 for the whole campaign period. At the same time the wet-DMPS measurements gave a growth factor of about 1.14 (standard deviation σ =0.18) at 90% to the nucleation mode particles (average dry diameter about 20 nm). During nucle-ation events the average growth factor and dry particle diam-eter were about 1.08 (σ =0.14) and 9 nm (σ =3 nm), respec-tively. Thus, the parameterization seems to produce reason-able values in the Aitken size range, whereas it overestimates the growth for the nucleation mode particles.
Based on Eq. (3), measured dry size spectra were con-verted to wet size spectra at ambient relative humidities.
The ion-aerosol attachment coefficients were calculated according to Fuchs attachment theory (Fuchs, 1964) based on measured mobilities and temperatures. The masses of the ions were estimated according to the method given by Tam-met (1998), in which the small ion mass is correlated with its mobility by
K = (1200u mion
)1/3−0.2 (5)
where K is in cm2V−1s−1, and the mass mionis in the range
of 30–2100 u. The correlation is based on experimental data by Kilpatric (1971). Next the mean mobility of cluster ions was calculated based on BSMA-measurements. Only nega-tive ions were utilized in our studies since posinega-tive ions gave approximately similar results. Finally, Eq. (2) was solved for each individual measured particle size distribution spectrum to obtain the ion production rate Q.
3 Results
In this study, we used the period 20 March–11 April or
days 79–101 of the year 2003. All data was
10−9 10−8 10−7 10−6 10−5 10−4 10−8 10−7 10−6 10−5 10−4 10−3 10−2 Particle diameter [m] dN/dlog(d p ) ⋅ β (dp ) [s − 1] DMPS size range
APS size range
Fig. 2. Average factor dN/dlog(dp)β(dp, q)(see Eq. 2) for period from 20 March to 13 April 2003. Size ranges of DMPS and APS
corresponding to relative humidity 90% are also shown.
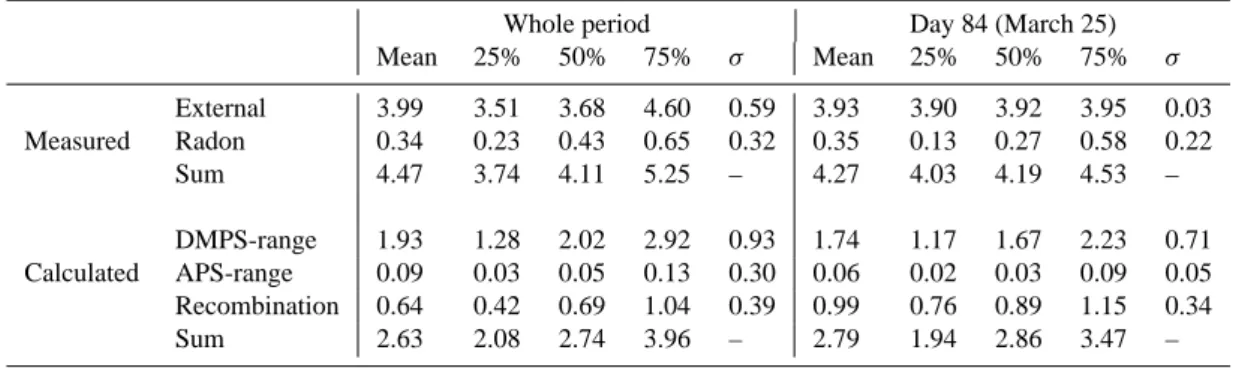
Table 1. Statistical characteristics (mean, 25%, 50%, 75% quantiles and standard deviation) of estimated ion production rates, in cm−3s−1 Whole period Day 84 (March 25)
Mean 25% 50% 75% σ Mean 25% 50% 75% σ External 3.99 3.51 3.68 4.60 0.59 3.93 3.90 3.92 3.95 0.03 Measured Radon 0.34 0.23 0.43 0.65 0.32 0.35 0.13 0.27 0.58 0.22 Sum 4.47 3.74 4.11 5.25 – 4.27 4.03 4.19 4.53 – DMPS-range 1.93 1.28 2.02 2.92 0.93 1.74 1.17 1.67 2.23 0.71 Calculated APS-range 0.09 0.03 0.05 0.13 0.30 0.06 0.02 0.03 0.09 0.05 Recombination 0.64 0.42 0.69 1.04 0.39 0.99 0.76 0.89 1.15 0.34 Sum 2.63 2.08 2.74 3.96 – 2.79 1.94 2.86 3.47 –
namely 360 seconds. The average ion production rate cal-culated from DMPS, APS and BSMA-measurements was
2.6 ion pairs cm−3s−1and from external radiation and radon
measurements it was 4.5 ion pairs cm−3s−1(Table 1).
Dur-ing the study period the amount of220Rn progeny and
artifi-cial radioactivity in the air was insignificant compared to the
amount of222Rn.
In the case of direct measurements, the external radiation was mostly responsible for ion production; the contribution from radon was about 10%, with a maximum value of about 36% recorded on 26 March, 1999, in Hyyti¨al¨a.
In the case of the indirect method, ion sink and thus ion production rate were mainly influenced by the concentration
of particles in the size range of 5–500 nm measured by means of DMPS. The contribution of large particles (measured by APS) was always less than 10%, having an average about 2%. Also the effect of ion-ion recombination was significant.
The ion sink size distribution dN/dlog(dp)·β±(dp,q)
is shown in Fig. 2 using an average mobility
1.23×10⁻⁴cm2V−1s−1, temperature +5◦C and
rela-tive humidity 90%. The DMPS and APS size ranges
corresponding to 90% relative humidity are also shown. It can be seen that the ion sink is dominated by the particle diameter range 30–700 nm.
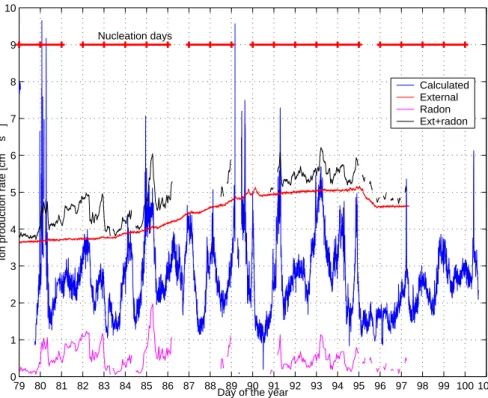
The ion production rates calculated with the two different methods are shown in Fig. 3. Both measurements showed
79 80 81 82 83 84 85 86 87 88 89 90 91 92 93 94 95 96 97 98 99 100 101 0 1 2 3 4 5 6 7 8 9 10
Ion production rate [cm
−3
s
−
1]
Day of the year
Calculated External Radon Ext+radon Nucleation days
Fig. 3. Ion production rates calculated from external radiation and radon measurements and based on DMPS, BSMA and APS measurements.
In addition, days with clear particle formation are shown.
79 80 81 82 83 84 85 86 87 88 89 90 91 92 93 94 95 96 97 98 99 100 101−2
−1 0 1 2
Day of the year
Radon−based ion production rate [cm
− 3 s − 1] −1 0 1 2
Flux Richardson number
79 80 81 82 83 84 85 86 87 88 89 90 91 92 93 94 95 96 97 98 99 100 101 0
50 100
Relative humidity [%]
Day of the year
79 80 81 82 83 84 85 86 87 88 89 90 91 92 93 94 95 96 97 98 99 100 101 −20 −10 0 10 Temperature [ °C] 79 80 81 82 83 84 85 86 87 88 89 90 91 92 93 94 95 96 97 98 99 100 101 0 0.5 1 Rain intensity [mm h − 1 ]
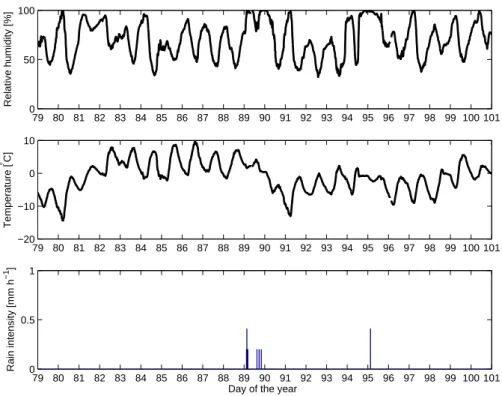
Fig. 5. Relative humidity, air temperature and rain intensity during the QUEST 2-campaign.
the highest ion production rates in the middle of the mea-surement period. However, the ion production rates obtained from external radiation and radon measurements have much less variability than the rates calculated from ion and par-ticle measurements. One similar feature for both methods is that the ion production rate is highest during nighttime. This is likely to be due to radon accumulation on the surface layer during the stable nighttime conditions. One good mea-sure of boundary layer stability is the so-called Flux Richard-son number Rf (Seinfeld and Pandis, 1998) which is based on heat and momentum fluxes measured by eddy covariance technique. In Fig. 4 Rf is shown together with the radon-based ion production rate. During the night Rf is often pos-itive representing stable conditions. The curves represent-ing Rf and radon-based ion production have certain key fea-tures: the ion production rate is peaking after Rf because radon is accumulating during the night and the concentration reaches its maximum in the early morning. During day 81 there is only very little mixing, so radon is accumulating for a longer period than one night.
To check the effect of the growth factor parameter-ization to the results, the growth factors were varied
by ±10% compared to Eq. (3). The resulting ion
production rates were 2.4 ion pairs cm−3s−1 (for −10%)
and 2.9 ion pairs cm−3s−1 (for +10%), so the hygroscopic
growth factor has indeed a significant effect on the ion sink and therefore on the calculated ion production rate. In addi-tion the diurnal cycle of RH amplifies the effect. However, it can not explain the systematic differences between the ion
production rates obtained by these two methods. Two other tests were made to check the assumptions used in the calcu-lations. One average cluster ion size instead of six cluster ion size intervals were used in the calculations. The effect was, on average, less than one percent compared to the case where the ion loss rate was calculated separately for all the six size classes and then summed up.
Another approximation was made regarding hygroscopic growth. We used one average growth factor for all particles of a certain size. However, in reality, there is normally sev-eral external hygroscopic growth modes present in the atmo-sphere (H¨ameri et al., 2001). Because the ion loss is pro-portional to the diameter of the particle, using an average growth factor may lead to errors. However, the the effect of hygroscopic mode separation was found to be less than 5% compared to one average growth factor.
In case of high relative humidity, there may be fog forma-tion causing an addiforma-tional sink to the ions. Unfortunately, we did not have fog measurements during the QUEST 2-campaign. However, at least during days 81, 89 and 95 the relative humidity stayed high all day (Fig. 5) which indicates fog formation and thus an increased ion loss rate. The same applies for rain episodes: it is observed that rain droplets are charged, consequently the scavenging of ions onto rain droplets may reduce the concentration of ions. However, there was practically no rain during the period; only dur-ing days 89 and 95 there were some precipitation. Based on earlier data from the BIOFOR III-campaign (H˜orrak et al., 2003), it seems that rain normally does not significantly
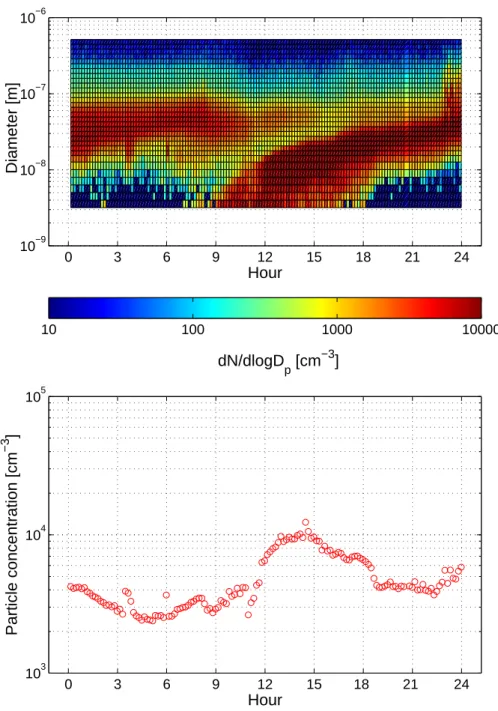
0 3 6 9 12 15 18 21 24 103 104 105 Particle concentration [cm −3 ] Hour 0 3 6 9 12 15 18 21 24 10−9 10−8 10−7 10−6 Diameter [m] Hour dN/dlogD p [cm −3 ] 10 100 1000 10000
Fig. 6. Particle size spectrum measured by DMPS in 25 March 2003 (upper panel) and and the particle concentrations with diameter from 3
to 500 nm as a function of time of the day (lower panel).
change the concentration of small ions. Lower concentra-tions were observed only when the RH was over 98%. Dur-ing the whole period used in the present study, there was snow cover at Hyyti¨al¨a measurement station.
During the nucleation bursts, there is a possible additional sink of small ions by ion-induced nucleation. Nanometer sized particles are sometimes observed to be slightly over-charged (Laakso et al., 2004), which indicates an effect of ions on the nucleation process. Another, more probable ion sink during the nucleation burst is caused by the particles in
the diameter range of 1.5–3 nm, which are not measured by common aerosol instruments. If we for example assume a
concentration of 1.5–3 nm particles of 30 000 cm−3, a value
that is based on model studies (Laakso et al., 2004), and
a concentration of small ions of 1000 cm−3, the additional
ion sink is roughly 1 ion pair cm−3s−1during the nucleation
bursts.
The concentration of particles below the detection limit of the dry DMPS (3 nm) can be estimated from wet-DMPS re-sults since the particles can grow to detectable size during
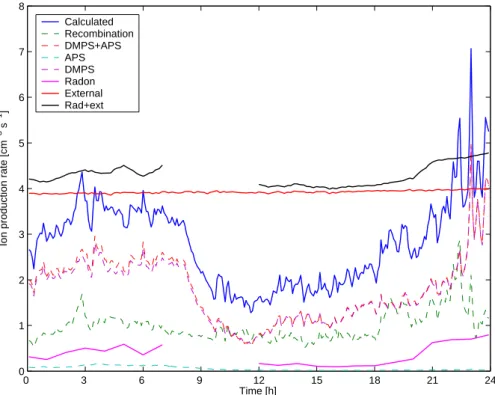
0 3 6 9 12 15 18 21 24 0 1 2 3 4 5 6 7 8 Time [h]
Ion production rate [cm
−3 s − 1] Calculated Recombination DMPS+APS APS DMPS Radon External Rad+ext
Fig. 7. Ion production rate during on 25 March 2003 (day 84). Calculated mean of the sum of recombination and APS- and DMPS-size
ranges, All particles is the combination of DMPS- and APS-size ranges.
humidification. The concentration of 2.5–3.0 nm particles has been estimated assuming that the growth factor of the fine particles is about 1.2. The average concentration is
ap-proximately 200 cm−3over all measurement days and about
700 cm−3during nucleation events. The maximum observed
2.5–3 nm particle concentration is around 8000 cm−3which
indeed has a significant effect on the ion concentration during the nucleation events.
One of the most interesting features of these kind of sim-ulations is that they offer us a method to study the existence of so called thermodynamically stable clusters (TSCs) (Kul-mala et al., 2000b). TSCs cannot be observed directly by standard aerosol size distribution measurements because of their small size (of order 1 nm). If the background particle concentration is so high that it hinders particle growth to ob-servable sizes, there can still be enough particles to cause an additional ion sink which can be seen from the difference of calculated and radon and external radiation based measure-ments. It has been previously found that TSC’s may form nearly every day, but they can only be observed after growth to sufficiently large sizes before they are scavenged. If we, for example, compare sunny (=there is sulphuric acid forma-tion) and cloudy days with relatively high background con-centrations, we may see a difference caused by the TSC’s. This particle formation pathway, however, may be in inter-play with ion-accelerated cluster formation (Laakso et al., 2004), and the relative importance of the mechanisms are yet unknown.
There are also some more causes of uncertainties. The orography of the measurement locations may have an effect on the systematic differences between these two methods. This is because the concentrations of radon and ions were measured a few tens of meters apart and at different heights (of about 6 and 2 m, respectively). The forest canopy may also provide an additional sink for the ions, which was not taken into account in this study. The applied model of the ionization process has also some degree of approximation. The measured dose rate and radon concentration data were converted to ion production rates by assuming that all the en-ergy goes to ionization and that it takes 34 eV to produce one ion pair in air. In reality a part of the energy is, however, con-sumed to other processes. After the alpha particle emission the recoiling daughter nucleus can also cause intense ioniza-tion but within a very short distance.
One other uncertainty is related to the lack of knowledge on the ion-ion recombination process in the real atmosphere. The recombination is a three-body process (Bates, 1985), and depends on the mobility and energy of ions. The mobility de-pends on ion-cluster formation (initial species, free electron and positively charged kernel of “air molecule” after about 1 microsecond form ion clusters). It is rational to assume that the recombination rate of ion-clusters just after the ionization act in the vicinity of “ionization-track”, is higher than after its dispersion. Therefore the recombination rate is dependent on the type of ionizing radiation (alpha, beta, gamma); it is high-est in the case of alpha-radiation (short tracks) and lowhigh-est in
the case of gamma-radiation (uniform ionization through the
volume). In this study we used the value 1.6×10⁻⁶cm3s−1
for the recombination coefficient, a value often cited in the textbooks of atmospheric electricity (Israel, 1970).
In addition to the studied period, one particular day, 25 March 2003 (day 84) was chosen to be investigated in more detail. This day was chosen because it was one of the clear-est particle formation days during the campaign. The number distribution evolution as well as the total number concentra-tion evoluconcentra-tion of the day are shown in Fig. 6. During this day the ion production rates estimated by the two methods displayed nearly equal values during nighttime, but consid-erable difference during daytime.
The contributions of different model calculations and ra-diation measurements on 25 March 2003 are shown in
Fig. 7 and Table 1. Recombination is quite steady
dur-ing the day, whereas some other sinks are underestimated. The expected increment of the ion production rate of about
1 ion pairs cm−3s−1 caused by an additional hypothetical
sink of small ions, followed the generation of 1.5–3 nm
parti-cles of about 30 000 cm−3around noon, is enough to explain
the discrepancy between the results of two methods in this case.
4 Conclusions
In the current study the ion production rates in a boreal for-est were studied based on two different methods: 1) ex-ternal radiation and radon concentration, 2) ion and
parti-cle concentrations. The average ion production rate
cal-culated from DMPS, APS and BSMA-measurements was
2.6 ion pairs cm−3s−1 and based on external radiation and
radon measurements 4.5 ion pairs cm−3s−1. The method,
based on ion and particle measurements, underestimates the ion production rates especially during the day. There are two main reasons for this underestimation: the particle measure-ments start only from 3 nm, hence the sink of ions during the nucleation events is underestimated. It is also possible that the contribution of ions on the nucleation process leads to an underestimation of the sink. Also other, orographical and methodological effects may lead to some systematic differ-ences between the methods.
Despite some differences, both method gave reasonable estimates on ion production rate. The results will be utilized in our future studies.
Edited by: K. H¨ameri
References
Aalto, P., H¨ameri, K., Becker, E., Weber, R., Salm, J., M¨akel¨a, J. M., Hoell, C., O’Dowd, C. D., Karlsson, H., Hansson, H.-C., V¨akev¨a, M., Koponen, I. K., Buzorius, G., and Kulmala, M.: Physical characterization of aerosol particles during nucleation events, Tellus, 53B, 344–358, 2001.
Bates, D.: Ion-ion recombination in an ambient gas, Adv. At. Mol. Phys., 20, 1–40, 1985.
Chalmers, J.: Atmospheric Electricity, Pergamon Press, Oxford, London, 1967.
Dhanorkar, S. and Kamra, A.: Diurnal variation of ionization rate close to ground., J. Geophys. Res., 99, 18 523–18 526, 1994. Fuchs, N. A.: The mechanics of Aerosol, Pergamon, New York,
1964.
H˜orrak, U., Aalto, P., Salm, J., and Kulmala, M.: Characterization of air ions during nucleation events in boreal forest air, in Report Series in Aerosol Science 59, pp. 196–201, 2003.
H¨ameri, K., V¨akev¨a, M., Hansson, H.-C., and Laaksonen, A.: Hy-groscopic growth of ultrafine ammonium sulphate aerosol mea-sured using an ultrafine tandem differential mobility analyser., J. Geophys. Res., 105, 22 231–22 242, 2000.
H¨ameri, K., V¨akev¨a, M., Aalto, P. P., Kulmala, M., Swietlicki, E., Zhou, J., Seidl, W., Becker, E., and O’Dowd, C. D.: Hygroscopic and CCN properties of aerosol particles in boreal forests, Tellus, 53B, 359–379, 2001.
Hensen, A. and van der Hage, J. C. H.: Parametrization of cosmic radiation at sea level, J. Geophys. Res., 99, 10 693–10 695, 1994. Hoppel, W., Anderson, R., and Willett, J.: The Earths Electrical Environment, chap. Atmospheric electric, pp. 149–165, National Academy Press, Washington, D.C., 1986.
Israel, H.: Atmospheric electricity, Vol 1., Israel Program for Sci-entific Translations, Jerusalem, 1970.
Israel, H.: Atmospheric electricity, Vol. 2, Israel Program for Sci-entific Translations, Jerusalem, 1973.
Jokinen, V. and M¨akel¨a, J. M.: Closed loop arrangement with crit-ical orifice for DMA sheath/excess flow system, J. Aerosol Sci., 28, 643–648, 1997.
Joutsensaari, J. , Vaattovaara, P. , Vesterinen, M. , H¨ameri, K., and Laaksonen, A.: A novel tandem differential mobility analyzer with organic vapor treatment of aerosol particles, Atmos. Chem. Phys., 1, 51–60, 2001,
SRef-ID: 1680-7324/acp/2001-1-51.
Kataoka, T., Yunoki, E., Shimizu, M., Mori, T., Tsukamoto, O., Ohhashi, Y., Sahashi, K., Maitani, T., Miyashita, K., Fujikawa, Y., and Kudo, A.: Diurnal variation in radon concentration and mixing-layer depths, Boundary-Layer Meteorology, 89, 225– 250, 1998.
Kilpatric, W.: An experimental mass-mobility relation for ions in air at atmospheric pressure, in Proc. Annu.Conf. Mass.Spectrosc. 19th., pp. 320–325, 1971.
Kulmala, M., Korhonen, P., Laakso, L., and Pirjola, L.: Nucleation in boreal forest boundary layer, Environ. Chem. Phys., 22, 46– 53, 2000a.
Kulmala, M., Pirjola, L., and M¨akel¨a, J. M.: Stable sulphate clusters as a source of new atmospheric particles, Nature, 404, 66–69, 2000b.
Kulmala, M., H¨ameri, K., Aalto, P., M¨akel¨a, J., Pirjola, L., Nils-son, E. D., Buzorius, G., Rannik, ¨U., Dal Maso, M., Seidl, W., Hoffmann, T., Jansson, R., Hansson, H.-C., O‘Dowd, C., and
Viisanen, Y.: Overview of the international project on biogenic aerosol formation in the boreal forest (BIOFOR), Tellus, 53B, 324–343, 2001.
Kulmala, M., Vehkam¨aki, H., Pet¨aj¨a, T., Dal Maso, M., Lauri, A., Kerminen, V.-M., Birmili, W., and McMurry, P.: Formation and growth rates of ultrafine atmospheric particles: a review of ob-servations, J. Aerosol Sci., 35, 143–176, 2004.
Laakso, L., Anttila, T., Lehtinen, K., Aalto, P., Kulmala, M., H˜orrak, U., Paatero, J., Hanke, M., and Arnold, F.: Kinetic nucle-ation and ions in boreal forest particle formnucle-ation events, Atmos. Chem. Phys. Discuss., 4, 3911–3945, 2004,
SRef-ID: 1680-7375/acpd/2004-4-3911.
Larsen, R.: Global decrease of beryllium-7 in surface air, J. Envi-ron. Radioact., 18, 85–87, 1993.
Liu, S., McAfee, J., and Cicerone, R.: Radon-222 and Tropospheric Vertical Transport, J. Geophys. Res., 89, 7291–7297, 1984. Mochizuki, S., Namiki, Y., Kato, T., Masuda, S., and Sekikawa,
T.: Electrical Processes in Atmospheres, chap. A technique for cont, pp. 204 –210, Dr. Dietrich Steinkopff Verlag, Darmstadt, Germany, 1977.
Mohnen, V.: Electrical Processes in Atmospheres, chap. Formation, nature an, pp. 1–17, Dr. Dietrich Steinkopff Verlag, Darmstadt, Germany, 1977.
Paatero, J., Hatakka, J., and Viisanen, Y.: Concurrent Measure-ments of Airborne Radon-222, Lead-210 and Beryllium-7 at the Pallas-Sodankyl¨a GAW Station, Northern Finland, Tech. rep., Finnish Meteorological Institute, 1998.
Peters, T. M. and Leith, D.: Concentration measurement and count-ing efficiency of the aerodynamic particle sizer 3321, J. Aerosol. Sci., 34, 627–634, 2003.
Porstend¨orfer, J.: Properties and behaviour of radon and thoron and their decay products in the air, J. Aerosol Sci., 25, 219–263, 1994.
Rosen, J., Hofmann, D., and Gringel, W.: Measurements of ion mobility to 30 km, J. Geophys. Res., 90, 5876–5884, 1985. Seinfeld, J. H. and Pandis, S. N.: Atmospheric Chemistry and
Physics: From Air Pollution to Climate Change, Wiley, New York, 1998.
Tammet, H.: Size and mobility of nanometer particles, clusters and ions, J. Aerosol Sci., 26, 459–475, 1995.
Tammet, H.: Reduction of air ion mobility to standard conditions, J. Geophys. Res.-Atmos., 103, 13 933–13 937, 1998.
Vesala, T., Haataja, J., Aalto, P., Altimir, N., Buzorius, G., Garam, E., H¨ameri, K., Ilvesniemi, H., Jokinen, V., Keronen, P., Lahti, T., Markkanen, T., M¨akel¨a, J., Nikinmaa, E., Palmroth, S., and Palv: Long-term field measurements of atmosphere-surface in-teractions in boreal forest combining forest ecology, microme-teorology, aerosol physics and atmospheric chemistry, Trends in Heat, Mass & Momentum Transfer, 4, 17–35, 1998.
Wilkening, M.: Characteristics of atmospheric ions in contrasting environments, J. Geophys. Res., 90, 5933–5935, 1985.
Winklmayr, W., Reischl, G.P.and Lindner, A., and Berner, A.: A new electromobility spectrometer for the measurement of aerosol size distributions in the size range from 1 to 1000˙nm, J. Aerosol Sci., 22, 289–296, 1991.
Yu, F. and Turco, R. P.: Ultrafine aerosol formation via ion-mediated nucleation, Geophys. Res. Lett., 27, 883–886, 2000. Zhou, J.: Hygroscopic properties of atmospheric aerosol particles in
various environments, Ph.D. thesis, University of Lund, Division of Nuclear Physics, Sweden, 2001.