HAL Id: insu-03234776
https://hal-insu.archives-ouvertes.fr/insu-03234776
Submitted on 25 May 2021
HAL is a multi-disciplinary open access
archive for the deposit and dissemination of
sci-entific research documents, whether they are
pub-lished or not. The documents may come from
teaching and research institutions in France or
abroad, or from public or private research centers.
L’archive ouverte pluridisciplinaire HAL, est
destinée au dépôt et à la diffusion de documents
scientifiques de niveau recherche, publiés ou non,
émanant des établissements d’enseignement et de
recherche français ou étrangers, des laboratoires
publics ou privés.
Propagation of Z-mode and whistler-mode emissions
observed by Interball 2 in the nightside auroral region
O Santolik, François Lefeuvre, Michel Parrot, Jean-Louis Rauch
To cite this version:
O Santolik, François Lefeuvre, Michel Parrot, Jean-Louis Rauch.
Propagation of Z-mode and
whistler-mode emissions observed by Interball 2 in the nightside auroral region. Journal of
Geophys-ical Research Space Physics, American GeophysGeophys-ical Union/Wiley, 2001, 106 (A10), pp.21137-21146.
�10.1029/2001JA000038�. �insu-03234776�
JOURNAL OF GEOPHYSICAL RESEARCH, VOL. 106, NO. A10, PAGES 21,137-21,146, OCTOBER 1, 2001
Propagation of Z-mode and whistler-mode emissions
observed
by Interball 2 in the nightside auroral region
O. Santol/k,
•,2 E Lefeuvre,
M. Parrot, and J. L. Rauch
Laboratoire de Physique et Chimie de l'Environnement, Centre National de la Recherche Scientifique Orl6ans, France
Abstract. A case study of VLF (very low frequency) natural emissions propagating at high altitude above the nightside auroral zone is presented. The analysis is based on data of the MEMO experiment on board the Interball 2 spacecraft. In its VLF band the device records waveforms of three magnetic and two electric field components covering a frequency range 1-20 kHz. Several analysis methods are applied in order to obtain the details on the wave propagation and mode structure and to identify possible source regions. We demonstrate that observed band-limited emission consists of Z-mode and whistler-mode waves. Downgoing Z-mode waves are found just above the lower cutoff at the L=0 frequency. A possible source may be connected with the electron cyclotron resonance mechanism taking place in the nightside sector at altitudes above 21,000 km. Upgoing whistler-mode waves with upper cutoff at the local plasma frequency are probably generated by upgoing electrons in the auroral region at altitudes lower than the actual satellite position, i.e., below 18,000 km.
1. Introduction
Three main types of natural wave emissions were so far observed from spacecraft in the high-altitude auroral zone: auroral hiss, Z-mode radiation, and auroral kilometric radi-
ation (AKR) [Gurnett et al., 1983]. Ground-based observa-
tions also show other phenomena occurring at higher fre-
quencies, such as MF bursts [Weatherwax et al., 1994] and
auroral roar emissions [Yoon et al., 2000]. In the present paper we will analyze spacecraft data in the VLF range,
and thus we will be concerned with the whistler-mode
auroral hiss and with the Z-mode radiation. Two basic
generation mechanisms have been proposed for auroral Z-
mode radiation: the Landau resonance with downgoing
auroral electrons [Gurnett et al., 1983] and the loss cone
driven cyclotron maser mechanism similar to that for AKR
[Hewitt et al., 1983; Omidi et al., 1984]. Auroral hiss ob-
served at high altitudes is generally considered to be gener- ated by the Landau resonance with auroral electron beams [Gurnett et al., 1983]. In the past, the emissions of auro- ral hiss and Z-mode radiation were mainly examined from the time-frequency power spectrograms. Waveform data
recorded on board Interball 2 allow more detailed analyses.
1Also at Faculty of Mathematics and Physics, Charles University,
Prague, Czech Republic.
2Now at Department of Physics and Astronomy, University of Iowa,
Iowa City, Iowa, USA.
Copyright 2001 by the American Geophysical Union. Paper number 2001JA000038.
0148-0227/01/2001 JA000038509.00
The MEMO (Mesures Multicomposantes des Ondes) experi-
ment [Lefeuvre et al., 1998] measures the waveforms of sev-
eral components of the electromagnetic field. In its ELF and VLF bands (0.05-1 and 1-20 kHz, respectively) it simulta- neously records the data from three magnetic antennas and
two electric antennas. In its HF band (30-200 kHz) it mea- sures waveforms of three magnetic antennas and one electric
antenna.
In the VLF range we thus dispose of the full vector of the magnetic field and of simultaneously measured data of two electric components. Although several methods exist to get propagation characteristics from both the magnetic and electric field data [e.g., Lefeuvre et al., 1986], they can- not be used in this context, because they suppose a special
orientation of the electric antennas with respect to the am-
bient magnetic field. We have thus recently revised these techniques, and we have newly developed several meth- ods of wave propagation analysis of multicomponent data [Santoh7c et al., 2001]. The aim of these techniques is to ob-
tain (1) wave vector direction, (2) wave number or index of
refraction, and (3) Poynting vector. We suppose that cou- pling of electric antennas to the plasma can be described by a single complex transfer function. This transfer function
can also be estimated from the wave data.
As these techniques will be used in the present paper, their brief description is necessary to interpret the results. It will be given in section 2. As a complementary approach,
we will use the wave distribution function (WDF) analysis
[Storey and Lefeuvre, 1979], which will allow us to distin- guish different wave modes. Section 3 will present the re- sults of the analysis for a selected case of VLF emissions in the nightside auroral region. Theoretical analysis of wave
21,138 SANTOL•K ET AL.: VLF EMISSIONS IN THE NIGHTSIDE AURORAL ZONE
propagation
parameters
for this
case
and
processing
of Sim-
ulated data will be described in section 4. Section 5 will then
show
the
results
of the
WDF analysis.
Finally,
section
6 will
contain a discussion and brief conclusions.
2. Analysis Methods
2.1. Plane-Wave Analysis Using the Magnetic Field
Vector Data
2.1.1. Incomplete wave vector direction. The plane of polarization of the magnetic field is always perpendicular to the wave vector direction. For a given magnetic field data we have two mutually antiparallel directions which agree with this condition. We can thus only estimate an incom- plete wave vector direction with the sign ambiguity. We will use the method of Means [ 1972]. As the propagation proper- ties of the plasma medium are symmetric with respect to the ambient magnetic field (Bo), the results are best represented in a spherical system by two angleS, 0 (deviation from Bo)
and •b (azimuth
around
Bo having
the zero
value
in the di-
rection of increasing magnetic latitude). The method gives an ambiguous result with 0 _• 90 ø, which may also indicate propagation in the antiparallel direction with 0 • -180ø-0 and •b • - 180 ø +•b.
2.1.2. Sense of polarization. We will also estimate a normalized parameter C'B defining the sense of circular or elliptical polarization [Santol& et al., 2001]. The polariza- tion is examined in the plane perpendicular to Bo. Positive values of C'B correspond to the right-hand polarization (i.e., in the sense of the electron cyclotron motion), and negative values mean left-hand-polarized waves. The absolute value
gives the statistical level of confidence, values above 3 or
below -3 generally indicating a high confidence level.
The first
result
is the ratio
"/IZl, where
IZl is the abso-
lute value
of the complex
transfer
function
describing
the
coupling
of electric
antennas
to the plasma.
Supposing
a
known
transfer
function
(or assuming
it is unity),
we can
get
the index of refraction n and subsequently the wave num-
ber k. On the other hand, with a known theoretical value of the refractive index, the transfer function can be estimated.
However, without actually measuring Z by additional elec- tronics connected to the electric antennas, i t is often difficult
to separate
the transfer
function
from
n. In the present
paper
we will always
show
the results
for the ratio
,qIZI, and
we
will compare its values to the theoretical refractive index.
The method
also
gives
us a phase
shift
•0. For a given
n,
•I'0
directly
reflects
the
phase
shift
due
to the complex
trans-
fer function, Z - IZI exp(i•0). When, as it is the case in
the present
paper,
n is originally
estimated
from
the mag-
netic
field data
without
knowing
its correct
sign
(see
section
2.1.1),
•0 can
be used
to resolve
that
ambiguity.
Supposing
that the phase shift induced by Z is smaller than 90 ø, •0 de- fines the actual hemisphere of n. •0 values between -90 ø and +90 ø correspond to 0 _< 90 ø, and •0 values below -90 ø or above +90 ø correspond to 0 > 90 ø.
2.2.2.
Poynting
vector.
Faraday's
law
in the
frequency
domain can also be used to reconstruct the electric field vec-
tor from the magnetic field vector data and two electric com- ponents. Since both real and imaginary parts of E and B
are mutually
perpendicular
vectors
in (1), we can directly
use
this property
to calculate
the missing
third
electric
field
component [Santol& et al., 2001]. In the present paper we use such completed information about the wave electric and magnetic fields to obtain the Poynting vector. We character- ize it by the two following parameters' (1) angle deviation 0•, of the Poynting vector from Bo and (2) parameter D0 de-
2.1.3.
Degree
of polarization.
The
presence
of a sin- fined
as
the
component
of the
Poynting
vector
which
is par-
gle
plane
wave
will
be
tested
by
an
estimator
P of the
degree
allel
to Bo, normalized
by
the
statistical
standard
deviation
of
polarization
obtained
by
the
eigenanalysis
of
the
magnetic
of its
estimate.
We
use
here
all three
reconstructed
electric
spectral matrix, as defined by Lefeuvre et al. [1992]. A valueabove •0.8 means that there is no substantial discrepancy between the measured wave magnetic field and the hypothe- sis of a single plane wave.
2.2. Plane-Wave Analysis Using the Magnetic Field Vector Data and Two Electric Signals
2.2.1. Index of refraction. Having the magnetic field vector data and two electric signals, we can use Faraday's law in the frequency domain,
n (n x E)- cB, (1) where E and B are the complex amplitudes of the wave
electric
and magnetic
field, respectively,
n is the index
of
refraction
n = k c/w, k is the wave
number,
c is the speed
of light,
co
is the angular
frequency,
and n is a unit vector
defining the wave vector direction n = k/k. Equation 1 can
be used
to simultaneously
estimate
the wave
number
and
the
hemisphere of propagation. The procedure is based on the
transformation
of the three-component
magnetic
field data
to a Cartesian frame connected with the electric antennas
[Santol& et al., 2001].
field components unlike two similar methods also described by Santol& et al. [2001], and hence no principal restrictions
of validity
apply
to obtained
Do values.
Do > 0 corresponds
to 0p _< 90 ø, and Do < 0 corresponds to 0p > 90 ø. The ab- solute value of Do indicates the relative level of confidence, values above 3 or below -3 indicating a high statistical con-
fidence.
2.3. Wave Distribution Function Analysis
All the above methods provide us with parameters de- scribing a plane wave, like wave vector, Poynting vector, or refractive index. They thus inherently suppose a very sim- ple propagation model consisting of a single plane wave in a single wave mode. We will show that even if this is not exactly the case, the methods give reasonable average re-
sults.
However,
sometimes
a more
complex
description
of
observed wave fields is necessary. This is the case when the waves simultane•ously propagate with two or more wave
vector directions, or if several wave modes are simultane-
ously present. The WDF then may serve to describe the wave propagation [Storey and Lefeuvre, 1979]. The WDF analysis allows us to consider an arbitrary distribution of
SANTOL•K ET AL.' VLF EMISSIONS IN THE NIGHTSIDE AURORAL ZONE 21,139
wave energy density over the different wave vector direc- respect to Bo. In the frequency band 3.5 - 5 kHz the es- tions and wave modes. Here we estimate the WDF by the op- timates by the method of Means [ 1972] give wave vectors timization method described as "model of discrete regions" with 0 growing from m45 ø up to m80 ø. In the same band by Santoh7c and Parrot [2000]. In order to maintain area- the Poynting vector is also found with a growing inclination sonable number of optimized parameters, we estimate the from Bo but always at angles lower by 10 ø- 20 ø comparing WDF for 0 _< 90 ø in two cold-plasma wave modes, and we to the wave vector direction. The estimate of Db and the es- use the magnetic field data only. This implies that we cannot timate of (I,b clearly indicate downgoing propagation in this distinguish between any two antiparallel wave vector direc- frequency interval, and the value of n/IZI grows from •0.1 tions, as can be done with the plane-wave methods described
in section 2.2. The two approaches (plane-wave and WDF analysis) are thus complementary in the present paper.
3. Analysis of Z-Mode and Whistler-Mode
VLF Emissions
On November 9, 1996, between 2300 and 2340 UT the MEMO device recorded intense natural emissions in
the VLF band. The multicomponent waveform data were recorded in short snapshots of 0.09 s, separated by m65-s data gaps. To select the snapshot for a detailed analysis we have used continuously recorded data of the NVK-ONCH device [Mogilevski et al., 1998] on board Interball 2. The
to 0.2.
In the band 6 - 10 kHz the method of Means [1972] again gives 0 between 50 ø and 80 ø, but a decreasing trend can be noted below 9.5 kHz. The Poynting vector is here found growing from •60 ø (downgoing propagation) up to 90 ø- 100 ø (upgoing propagation) near 10 kHz. This is consistent with estimates of D•, which indicate upgoing waves near
10 kHz, but at a lower level of confidence. Values of
clearly show upcoming propagation for 6 - 8 kHz, downgo- ing waves between 7 and 9 kHz, and again upcoming prop- agation above 9 kHz. The values of n/IZI fluctuate around 0.1 at frequencies between 6 and 10 kHz.
The results of the propagation analysis thus agree with the hypothesis, explaining the observed cutoffs and polarization spectrogram shown in Plate 1 was created using a waveform reversal by the presence of downgoing Z-mode waves in the measurement of an electric component between 2314 and
2326 UT when the satellite was located above the northern
nightside auroral region. During this interval we can see band-limited emissions with both lower and upper charac- teristic cutoffs. The m 1-min periodic variations of the upper and lower cutoffs and of the wave intensity are connected to the spacecraft spin.
Figure 1 presents some results of a detailed multicompo- nent analysis of one MEMO snapshot, recorded when the maximum wave intensity was observed. The data were mea-
sured from 2320:10 LIT, and at this moment the satellite was
at an invariant latitude of 73.8 ø, on 0310 MLT, and at an altitude of 18,038 km.
Both distinct cutoffs are seen in the electric spectrum in Figure lb. They can also be distinguished in the magnetic spectrum in Figure l a. Note, however, that near the upper cutoff the level of the magnetic field fluctuations decreases very close to the level of the background noise. Examina- tion of the magnetic field polarization reveals prevailing left- hand elliptic polarization in the frequency band 3.5 - 5 kHz and prevailing right-hand elliptic polarization in the fre- quency band 6 - 10 kHz (Figure lc). This may be explained by the presence of left-hand-polarized Z-mode waves in the lower-frequency band and right-hand whistler-mode waves in the higher-frequency band. Supposing that the plasma density decreases with altitude and that the plasma frequency is lower than the gyrofrequency, the observed cutoffs may also be explained by the presence of these wave modes [Lefeuvre et al., 1998]. We obtain the lower cutoff if the left-hand-polarized Z-mode waves are downgoing, and, sim- ilarly, the upper cutoff can be explained by the principal res- onance of whistler mode if the waves in the higher-frequency band are upgoing (see also section 4).
Propagation analysis is needed to verify this hypothesis. Figure l e shows that waves propagate at large angles with
lower-frequency band and upcoming whistler-mode waves in the higher-frequency band.
4. Comparison With Theoretical Properties of
Wave Propagation
To further check this hypothesis, we have calculated the- oretical properties of both Z mode and whistler mode us- ing the cold-plasma approximation. We have used an ex- perimentally determined electron gyrofrequency fg=27 kHz. The plasma frequency f•,=10.5 kHz was estimated from the observed upper cutoff supposing that this cutoff is due to the principal resonance of upcoming whistler-mode waves [Persoon et al., 1988]. With these plasma parameters we obtain a theoretical prediction for the lower cutoff of the downgoing Z-mode waves at a frequency of 3.6 kHz. At this frequency the L parameter of Stix [ 1992] becomes zero, and the left-hand-polarized Z mode is cut off. This is shown in Plate 2a while the above discussed theoretical polariza- tion properties of the Z-mode and whistler-mode waves are
shown in Plates 2b and 2e. The theoretical value of the Z-mode lower cutoff is thus found near the lower cutoff re-
ally observed in the frequency spectra. This provides further support for our interpretation.
The behavior of the propagation parameters obtained from multicomponent data in the frequency band 3.6 - 5 kHz also agrees with the theoretical properties of the Z mode. The an- gular difference of 10 ø - 20 ø between the wave vector and the Poynting vector (Figure le) is well predicted by the the- ory (Plate 2c and Figures 2 and 3). The theoretically pre- dicted refractive index is below 0.73 in this frequency band, which is also roughly comparable to the observed values of
21,140
SANTOL•K
ET AL.' VLF EMISSIONS
IN THE NIGHTSIDE
AURORAL
ZONE
I I I t i I o( • ZH •_u• •AU• ) •c•
o oo (.o • od( ZH>I ) Aouanbe.J=!
SANTOL•K ET AL.' VLF EMISSIONS IN THE NIGHTSIDE AURORAL ZONE 21,141
(a) Z mode (b) Z mode
l'l•x104
•
1'2x10⁴
•' l.OxlO 4 • •' 1.OxlO 4• 6'øx1ø3
i • 8'Ox103
• 6.0xlo
3
i
• 6,0xlo
3
•
o
a
J
•- 4.0x1 • •. 4.0xlO 3' I•.0x103 •,OxlO 3 0 20 40 80 ao 0 20 40 80 80 8 (degrees) 0 (degrees) I 0.0 0.2 0.4 0.8 0.8 1.0 1.2 -100 0 100Index of refraction Cross-spectrum Im Bx,By (arb.u.)
-5O 0 8 a (degrees) I 5O (d) 1,2xlO 4 ,-, , t.Oxl 0'1. >, 6.0xlO 3 • 6.0xlO 3 • 4.0xlO 3 2.0xlO 3 0 W and O modes 20 40 80 80 0 (degrees)
(e) W and 0 modes
I 1'2x10⁴
u• 8.0x103
=•
0 3
= 6.0xl •- 03 r• 4.0xl • a,OxlO 3 0 20 40 80 80 8 (degrees) (f) W and O modes 1.2xlO 4 - •' 1.OxlO 4• 8.0x10³
• 6.0xlO 3 g , •., 4.0xio 3 2.0xlO 3 o 20 40 6o 8 (degrees) 6O 0 I 2 3 4 5 - 100 0 I00 -50 0 50Index of refracLion Cross-spectrum lm Bx. By (arb.u.) Oa (degrees)
Plate 2• (a-f) Theoretical characteristics of wave propagation supposing floe - 10.5 kHz. Three selected parameters are color-coded as a function of 0 and frequency. Z mode is on the top (Plates 2a, 2b, and 2c); whistler and ordinary modes are on the bottom (Plates 2d, 2e, and 2t). Plates 2a and 2d show the refractive index. Plates 2b and 2e represent the imaginary part of the cross spectrum between two magnetic components in the plane perpendicular to B0. Negative values correspond to the left-hand polarization; right-hand polarization is expressed by positive values. Plates 2c and 2f show the inclination of the Poynting vector from B0.
(a) Z mode, 3.8 kHz (b) W mode, 3.8 kHz (c) Z mode, 9.0 kHz (d) W mode, 9.0 kHz
•. \ ... ?::. :.. ... ... /: '. -' ... ; o x. .... ::: .... .•...:: ... / ... "'.. / i ".. ..'"' ... 0.0 0.2 0.4 0.6 0.8 1.0 WDF (orb. u.)
Plate 3. Results of simultaneous 6ptimization of the WDF for both Z-mode (Plates 3a and 3c) and whistler mode (Plates 3b and 3d). The frequencies are 3.8 kHz (Plates 3a-3b) and 9.0 kHz (Plates 3c-3d). In all panels the WDF is plotted using the same color scale, shown on the bottom.
21,142 SANTOL[K ET AL.' VLF EMISSIONS IN THE NIGHTSIDE AURORAL ZONE (a) (b) (c) (d) (e) (f) (g) (h)
MEMO INTERBALL 2 November 9, 1996 2320:10 UT
N 0_ 9 ß -r- 1 v .t •o-•O
: : i : : • : : : i : : : i : : : i : ; : i , ,
10
o_'2
3 0-4 1 •o-S ; ; [ : : .ø
-5 (L) ...1.o
0.5
0.0 ; ; • : : : : : : , : : : • : : : • : : : • : :150
•
...
Poynting
vector
(0ø-180
ø)
•
/ wave
vector
(0ø-90
ø)
10050 ...
0 ; ; ; ; ; ; ; • ; : i : : : i : : •o ß1.00
0.10 •- • --
0.01180
90•_•
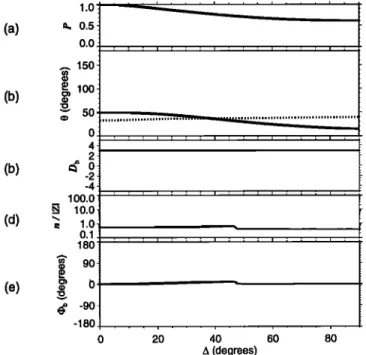
-90 -•8o ... • ... 4 6 8 10 12 14 frequency (kHz)Figure 1. (a-h) Analysis of Z-mode and whistler-mode VLF emissions in the frequency interval 2.5- 15 kHz. (a) Sum of the three magnetic autopower spectra. (b) Sum of the two electric autopower spectra. (c) Sense of polarization. (d) Degree of polarization. (e) Deviation 0 of the wave vector direction from the ambient magnetic field B0 by the method of Means [1972] (solid line) and the same angle for the Poynting vector (dotted line). (f) Estimate Do of the parallel
component of the Poynting vector normalized by its stan-
dard deviation. (g) Ratio of the wave refractive index and the transfer function. (h) Phase shift •b from the Faraday's law. The area filled with oblique parallel lines shows the frequency interval where the polarization changes from the left-hand (L) to the right-hand (R) sense.
quency
interval
3.6 - 10 kHz, we observe
a 9olarization
de-
gree which often is below 0.8 (Figure 1 d). This suggests that the original assumption on the presence of a single plane wave can be violated. In order to verify the results when the plane wave assumption is not valid, we have simulated Z-mode waves at 4.5 kHz using the WDF techniques.
First, we have supposed that the waves propagate in a divergent beam of wave vectors, described as a Gaus-
sian peak on the WDF (Model of Gaussian peaks of
Santoh7c and Parrot [2000]). The beam is centered at a di-
rection defined by 00=50 ø and q50=110 ø and has an angular width A. For A approaching zero the beam reduces to a sin- gle plane wave at a given 00 and q5o. For large A the waves propagate simultaneously at all downgoing directions, but no wave energy penetrates to the hemisphere of upgoing waves.
The data have been simulated for the same configuration of
antennas as in the real case presented in Figure 1. The re- sults for A between 0 ø and 90 ø are shown in Figure 2. We can see that nearly all the parameters are not influenced by the violation of the plane wave hypothesis and that they al- ways indicate the right hemisphere. Note, however, that the angle 0 estimated by the method of Means [1972] rapidly decreases with the growing width of the peak. Note also that the degree of polarization decreases for a wide peak, as can be expected when the plane wave hypothesis is violated
[Pinfon et al., 1992].
Another situation which may invalidate the results is the simultaneous propagation of upcoming and downgoing waves. We expect that the methods should identify the hemi- sphere of propagation where we place more wave energy. This is verified in Figure 3. The analysis is done for two sim- ulated plane waves, simultaneously propagating in mutually antiparallel directions at 0• =50 ø, qS• = 110 ø, and 02= 130 ø, q52=290 ø, respectively. The percentage (iv) of energy density placed into each of the two waves is gradually changed from purely downgoing wave (p=0%) to purely upcoming wave (p=100%). The simulated configuration of antennas is again the same as in the real case from Figure 1. The main result is that the propagation characteristics behave as expected. The estimated direction of the Poynting vector in Figure 3a re- verses to the antiparallel direction just at the moment when p passes through 50%. This, obviously, is not the case of the results of the method of Means [1972], which always gives 0 _< 90 ø. The estimate of Db (Figure 3b) changes the sign when p is 50%. The phase •I,• (Figure 3d) also always in- dicates the right hemisphere of prevailing propagation. The wave refractive index (Figure 3c) is substantially overesti- mated when the plane wave hypothesis is clearly invalid, i.e., when the wave energy placed to both hemispheres becomes comparable. Note that the exactly antiparallel plane waves were chosen for the sake of simplicity. This choice allowed us to avoid effects on the wave magnetic field: Both am- plitudes and relative phases of the magnetic components are the same for the two antiparallel plane waves and remain un- changed when the two waves propagate simultaneously. As a consequence, the degree of polarization, calculated without taking into account the wave electric field, is always unity even when the waves simultaneously propagate in the two oposite directions. If we consider the case when the two plane waves are not antiparallel, the degree of polarization will be less than unity, as in the simulation shown in Fig- ure 2. Also, effects connected to a different group velocity of the two waves can take place, resulting in a switch be-
tween detected directions at a different ratio of energy den-
sity placed into each of the two waves.
SANTOLiK ET AL.: VLF EMISSIONS IN THE NIGHTSIDE AURORAL ZONE 21,143 (a) (b) (b) (d) (e) 1.0 0.5 0.0 • 150 E 100 •' 50 0 4- • -2 -4 100.0 10.0 1.0 0.1 180 90 0 -9o -180 i i i i i i ß . ; ; ; i ; ; ; i ; i : i i ; ; I
' ';o' '
8'0
• (degrees)verifications indicate that the observed differences must ei-
ther be connected to wrong assumptions of the theoretical analysis or to violation of the underlying hypothesis of the
plane-wave methods.
5. WDF Analysis
In section 4 we have shown that some violations of the
plane-wave hypothesis do not substantially disturb the re- sulting wave vector. However, a possible multimodal struc- ture of the emission cannot be described by these plane-wave methods. This may be a possible reason for the observed dis- crepancy between the observed wavevector directions and the theoretical properties of the whistler mode in the higher- frequency band. We have thus allowed the WDF optimiza- tion procedure to distribute the wave energy between the two possible modes in order to best satisfy the constraints im- posed by the observed data. The results are shown in Plates 3a-3d for frequencies of 3.8 and 9 kHz, respectively, with the analysis bandwidth of 0.3 kHz in both cases.
; ; ; i ; ; ; i i ; ; i i ; ; i ; ;
; ; ; i i i ; i ; ; i i ; i ; i i ;
0
20
40
6'0
8'0
P%
100
ponent
of the electric
field,
and
the simulation
shows
that
Figure 3. (a-d) Analysis of simulated Z-mode waves simul-these
methods
may
give
misleading
results,
depending
on taneously
propagating
in two
antiparallel
directions
at 4.5
mutual
orientation
of the
wave
vector
with
respect
to the
an- kHz. Results
are
plotted
as
a function
of the
percentage
p of
tennas.
The method
that
uses
the reconstructed
electric
field the energy
density
of the upcoming
wave. The parameters
vector
(Figure
lf), however,
gives
correct
results.
These
shown
are
the
same
as
those
in Figures
le-lh.
cone
which
rapidly
closes
when
we approach
the
principal
resonance
at f•,. For
example,
at a frequency
of 6 kHz the
resonance
angle
(0R)
is 53
ø, at 9 kHz
it decreases
to 29
ø, and
it goes
to zero
at f•,. Naturally,
the
wave
vector
cannot
be
in-
• 150
elined
from
B0 by angles
larger
than
0R. This
is however,
'•
• 100the case
of results
of the method
of Means
[ 1972]
presented
(a)
c,
in Figure
l e (recall
that
the
observed
0 values
are
between
;' so
50 ø and 80 ø in this frequency
band). The Poynting
vector
0
may
be
theoretically
found
at large
angles
for
the
whistler-
4
mode
waves
in this
frequency
range
(up
to 60
ø at
9 kHz),
but (b)
zf .02
the observed values between 60 ø and 100 ø are again incon- -4
100.0
sistent with the theory. • 10.0
We have
verified
that
the observed
discrepancies
are
not (c)
•
1.0
0.1
artificially
introduced
by our analysis
procedures;
these
180
methods
well reproduce
the theoretical
predictions
when
• 00
used
with simulated
data
(not shown).
Note in this context
-•
en0that
simple
methods
to
estimate
the
parallel
component
of (d) •
the
wave
vector
and
Poynting
vector
from
only
one
or
two
4' -00
electric
components
[SantohTc
et
al.,
2001]
cannot
be
used
-180
i n the
present
case.
The
waves
have
a large
parallel
corn-
Figure 2. (a-e) Analysis of the influence of the plane wave
hypothesis
for
Z mode
at 4.5
kHz.
The
simulated
results
are Each
of Plates
3a-3d
represents
a WDF
in a polar
diagram,
a function
of the width
A of a Gaussian
peak
on the wave where
the distribution
of the wave
energy
density
is plot-
distribution function for the VLF case on November 9, 1996. ted with respect to the polar angle 0 and the angle azimuth
The parameters
shown
are the same
as those
in Figures
l d- 4). Recall
that the WDFs are obtained
from the magnetic
lh.
field
only,
and
hence
we cannot
separate
WDF values
from
the two mutually antiparallel directions. Following the in- dications, obtained by the plane-wave methods that involve
case
of November
9, 1996,
right-hand
elliptic
polarization
both
magnetic
and
electric
field,
we choose
to represent
the
of the
wave
magnetic
field
suggests
the
presence
of whistler-
Z-mode
waves
in the hemisphere
where
0 _<
90
ø and
the
mode
waves.
Theoretical
parameters
of this
mode
are
shown whistler-mode
waves
in the hemisphere
of 0 > 90 ø.
in Plates
2d-2f. In the frequency
band
below
f•, - 10.5 An important
result
of this
analysis
is the
ratio
of integral
21,144 SANTOL[K ET AL.: VLF EMISSIONS IN THE NIGHTSIDE AURORAL ZONE
whistler
mode
at 3.8 kHz, whereas
in the higher-frequency
band
at 9 kHz we observe
a majority
of the whistler
mode
(81%) and a smaller fraction of the Z mode (19%). These wave energy ratios are not a priori imposed but come out of
the
WDF optimization
procedure
and
thus
are
defined
by the
data.
For the whistler-mode
waves
the
peaks
of wave
energy
density are always concentrated near the resonance cone.
Their
angle
azimuth
indicates
propagation
near
the
plane
of
the local
magnetic
meridian,
with
wave
vectors
pointing
to-
ward
higher
L shells
provided
that
the waves
are
upcoming.
Note
that
this
WDF analysis
is based
on the
cold-plasma
the-
ory, and no whistler-mode energy density can be obtained
outside the resonance cone.
The peak of Z-mode radiation is found near 0 =40 ø at 3.8
kHz. This
well agrees
with
the
plane-wave
results
(Figure
1)
at that
frequency.
As the waves
are downgoing,
the values
of
the angle
azimuth
q• where
the peak
is found
correspond
to
waves propagating perpendicularly with respect to the local
magnetic
meridian,
from the nightside
sector
(lower
MLT).
The peak WDF values are nearly the same for both modes -t this frequency. However, the peak of the Z-mode waves
is much
larger
in effective
area,
resulting
in a much
larger
integral
energy
density.
At 9 kHz the Z-mode
waves
are also
spread over a large interval of wave vector directions. Al- though the WDF values are small, the integration gives a nonnegligible fraction of Z-mode waves. Besides a possible contamination by a background noise mentioned in section 3, the presence of Z-mode waves might be another possi- ble reason of the discrepancy between 0 values obtained by plane-wave methods at this frequency and the whistler-mode theory. As the residual Z-mode waves carry a large magnetic component, their presence at large 0 may perturb the results
of the method of Means [ 1972] and the determination of the Poynting vector.
6. Discussion
and Summary
In the lower-frequency band between 3.6 and 5 kHz we
clearly
see the downgoing
Z-mode
waves
(as supposed
by
Lefeuvre et al. [1998]), and theoretical predictions of di.f- ferent wave properties are consistent with the observations. This provides strong evidence that the Z-mode emissions come from higher altitudes. This scenario must be com- pleted by the reflection of the Z-mode waves above the L=0 cutoff frequency. As the waves do not propagate parallel to B0, we may not necessarily observe a large fraction of the reflected waves at the actual satellite position. The angle az- imuth q• obtained by the method of Means [1972] indicates that the reflected waves further propagate toward the morn-
ing sector.
Following
Gurnett
et al. [1983],
the gen,
gration
mecha-
nism may be connected with a direct resonant interaction with downgoing electron beams. Since the Z-mode res- onance cone appears only at frequencies between the lo-
cal electron
gyrofrequency
(fge) and the upper
hybrid
fre-
quency, an estimate of the altitude of such a source re-
gion is m36,000 km, supposing it is at the same invari- ant latitude as the observation point and assuming that the
upper
hybrid
frequency
is close
to fge. Similar
altitudes
are required if the electron cyclotron resonance mechanism
[Tsurutani and Lakhina, 1997] is considered. The calcula-
tions of Hewitt et al. [ 1983] show the possibility of Z-mode generation above fge by upgoing loss cone electrons. The unstable wave vectors are directed nearly perpendicular to B0 and upward, but, owing to properties of the Z mode at these frequencies, the corresponding group velocities are found to be directed obliquely downward. The group ve- locity, however, tends to be perpendicular to B0 when the wave propagates down to the altitude where its frequency approaches to fge. This mechanism thus encounters dif- ficulties to explain propagation to lower altitudes. Taking into account realistic particle distributions and relativistic ef- fects, the study of Omidi et al. [ 1984] shows that the gener- ation can also take place slightly below fge- However, the downward propagation near the L=0 cutoff may again be
hardly explained by this latter mechanism, because the un- stable wave vectors correspond to a horizontal propagation perpendicular to B0, as found by the ray-tracing study by
Menietti and Lin [1986].
On the other hand, ray tracing for the same mode but at higher frequencies done by Horne [1995] shows that a Z- mode wave may propagate downward quite near to the re- flection point above the L=0 cutoff. This study is based on the generation mechanism of Wu et al. [1989], which predicts the maximum growth rate at frequencies around 0.8 fg with downward directed wave vectors. This would in our case lead to a distant source region at an altitude
of m33,000 km if the invariant latitude is similar as for
the observation point (74ø). If the source is at lower lat- itudes, its altitude would be lower, and it would go down to m21,000 km if the source is at the equator. This ex- treme possibility is, however, not very likely, because in that case we should observe poleward propagation. As our re- suits rather indicate that the waves propagate toward higher MLT, without any prevailing poleward component, we sup- pose that the source region is on the nightside at higher lat- itudes. A ray-tracing study would be necessary to obtain more quantitative results. A' weak point of this hypothe- sis is that the theory of Wu et al. [1989] was designed to explain ground-based observations of waves at frequencies above 150 kHz [Benson et al., 1988], which are supposed to be generated in the auroral region at altitudes below 6500 km [Ziebell et al., 1991]. Further analysis is needed to exam- ine the critical parameters of this theory (ratio of the elec- tron gyrofrequency to the plasma frequency, relative abun- dance of energetic electrons, their characteristic energy, and the shape of their distribution function) at altitudes above 18,000 km. As the local plasma frequency is above the frequency of observed Z-mode waves, we must also take into account the possibility of generation by an unknown mechanism near the local plasma frequency suggested by
Hashimoto and Calvert [1990]. In that case the source re-
gion would also be above the observation point, suppos- ing that the plasma density decreases with the altitude.
Hashimoto and Calvert [1990] and Calvert and Hashimoto
SANTOL•K ET AL.' VLF EMISSIONS IN THE NIGHTSIDE AURORAL ZONE 21,145
consistently with their ray-tracing study. This does not agree
with our results.
The pronounced upper cutoff seen in the electric field spectra is well explained provided that upgoing whistler waves carry the majority of wave power at those frequencies. The cutoff is then local, and it is situated at the plasma fre- quency [Persoon et al., 1988]. With this assumption we ob- tain a good agreement between theoretically predicted lower cutoff of downgoing Z-mode radiation and the observed spectrum. The power spectra thus allow a self-consistent interpretation. However, in the higher-frequency band be- tween 6 and 10 kHz the interpretation in terms of the wave propagation is much less straightforward. The presence of a nonnegligible fraction of Z-mode waves may explain the dis- crepancy between 0 values obtained by plane-wave analysis and the whistler-mode theory. Another possible reason could be that near the upper cutoff at 10.5 kHz the wave magnetic
field (Figure
l a) becomes
weak, and the background
noise
may disturb
the analysis.
This is consistent
with theoretical
results showing that approaching the principal resonance of the whistler mode at the local plasma frequency, the wave magnetic field of whistler-mode waves weakens. A possi- ble explanation could also be connected to modifications of the dispersion relation induced by a hot-plasma component. These effects are expected to be stronger near (or outside) the cold-plasma resonance cone where the phase velocity de- creases, but their detailed study is beyond the scope of this
paper.
Another problem is that the whistler-mode wave should prevail in the whole higher-frequency band 6-10 kHz, and the Poynting vector is directed upward only in a much nar- rower frequency interval above 9 kHz and below the upper cutoff (Figure le). Interpretation of the Poynting vector, however, must account for the difference of the group ve- locity of the whistler- and Z-mode waves. As the whistler- mode waves are found near the resonance cone, their group velocity is significantly lower than that of the Z-mode waves. This is obtained from the results of the cold-plasma theory (not shown) similar to those presented in Plate 2. When the two modes propagate simultaneously, the Poynting flux of the Z-mode waves can be higher, even if the whistler- mode waves have a higher energy density. To back up these considerations quantitatively, we have calculated theoretical fields of simultaneously propagating upgoing whistler-mode wave and downgoing Z-mode wave at a frequency of 9 kHz. Propagation of the two modes was simplified to two antipar- allel plane waves, both deviated by 25 ø from B0. The rel- ative energy density contained in each mode was gradually changed, and the Poynting vector was calculated by the same method as that in Figure l e. As expected, the total Poynting flux was downward even if the energy density of the upgo- ing whistler-mode wave was larger than that of the Z-mode wave. Upward flux was found only when the relative frac-
tion of the Z mode decreased below 15%. This is close to
the ratio of energy density of the two modes found at 9 kHz by the WDF analysis. Simultaneous presence of both modes found by that method thus again can help to explain the ob- servations.
Our analysis
provides
us with strong
indications
that be-
low the upper
cutoff
the wave
field
is in majority
composed
of upgoing
whistler-mode
waves
propagating
in the vicinity
of the resonance
cone
near
the plane
of the local magnetic
meridian.
The source
of upgoing
whistler
waves
is prob-
ably
located
in the auroral
region
at lower
altitudes.
The
waves
can
be then
generated
by Landau
resonance
with the
upgoing
low-energy
electron
beams
near
the
whistler-mode
resonance
cone
at altitudes
above
•4500 km [Gurnett
et al.,
1983].
We cannot,
however,
completely
exclude
the
possi-
bility
that
a part
of the
observed
whistler-mode
waves
arises
from mode conversion at the local plasma frequency from
the downward
propagating
Z-mode
radiation.
In that
case
the Z-mode
radiation
in the lower-frequency
band would
represent
waves
remaining
in the
original
mode,
probably
because
they
could
not reach
the radio
window
[Budden,
1985]
where
the conversion
to the
whistler
mode
may
take
place.
This
mechanism
cannot,
however,
be the
only
one
acting,
because
it would
have
difficulties
in explaining
the
observed upper cutoff.
On the basis
of the above
presented
wave propagation
analysis of a broadband VLF emission observed in the night- side auroral region, we can summarize our interpretation as
follows:
1. A complex system of VLF emissions observed on November 9, 1996, consists of downgoing Z-mode waves above the local L=0 cutoff and upgoing whistler-mode emis- sions below the principal resonance at the local plasma fre- quency. The WDF analysis shows 90% of Z-mode waves
above the lower cutoff and 81% of whistler-mode waves be-
low the upper cutoff.
2. The Z-mode waves come from regions above the obser- vation point (altitude of 18,000 km) and from the nightside
sector (MLT lower than 0310). The waves can be gener-
ated by a resonant interaction (Landau or electron cyclotron) with energetic electrons at a source altitude above 21,000- 33,000 km.
3. The whistler-mode waves propagate from altitudes below the satellite position, and they propagate near the plane of the local magnetic meridian. The waves proba- bly originate from the auroral hiss emissions [Gurnett et al.,
1983] generated by Landau resonance with upgoing electron
beams.
Acknowledgments. We thank C. B6ghin and L. R. O. Storey
for helpful discussions on the behavior of electric antennas, and J.-Y. Brochot, who helped us with the processing of the MEMO data. This work was supported by the French-Czech program Bar-
rande 98039/98055 and by the international program of scientific
cooperation (PICS) 469 with the joint Czech Grant Agency grant
205/01/1064. O. Santolfk acknowledges the support of the Czech
Grant Agency grant 205/00/1686.
Janet G. Luhmann thanks Gurbax S. Lakhina and another referee
for their assistance in evaluating this paper. References
Benson, R. F., M.D. Desch, R. D. Hunsucker, and G. J. Romick, Ground-level detection of low- and medium-frequency auroral radio emissions, J. Geophys. Res., 93, 277-283, 1988.
21,146 SANTOL[K ET AL.' VLF EMISSIONS IN THE NIGHTSIDE AURORAL ZONE
Press, New York, 1985.
Calvert, W., and K. Hashimoto, The magnetoionic modes and prop-
agation properties of auroral radio emissions, J. Geophys. Res., 95, 3943-3957, 1990.
Gumett, D.A., S.D. Shawhan, and R.R. Shaw, Auroral hiss, Z mode
radiation, and auroral kilometric radiation in the polar magneto-
slYhere: DE 1 observations, J. Geophys. Res., 88, 329-340, 1983. Hashimoto, K., and W. Calvert, Observation of the Z mode with
DE1 and its analysis by three dimensional ray tracing, J. Geo- phys. Res., 95, 3933-3942, 1990.
Hewitt, R. G., D. B. Melrose, and G. A. Dulk, Cyclotron maser emission of auroral Z mode radiation, J. Geophys. Res., 88,
10,065-10,071, 1983.
Home, R. B., Propagation tq the ground at high latitudes of auroral
radio noise below the electron gyrofrequency, J. Geophys. Res.,
100, 14,637-14,645, 1995.
Lefeuvre, F., Y. Marouan, M. Parrot, and J.L. Rauch, Rapid deter- mination of the sense of polarization and propagation for ran- dom electromagnetic wave fields: Application to GEOS1 and AUREOL3 data, Ann. Geophys., 4, 457-468, 1986. (Correction, Ann. Geophys., 5, 251, 1987.)
Lefeuvre, E, J.L. Rauch, D. Lagoutte, J.J. Berthelier, and J.C.
Pinqon, J. L., Y. Marouan, and E Lefeuvre, Interpretation of mea- surements of the polarization percentage for plasma waves, Ann. Geophys., 10, 82-95, 1992.
SantoIS, O., and M. Parrot, Application of wave distribution func-
tion
methods
to an ELF hiss
event
at high
latitudes,
J. Geophys.
Res., 105, 18,885-18,894, 2000.
SantoIlk,
O., F. Lefeuvre,
M. Parrot,
and
J.L. Rauch,
Complete
wave-vector directions of electromagnetic emissions: Applica- tion to Interball-2 measurements in the nightside auroral zone, J.
Geophys. Res., in press, 2001.
Stix, T. H., Waves in Plasmas, Am. Inst. of Phys., New York, 1992. Storey, L. R. O., and F. Lefeuvre, The analysis of 6-component
measurement of a random electromagnetic wave field in a mag- netoplasma, 1, The direct problem, Geophys. J. R. Astron. Soc., 56, 255-270, 1979.
Tsurutani, B. T., and G. S. Lakhina, Some basic concepts of wave- particle interactions in collisionless plasmas, Rev. Geophys., 35,
491-561, 1997.
Weatherwax,
A. T., J. LaBelle,
and
M. L. Trimpi,
A new
type
of
auroral radio emission observed at medium frequencies (,-,,1350- 3700 kHz) using ground-based reveivers , Geophys. Res. Lett.,
21, 2753-2756, 1994.
Cerisier,
Propagation
characteristics
of dayside
low-altitude
hiss: Wu,
C. S.,
P. H. Yoon,
and
H. P. Freund,
A theory
of electron
cy-
Case
studies,
J. Geophys.
Res.,
97, 10,601-10,620,
1992.
clotron
waves
generated
along
auroral
field
lines
observed
by
Lefeuvre,
F., M. Parrot,
J.L.
Rauch,
B. Poirier,
A. Masson,
and ground
facilities,
Geophys.
Res.
Lett.,
16, 1461-1464,
1989.
M. Mogilevsky, Preliminary results from the MEMO multicom- Yoon, P. H., A. T. Weatherwax, and J. LaBelle, Discrete electro-
ponent measurements of waves on-board Interball 2, Ann. Geo- phys., 16, 1117-1136, 1998.
Means, J. D., Use of the three-dimensional covariance matrix in
analyzing the polarization properties of plane waves, J. Geophys. Res., 77, 5551-5559, 1972.
Menietti, J. D., and C. S. Lin, Ray tracing survey of Z mode emis-
sions from source regions in the high-altitude auroral zone, J.
static eigenmodes associated with ionospheric density structure: Generation of auroral roar fine frequency structure, J. Geophys.
Res., 105, 27,589-27,596, 2000.
Ziebell, L. F., C. S. Wu, and P. H. Yoon, Kilometric radio waves
generated along auroral field lines observed by ground facilities: A theoretical model, J. Geophys. Res., 96, 1495-1501, 1991.
Geophys.
Res.,
91,
13,559-13,568,
1986.
F.
Lefeuvre,
M.
Parrot,
and
J.
L.
Rauch,
Laboratoire
de
Physique
Mogilevsky,
M.M.,
A.M.
Golyavin,
T.V.
Aleksandrova,
T.V.
Ro- et
Chimie
de
l'Environnement,
CNRS,
3A,
Avenue
de
la
Recherche
mantsova,
A.A.
Rusanov,
F. Ji•fEek,
P.
Tffska,
and
B. Poirier,
Scientifique,
F-45071
Orl6ans
cedex
02,
France.
(lefeuvre@cnrs-
Measurements
of
low
frequency
electromagnetic
field
onboard
orleans.if;
mparrot@cnrs-orleans.fr;
jlrauch@cnrs-orleans.fr)
the
Auroral
probe
satellite
in
the
Interball
project:
The
NVK- O. Santoll'k,
Department
of Physics
and
Astronomy,
ONCH experiment, Cosmic Res., 36, 587-592, 1998.
Omidi, N., C. S. Wu, and D. A. Gumett, Generation of auroral kilo-
metric and Z mode radiation by the cyclotron maser mechanism,
J. Geophys. Res., 89, 883-895, 1984.
Persoon, A.M., D. A. Gumett, W. K. Peterson, J. H. Waite Jr., J. L. Burch, and J. L. Green, Electron density depletions in the nightside auroral zone, J. Geophys. Res., 93, 1871-1895, 1988.
University of Iowa, Iowa City, IA 52242-1479, USA.
(ondrej. s antolik @ raft. cuni. cz )